Elastic on Elastic - Using Elastic Observability to optimize the performance of detection rules in Elastic Security


 Share on Twitter
Share on Twitter

 Share on LinkedIn
Share on LinkedIn

 Share on Facebook
Share on Facebook

 Share by Email
Share by Email

 Print this page
Print
Elastic Security’s developer support team has recently seen a surge in reports from customers about sluggish performance in our UI. Our initial inspection of logs for troubleshooting provided some insights, but not enough for a true fix. Luckily, we have Elastic Observability and its APM capabilities to dive in deeper and look under the hood at what was really happening within Elastic Security. And, more importantly, how we could improve its performance for customers.
Here’s the story of how the Elastic Security engineering team optimized the performance of detection rules in order to improve security visibility. In this post, I would like to share some of the details on how we accomplished that goal with Elastic Observability.
The importance of detection rules for Elastic Security
Detection rules are at the heart of Elastic Security. Their job is to search Elasticsearch indices periodically (i.e. logs) for suspicious source events and notify SOC analysts when a rule’s conditions are met.
Elastic Security might execute hundreds and even thousands of detection rules in the background, so their performance is critical, as any slowness could lead to scan gaps and potentially missed alerts and threats.
The main focus was on reducing the median execution time of detection rules per Kibana instance for a given volume of data. Metrics related to memory or CPU usage were not considered since rule execution operations are I/O bound.
Challenges around measuring application performance
One challenge when testing the performance of detection rules is that they run on a schedule in the background. It makes them different from classic REST APIs, to which you can make a series of requests and measure the response time or use off-the-shelf tools such as ApacheBench. We needed a way to collect all the required performance-related metrics during rule execution.
As a team, we were already collecting some execution-related metrics such as total rule execution time and maximum read and write time. While these metrics could answer some questions and help identify rules that execute heavy queries, it was difficult to use this information for general performance testing and identification of bottlenecks.
Another challenge was the many layers of abstractions around the rule execution code. Many teams contribute to the detection engine and the core framework it’s built upon. As a result, when a developer calls a framework’s method, they are not always aware of the database requests being made under the hood since the framework is owned and maintained by other teams.
This makes performance optimizations particularly hard as all the complexity is hidden. To effectively track and understand the performance, the goal was to visualize what’s going on inside the rule executors and track every database request.
Baselining and measuring application performance
Before starting any optimization work, it was important to understand the current situation and collect relevant performance metrics. To endeavor on any optimizations without this context would be like shooting in the dark.
When measuring performance, the first option that came to mind was to use standard Node.js tools like the Performance API and the built-in profiler. However, these tools are pretty low-level and require a substantial time investment to work with. We wanted something simpler and ready to use out of the box. Since Elastic Security and Elastic Observability are built on the same Elasticsearch platform and deliver the value of being able to secure and observe at the same time, we decided to try Elastic Observability. Elastic Observability can be set up to collect performance metrics in a matter of minutes and record important application events — like HTTP requests and database queries — without any prior configuration.
With the APM agent deployed, it was pretty easy to start collecting telemetry data right away.
- Provision Elastic Observability cloud cluster
- Enable and configure Elastic node.js APM agent
(Note: Kibana comes integrated with the Elastic node.js APM agent for self-monitoring, details here.)
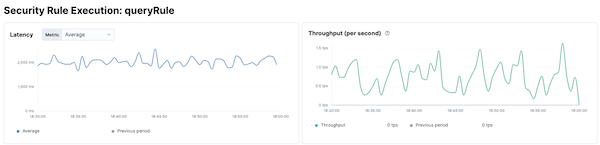
We enabled about 500 detection rules to generate load and navigated to the APM section of Elastic Observability to see tracing details.
Within Elastic APM it was easy to find the rule execution transactions and the corresponding performance charts quickly.
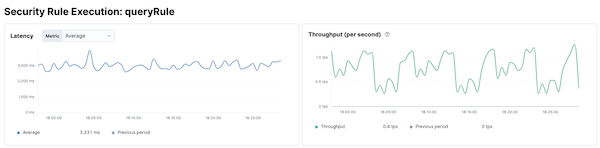
With the out-of-the-box average rule execution latency and distribution as initial parameters and baseline, all consequent optimization work would be compared to these numbers.
The optimization process for Elastic Security
Once we had gathered the initial, baseline numbers, it was now time to start searching for optimization opportunities.
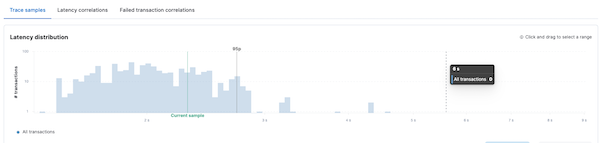
By default, the Elastic APM agent collects all outgoing requests and Elasticsearch queries. Distributed traces with rich contextual information about user, url, payload, and query details are also provided out of the box by Elastic Observability.
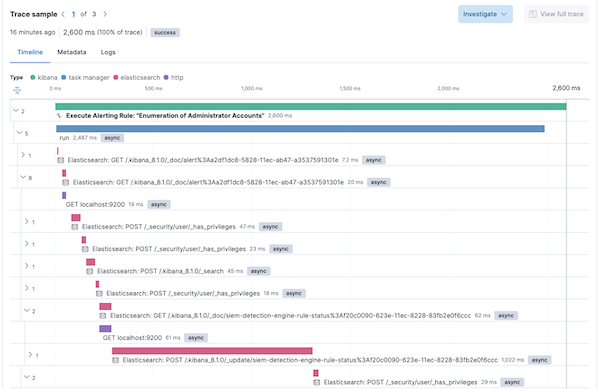
By simply reviewing the trace, one can visualize the paths that the code follows under the hood making it possible to spot bottlenecks. For example, it was apparent which outgoing Elasticsearch queries were taking the longest to execute among the transactions.
It is also worth noting that code path uniformity should be considered when examining performance. The analyzed code may have logical conditions that significantly affect the number of operations performed. For example, cached data or exceptions lead to early execution termination. And if a mixture of transactions with different spans count falls into the analyzed sample, this can significantly skew the final results. So prepare in advance different execution paths and split the tests into homogeneous groups.
To provide even more information about the execution of a specific code path, we added custom instrumentation to executors with spans. Spans add contextual information to executed code blocks like name, labels, outcome, etc. That way, we could visualize actual business logic rather than raw method calls.
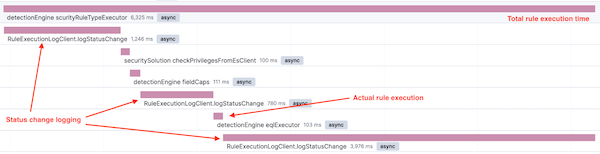
After identifying the slowest methods, it’s time to analyze code for performance problems. Some of the glaring issues identified were:
- Inefficient database calls - Analyzing spans highlighted a couple of database calls that request the same data from different places. This was easy to fix by reorganizing the code.
- Lack of parallelization - Some requests were being sent serially instead of being sent in parallel.
- Usage of refresh=wait_for - When writing documents we often included this parameter unnecessarily. This parameter makes every Elasticsearch write operation wait for an index update, which adds up to one extra second to every call.
- Lack of batching - Many documents were written in a row instead of buffering write operations and sending only one bulk write request to the database.
Results of application optimization with Elastic Observability
Some of the issues surfaced were easy to fix, so I decided to take the initiative and corrected them right away. That first optimization pass led to a reduction in the average rule execution time of about 30%.

This investigation also sparked several inter-team discussions and has resulted in plans to invest even more time to make rule executors even faster. Optimizing application performance is a never-ending goal for developer teams but with Elastic Observability, we can approach this work systematically and with real data points.
Observability and Security on a unified platform
As oftentimes with software development, the identified performance issues could have been avoided. Instead of optimizing the performance of detection rules after the fact, a more proactive approach would have been preferable. Teams should consider increased instrumentation at the start of development work to collect performance data. With a proper observability solution in place, teams can incorporate performance review as part of their standard code review process proactively and fix performance issues in earlier development stages.
This optimization project was a great example of the better-together nature of the Elastic Security and Observability solutions. My knowledge and expertise around Elastic Security made it very easy for me to learn Elastic Observability, deploy the solution, and quickly find real answers. With Elastic, it’s easy to leverage your Elasticsearch expertise for both observability and security initiatives. And what better place to put that perspective into practice than right here at Elastic.
If you’re new to Elastic and want to give both the Observability and Security solutions a spin, you can start a free 14-day trial of Elastic. Please share any feedback on the Elastic Discuss forum or the Elastic Stack Community on Slack.
Share
- Share on Twitter
Share on Twitter
- Share on LinkedIn
Share on LinkedIn
- Share on Facebook
Share on Facebook
- Share by Email
Share by Email
- Print this page
Print