Elastic Observability helps monitor your Azure workloads on the new Arm-based VMs

 Share on Twitter
Share on Twitter

 Share on LinkedIn
Share on LinkedIn

 Share on Facebook
Share on Facebook

 Share by Email
Share by Email

 Print this page
Print
Microsoft Azure’s recently launched new Azure Virtual Machines (VMs) feature the Ampere Altra Arm-based processor. These new VMs are engineered to efficiently run horizontally scalable workloads such as web servers, application servers, and open source databases. They deliver excellent price-performance and represent an important addition to Microsoft Azure's portfolio of instance types.
Elastic Observability can give you a holistic view of your cloud resources as you migrate your workloads to the new Arm architecture. Elastic’s native Azure Integration for Activity Logs, VM and Container Metrics along with Elastic APM allows you to collect logs, metrics, and traces for the Azure platform and applications running on it. Once deployed, you can easily compare the performance between Arm-and x86-based architectures. It also allows you to:
- Track resource usage and application performance
- Compare costs between instance groups
- Alert upon system failures
- Monitor and optimize SQL DB deployments
Deploy the Elastic Agent and start observing your Azure environment
Data ingest is a critical — and often time-consuming — piece of observability workflows. How quickly can you visualize and get key insights from this data? Now multiply this by the thousands of components — hosts, containers, applications, and more — in your environment, and visibility into the operational aspects such as deployment, configuration, and upgrades, become just as critical.
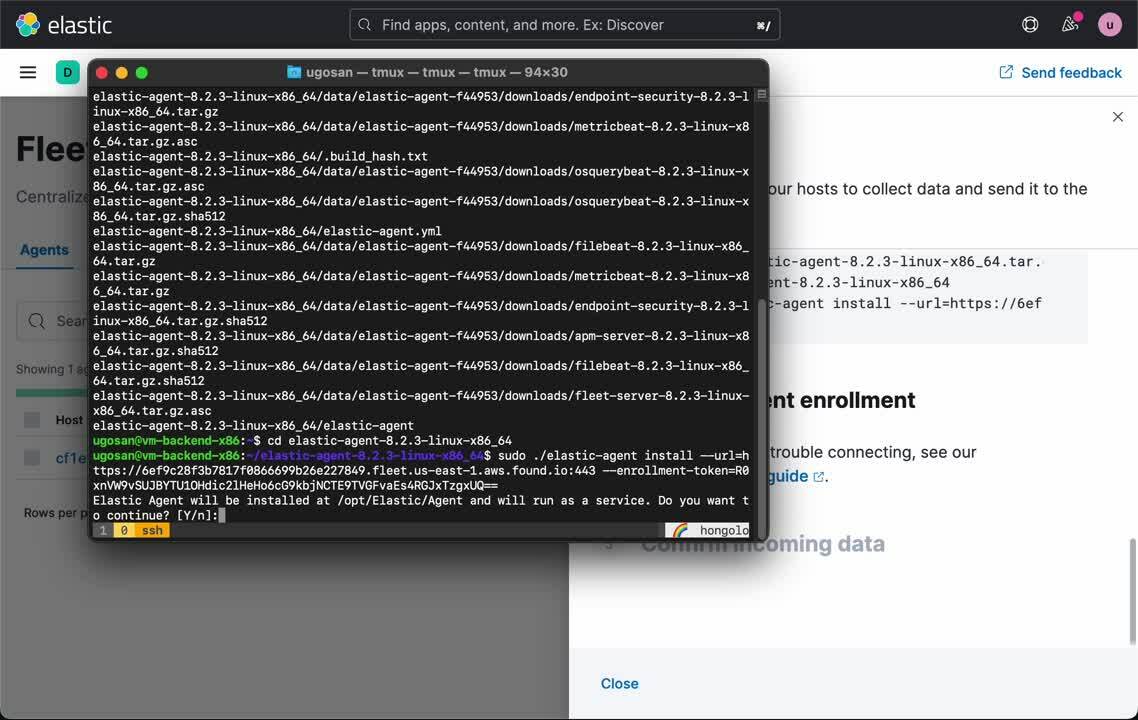
It all starts by deploying our Elastic Agent — a single, unified way to add monitoring for logs, metrics, and other types of data to a host. It can also protect hosts from security threats, query data from operating systems, forward data from remote services or hardware, and more.
Deploying our Elastic Agent can be done with a few clicks in seconds:
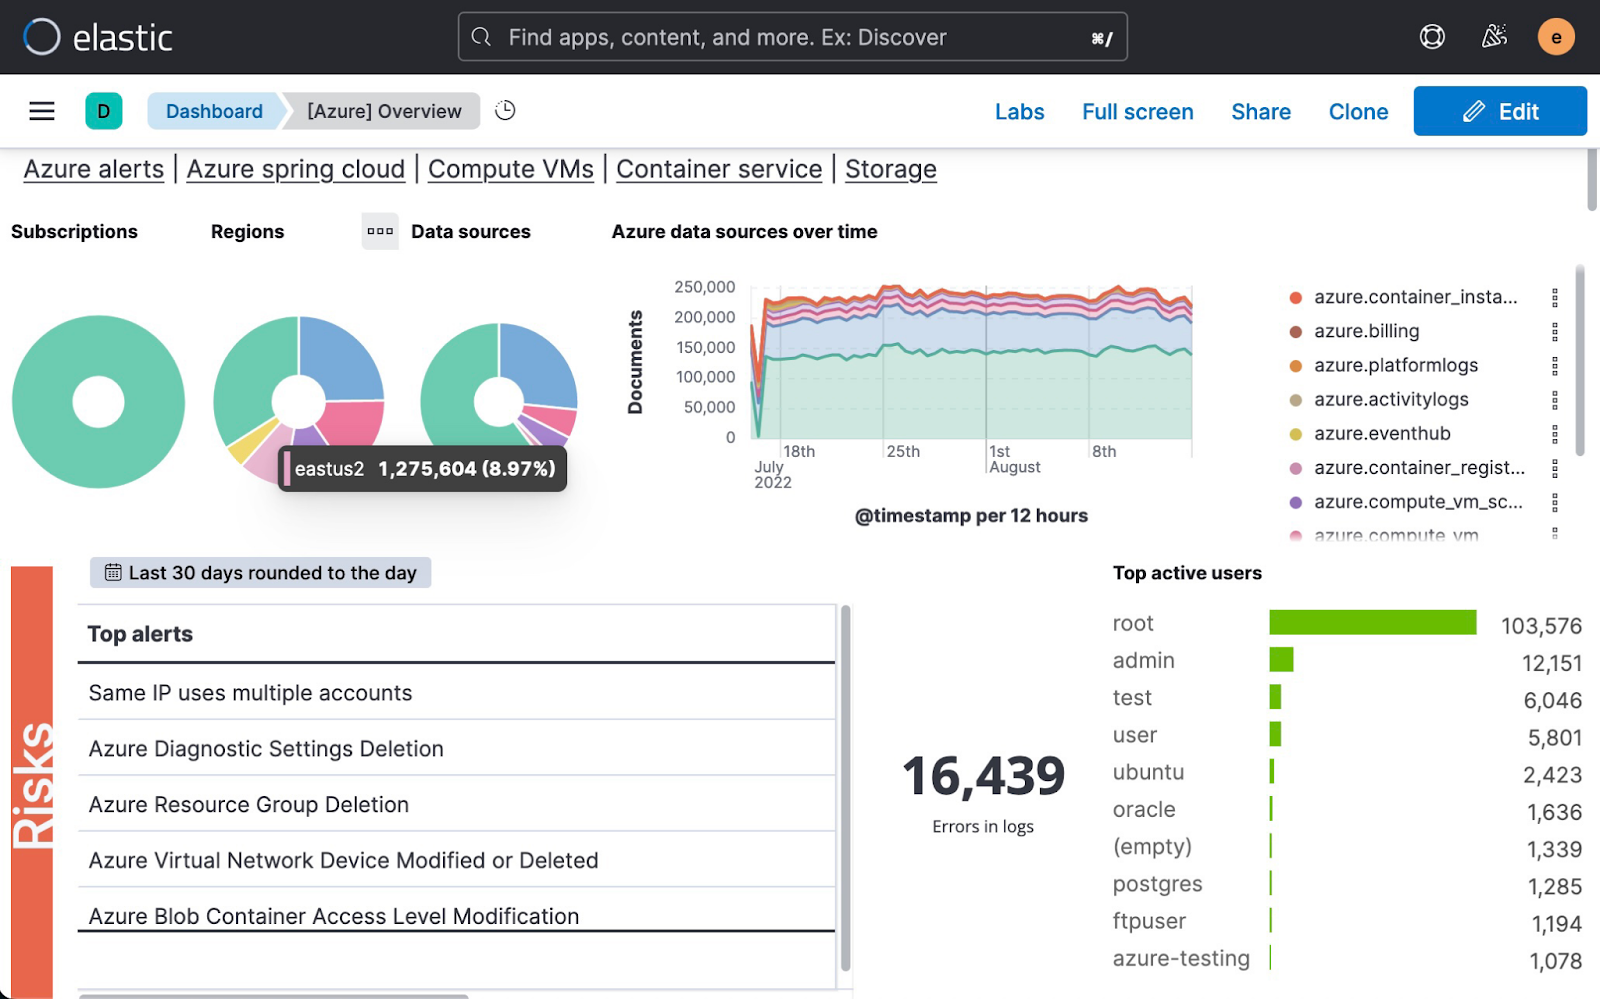
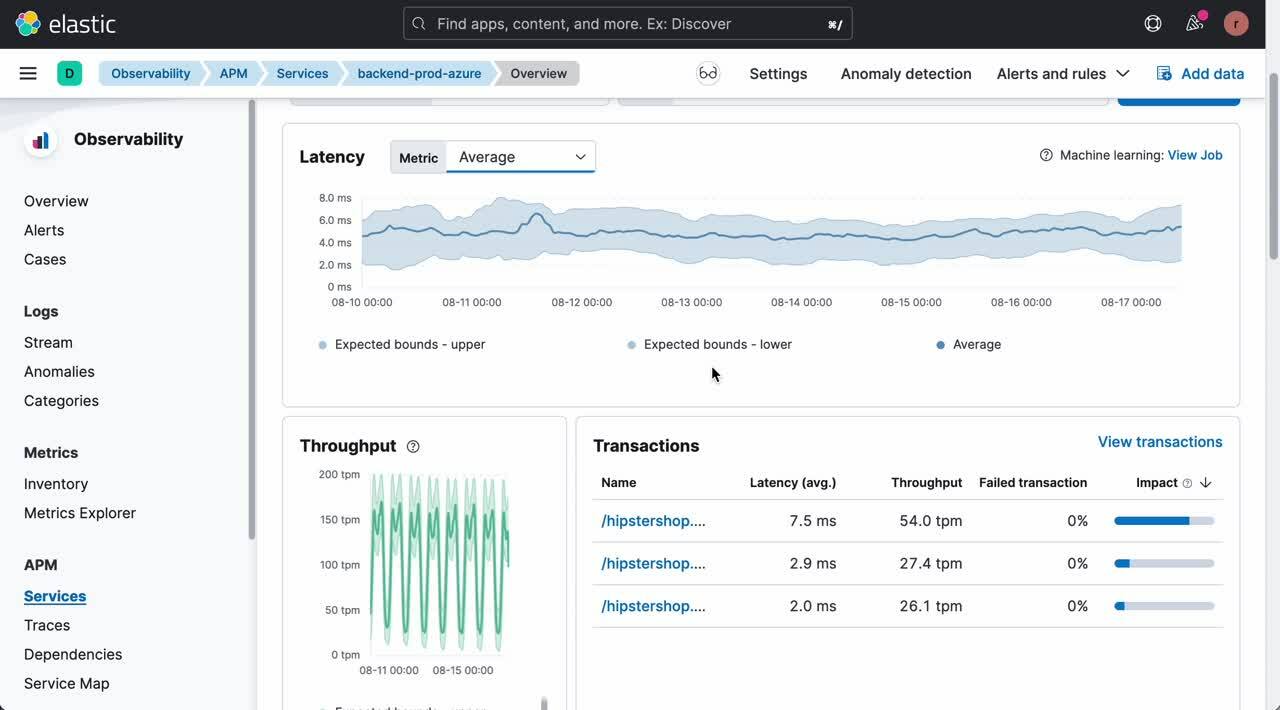
Now that you have data flowing from the Elastic Agent you have several Azure integrations to choose from. Elastic provides out of the box dashboards that allow you to track resource usage and performance across multiple instances in your Azure subscription.
Analyze resource performance with Elastic Agent's Azure integration
The Azure Monitor integration collects and aggregates logs and metrics from a variety of sources into a common data platform, leveraging the Elastic Common Schema (ECS) for standardization, where it can be used for analytics, visualization, and alerting.
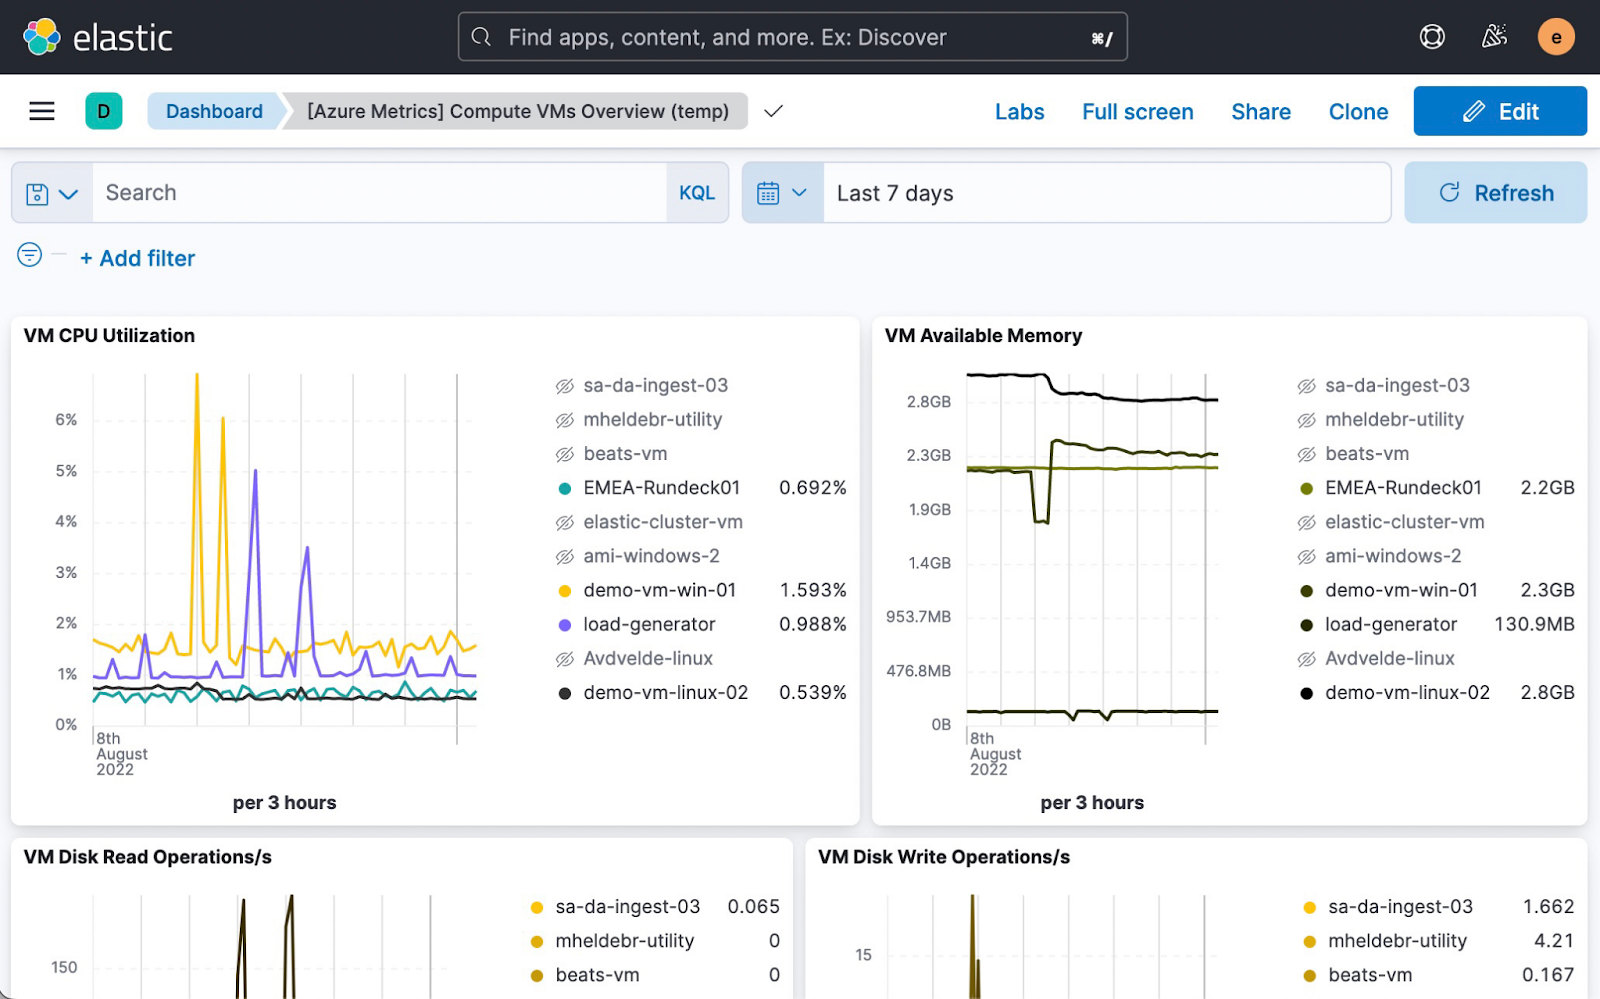
The Azure Virtual Machines Metrics integration collects and aggregates storage account related metrics from virtual machine type resources where it can be used for analysis, visualization, and alerting. The Azure Compute VM will periodically retrieve the Azure Monitor metrics using the Azure REST APIs as MetricList. Additional Azure API calls will be executed in order to retrieve information regarding the resources targeted by the user.
You can go further than collecting metrics, getting even more visibility into your deployment by ingesting Azure subscription logs and Azure resource logs. Together they can provide an overview of the Azure platform to help you better audit activity within Azure. These logs can easily be exported to Azure Event Hub and collected by Elastic Agent with a few clicks.
AIOps for applications deployed in Azure with Elastic APM
The APM integration receives performance data directly from your application and sends it to Elastic Agent. To simplify APM deployment, Elastic Observability provides automatic instrumentation for multiple technologies and languages such as .NET, Python, Java, iOS, and much more. It automatically collects unhandled errors and exceptions, so you can identify new errors as they appear and keep an eye on how many times specific errors happen.
Elastic APM also leverages advanced AIOps and machine learning for automated anomaly detection and quick correlation of infrastructure and application metadata for streamlined troubleshooting.
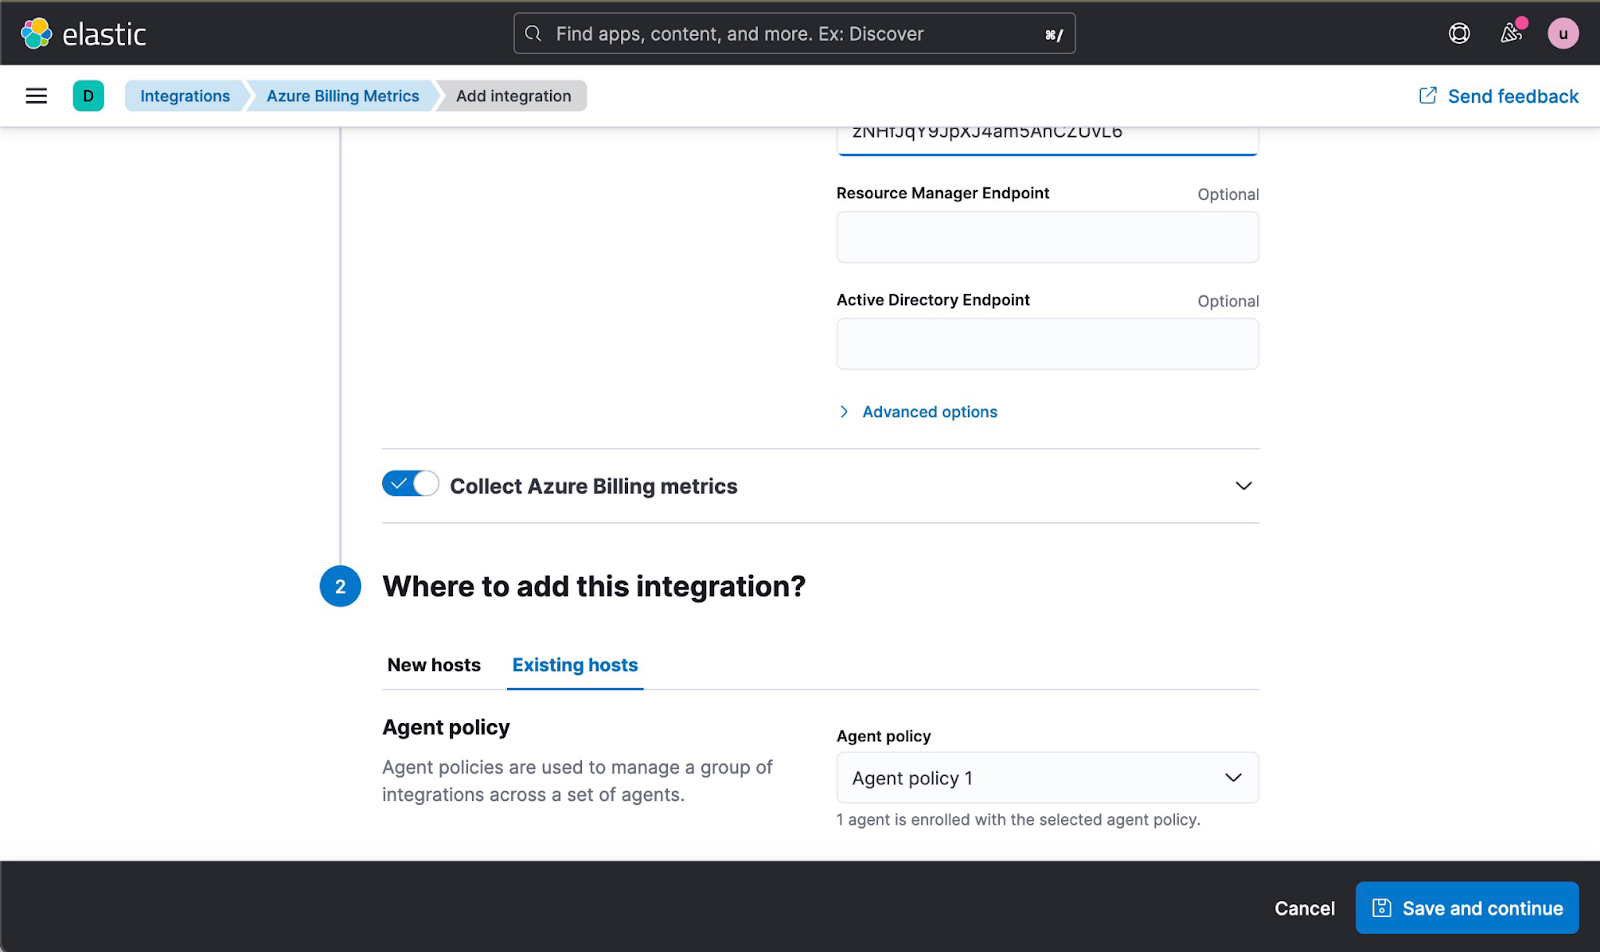
Comparing cost between Arm and x86 instances with Azure Billing
The Azure Billing integration allows users to retrieve usage details and forecast information of the subscription being managed. Enabling this integration can be done with a few clicks.
Once you have data flowing through Elastic Agent and being stored in Elastic, you can easily compare costs between different instances or different applications. Dashboards in Kibana let you rapidly create views that pull together charts to display the full picture of data coming from Azure Billing.
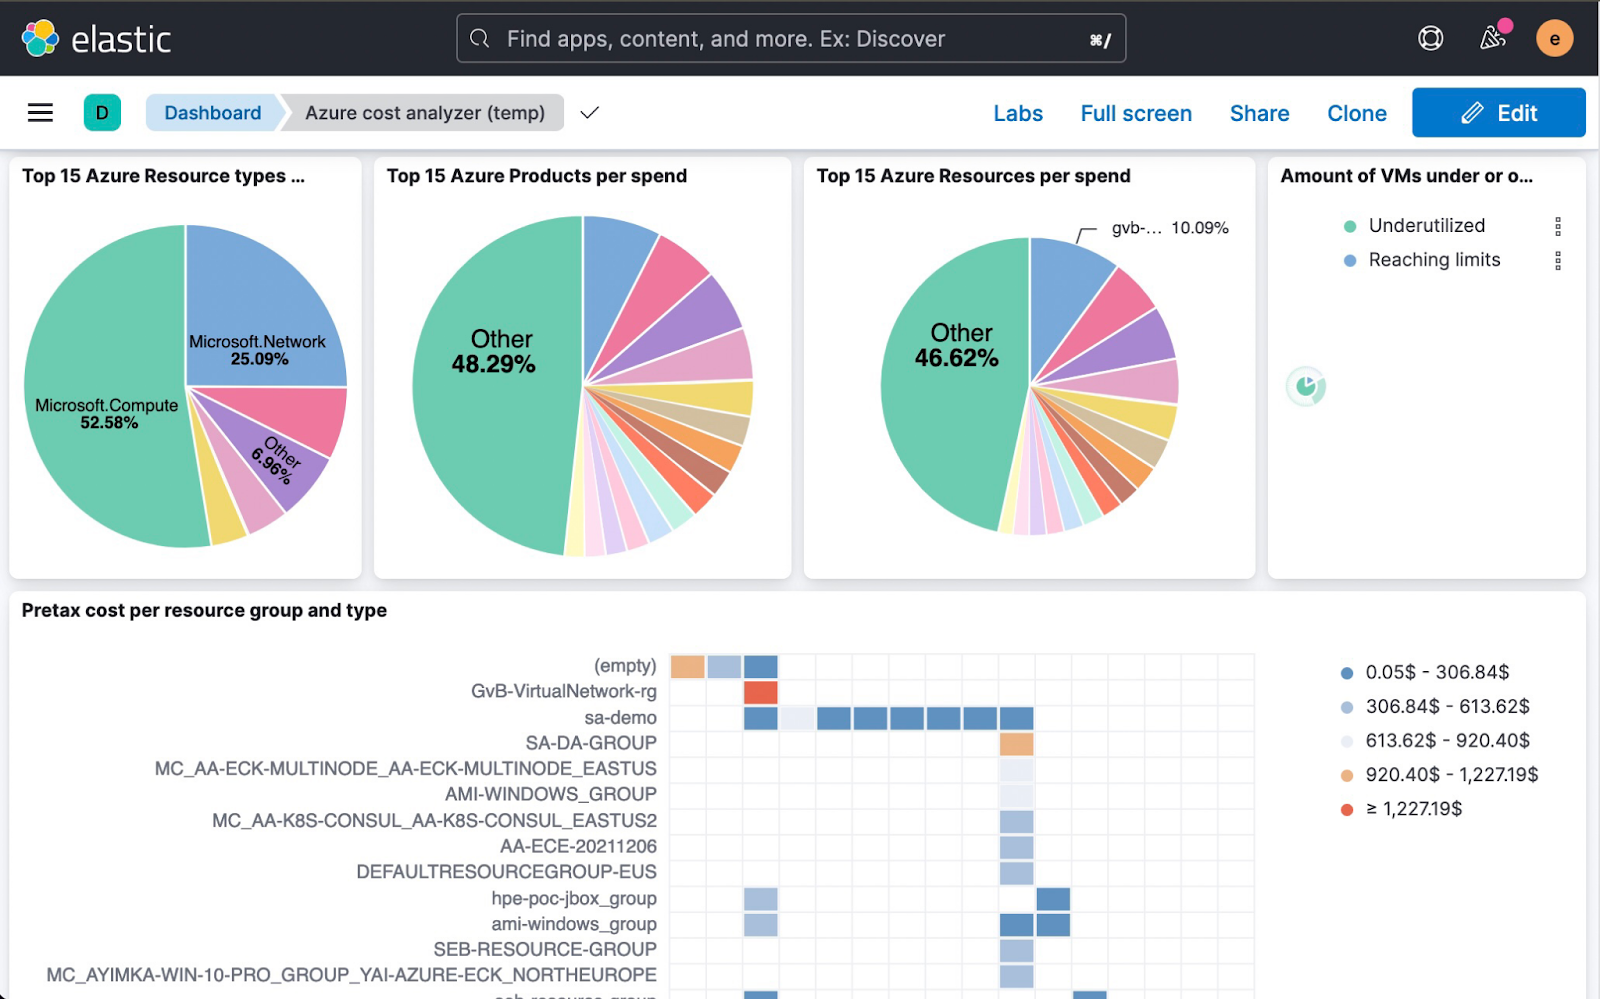
A single datastore for all your observability data is essential for cross-source investigative workflows and helps lower mean time to resolution. This is why having a unified observability for your cloud ecosystem is so important, and Elastic Observability allows you to unify the three pillars of observability (logs, metrics, and traces), giving you the complete picture across infrastructures — cloud and on-premises.
Give Elastic Observability a try
It’s easy to get started with Elastic Observability in Azure Marketplace. Building on the recent launch of Elastic Cloud in four new Azure regions (Brazil, Canada, India, and South Africa), you can quickly spin up a deployment in minutes on any of the 16 Elastic Cloud on Azure regions around the world. Additional regions are planned in the future, so you can run Elastic to solve your organization’s challenges wherever your data resides — with lower latency and greater service resilience.Get started with Elastic on the Microsoft Azure Marketplace today and to learn more about the latest Azure VMs featuring Ampere Altra Arm-based processors please refer to the Microsoft blog.
Share
- Share on Twitter
Share on Twitter
- Share on LinkedIn
Share on LinkedIn
- Share on Facebook
Share on Facebook
- Share by Email
Share by Email
- Print this page
Print