Integrating Maps into Elastic SIEM
Editor’s Note — August 19, 2020: The Elastic SIEM solution mentioned in this post is now referred to as Elastic Security. The broader Elastic Security solution delivers SIEM, endpoint security, threat hunting, cloud monitoring, and more. If you're looking for more specific information on Elastic Security for SIEM use cases, visit our SIEM solution page.
It was just two months ago that Elastic Maps went GA, and today we’re excited to announce its integration into the Elastic SIEM app. In this blog post, we’ll take a tour of this integration, and explore new and future SIEM map features.
Implementation details
Off the heels of integrating machine learning in 7.3, the time was ripe to start visualizing geospatial data in the SIEM app, but the scope of what we could accomplish before the next release was a bit foggy. In the end, this proved to be a fine exercise in first principles thinking as the technologies and APIs we needed to use were either brand new, non-existent, or in flux.
To be useful for our users, this initial integration needed to:
- Work with ECS-compliant indices with minimal additional configuration
- Provide the ability to filter data on the map via the global time filter and query bar
- Display document details when interacting with source/destination points or their paths
- Filter on any of these document details at the page level
By setting these base requirements and then deep diving into each one, we were able to quickly determine their constraints and develop an initial implementation that met our needs. With this we could start receiving valuable user feedback, and also provide our own feedback to both the Maps and Platform teams here at Elastic, which will help improve the ease of integrating maps and other shared components throughout Kibana.
Alright stop, collaborate and visualize
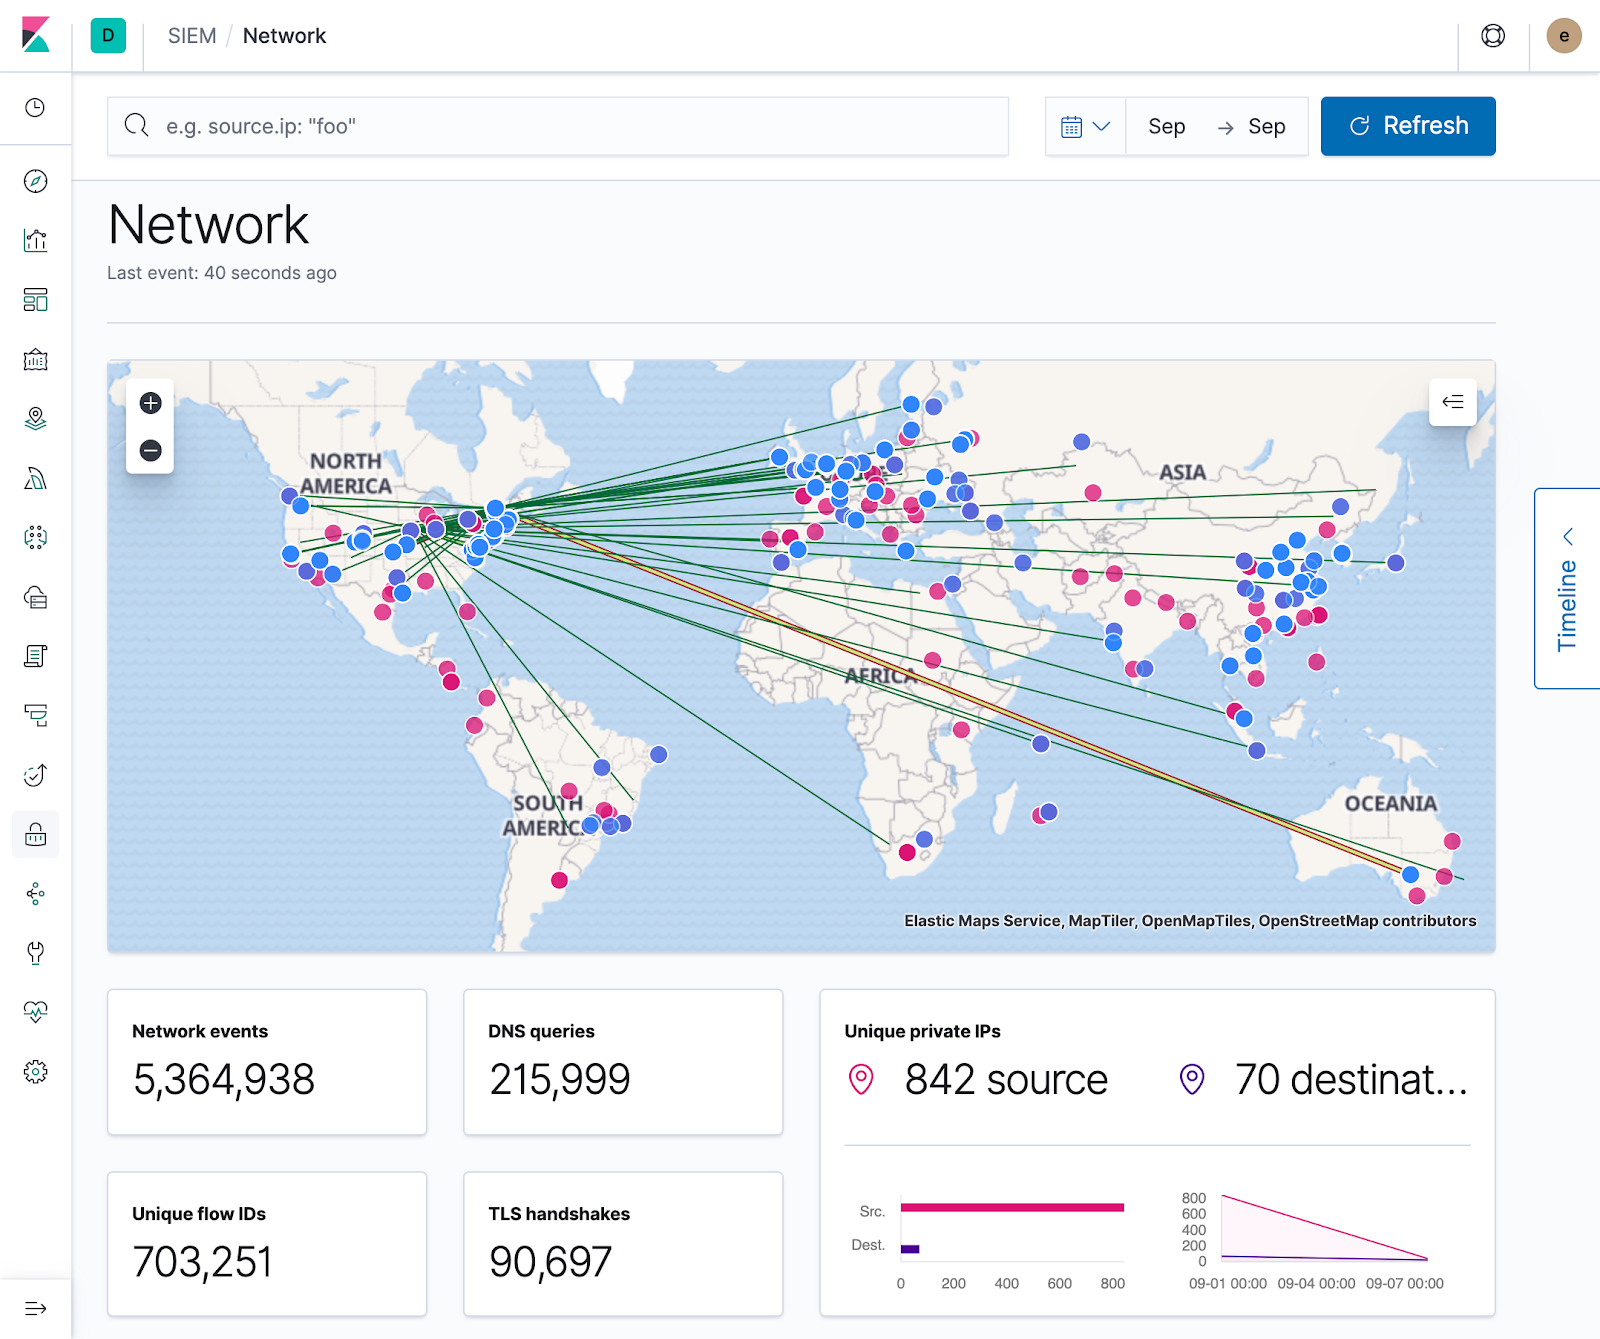
You can visualize a lot of information on a map, but no SIEM is complete without a pew pew map. While their usage varies on implementation, they are a great way for quickly visualizing where your data is coming from, and act as a stepping stone to more detailed and specific geospatial visualizations.
Although Maps are GA, there wasn’t a data source we could use for displaying line geometries between sources and destinations. In addition, we needed to ensure this would work out of the box with the ECS-compliant Geo fields so we could minimize the complexity of any additional ingestion steps. To this end, the Maps team pulled through in what would become the first of many requests, and created a new point-to-point data source that we could use to accomplish this.
Paired with the new Embeddables API, we had everything we needed to build out the SIEM app’s first take at visualizing and interacting with geospatial data.
Baseline configuration (GeoIP processor/internal IPs)
With the map on the screen, and our features functioning as anticipated, it was time to ensure that our getting started experience was as pain-free as possible. To ensure the map loads quickly, all necessary data layers are generated on the fly for each configured Kibana index pattern. This includes a layer for displaying source.geo.location, another for destination.geo.location, and a third for displaying the connecting geometries. To display points on the map, the dataset must include either source or destination geo data, and both must be present to see the connecting lines.
Ensuring the existence of either source or destination geo.location is fairly easy when using Beats + Elasticsearch’s GeoIP Processor. Simply configure the processor, add the pipeline to your Beats config, and you’re good to go! This will get source and destination points on the map, but unless all your data is from public IPs, you won’t be able to visualize the interconnecting traffic. Luckily, there’s an easy solution for that! As detailed in the docs, you can include an add_fields processor in your Beats config to map an internal IP to a specific geo location. Once configured, your data will be enriched with all the necessary information for visualizing it on the map. Huzzah!
Maps today
Today with maps you can visualize sources, destinations, and traffic flow. Filtering to specific events and time ranges allows you to narrow your investigation, and interacting with the map provides quick links to Host/IP Details and the ability to filter on Hostname, IP, Domain, or ASN. With these core features, security professionals can already use the map to pivot on suspicious network flows and events.
Maps tomorrow
Out of the box, the map is a two-way street — you not only have control over the data it shows, but you can also filter the other visualizations on the page directly from the map. This was crucial for our initial implementation, but we have much more that we’re excited to add in terms of interactivity. With the ability to provide custom tooltips, we’ll be able to join the map with the power of the Timeline and also provide context sensitive actions and information from the selected data point. Whether that’s anomaly scores for IP addresses, reputation links, or other useful actions (such as filtering to a specific time interval), custom tooltips will increase the ability to quickly sort through data and facilitate investigations.
Thanks for tagging along on our SIEM map integration journey! We encourage you to try out these new features for yourself, and if you don't have your own 7.4 cluster, spin up a free, 14-day trial of Elasticsearch Service. And if you have any feedback or thoughtful features, please reach out on the SIEM Discuss forum, or open a feature request on GitHub. Happy mapping!