How to troubleshoot the Elastic App Search web crawler
In case you hadn’t heard, we recently released a brand new web crawler for Elastic App Search. The web crawler provides a simple way to ingest publicly available web content and make that content instantly searchable on your website.
Configuring the web crawler to start ingesting data from your website is super easy — it’s just a matter of a few clicks. This sounds great, but what if after crawling there are no pages being indexed or you feel some pages are missing? How can you easily narrow down the issue and fix it?
In this blog post, we’ll first demonstrate how to configure the web crawler with App Search. Then we’ll troubleshoot its execution to identify and fix any errors we might have made during the configuration.
Manage the web crawler
Deploy App Search
First, you need to deploy App Search, which can be done in a few clicks with a free 14-day trial on Elastic Cloud, or you can download and install it on-prem.
You can then create your first App Search engine. In our case, we’re going to use the Elastic blog website as a data source, so we just name the engine elastic-blogs.
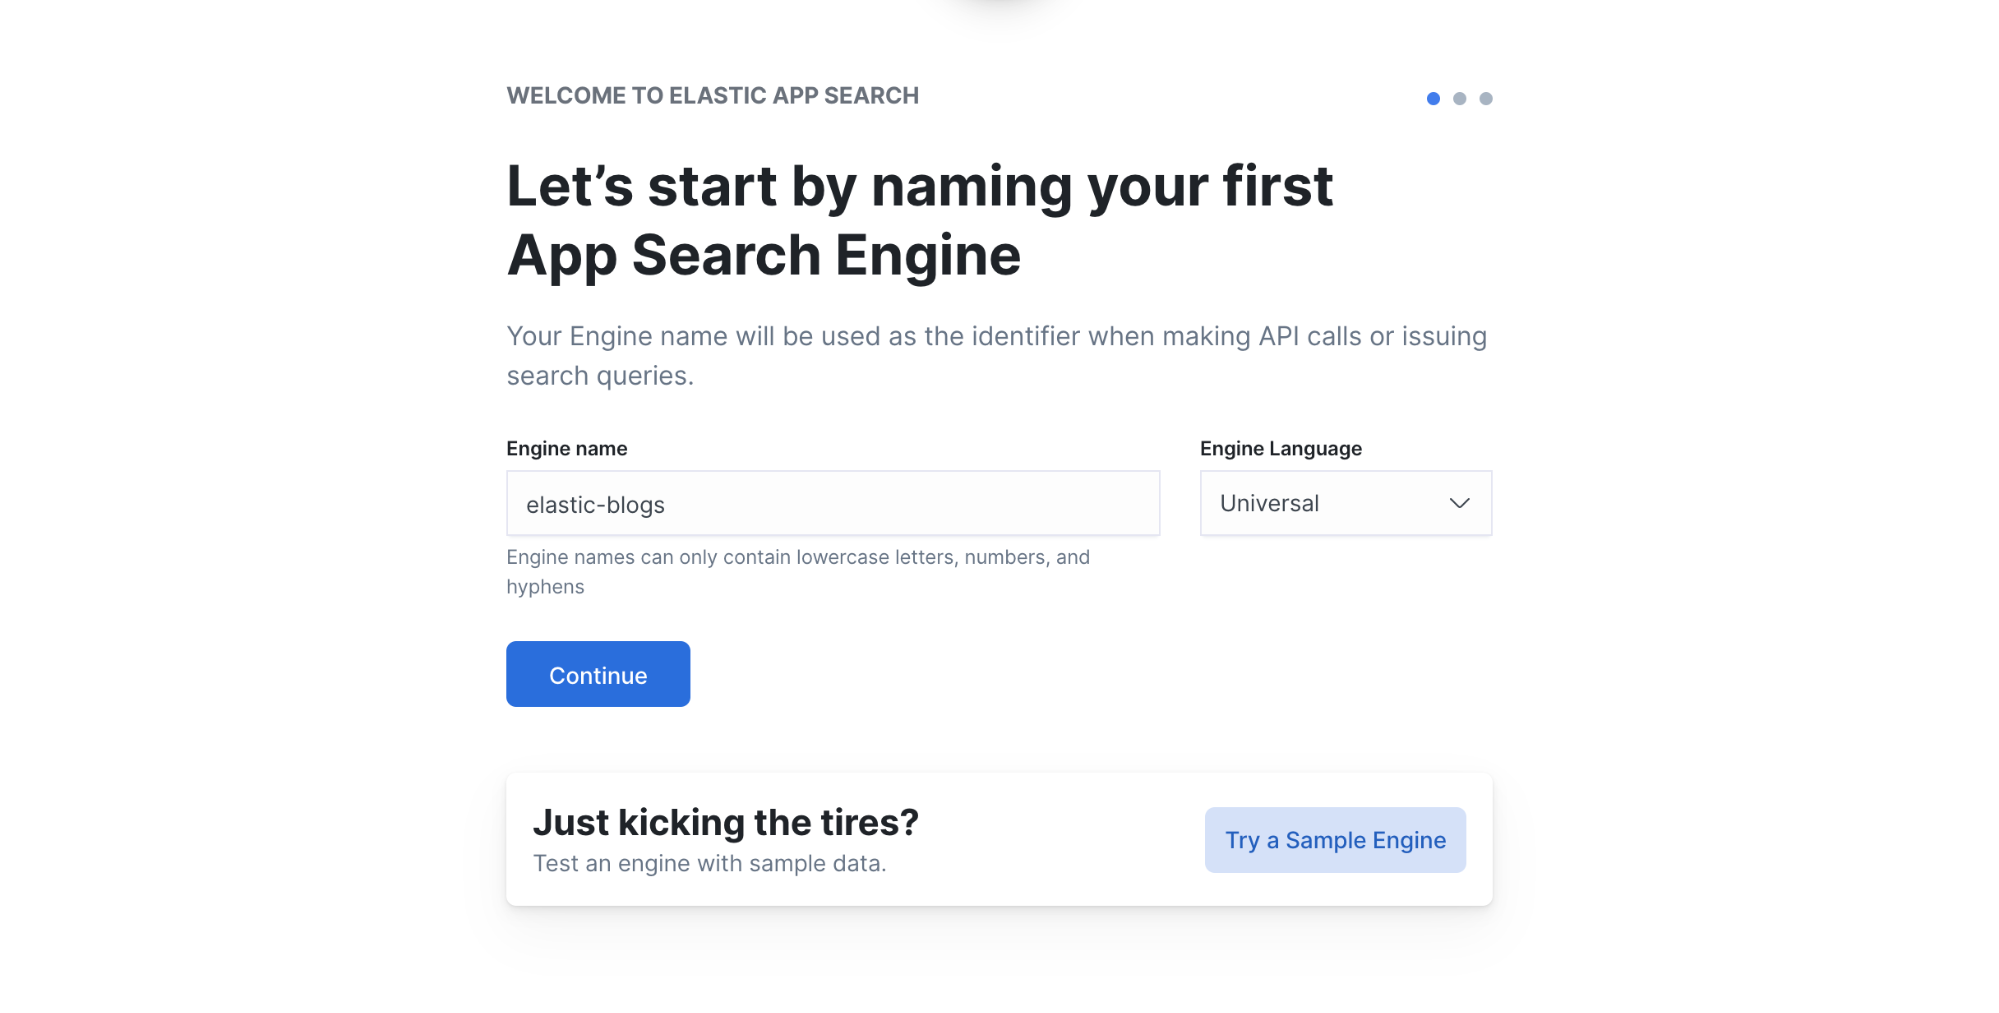
Once the engine is set up, go to Web Crawler in the App Search Admin UI to start ingesting documents.
Configure the web crawler
Note: The following steps deliberately contain a misconfiguration error in order for us to troubleshoot it later in the post.
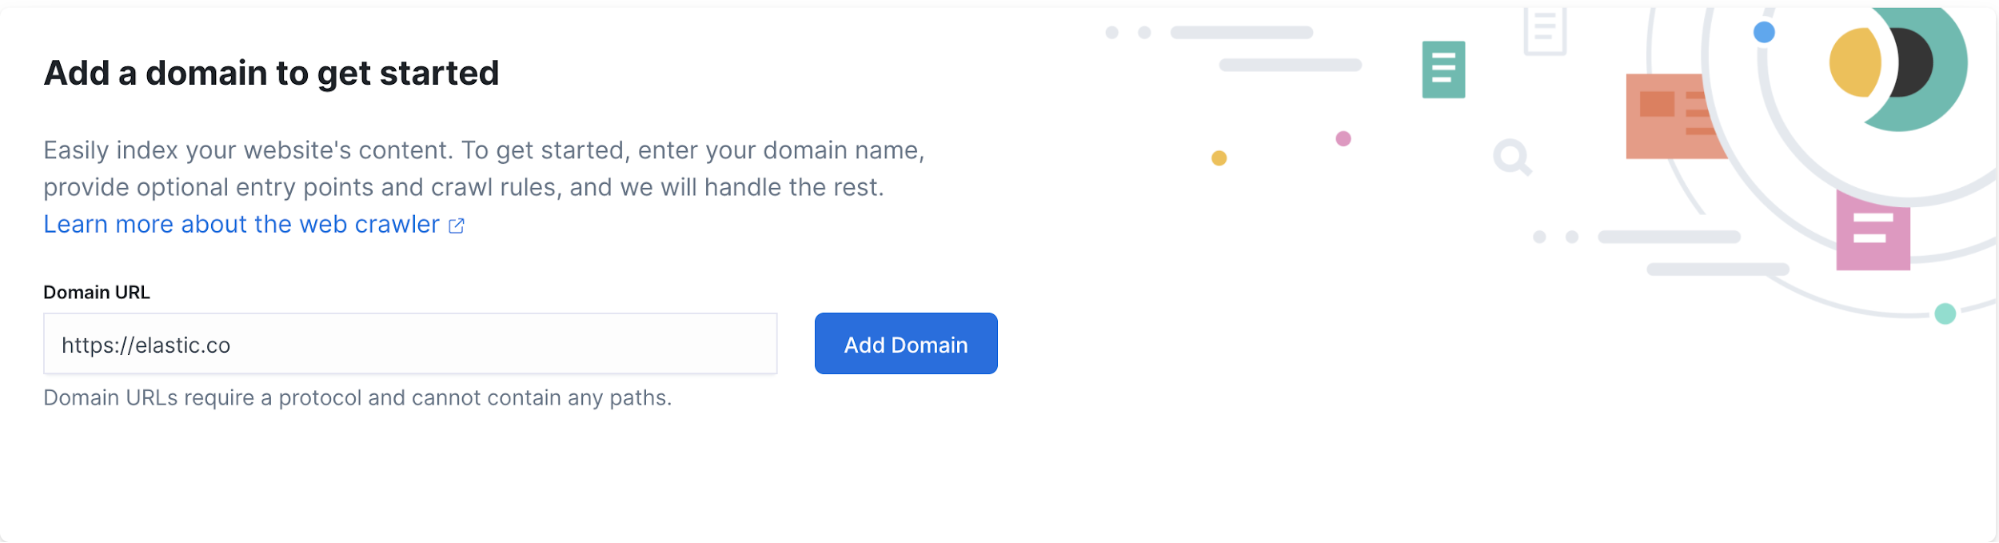
When configuring the web crawler, the first information to provide is the entry point of the website we want to crawl. In our case, we type https://elastic.co for the Domain URL and then click Add Domain.
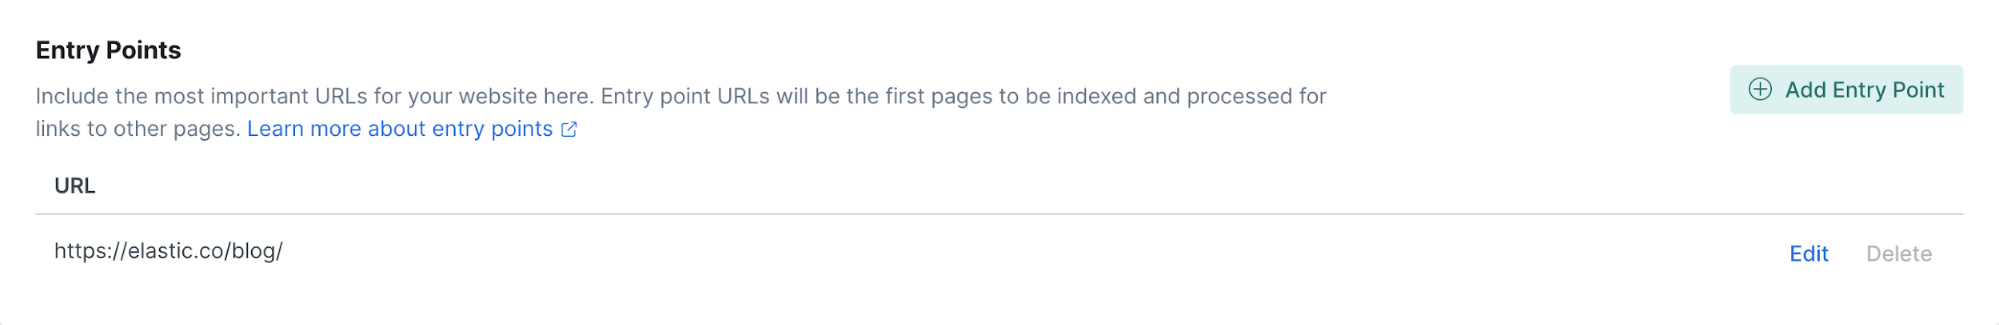
In the next screen, the entry point can be edited to specify where the web crawler should start crawling. In our case, we can add the full path to https://elastic.co/blog/. This will speed up the process of crawling as it starts directly from the place we’re interested in.
The second part is the crawling rules, which enable us to target only the contents we’re interested in. For each page the web crawler discovers, the crawling rules are applied in sequential order against the URL. The first rule that matches the URL is applied.
In our case, we’re interested only in the blogs, so we want to exclude the rest of Elastic website. Let’s add the following rules:
- Allow | Begins with | /blog/
- Disallow | Regex | .*
Each page of the Elastic website will be evaluated against these rules, which allow only URLs that start with /blog/.
Using the same logic, we can implement more complex rules. Let’s say we want to exclude pages under the path /blog/ that summarize blogs per category or author. We can just add a new rule using a regular expression as follows:
- Disallow | Regex | /blog/author
- Disallow | Begins with | /blog/category
As a result, we have the following rules configured:
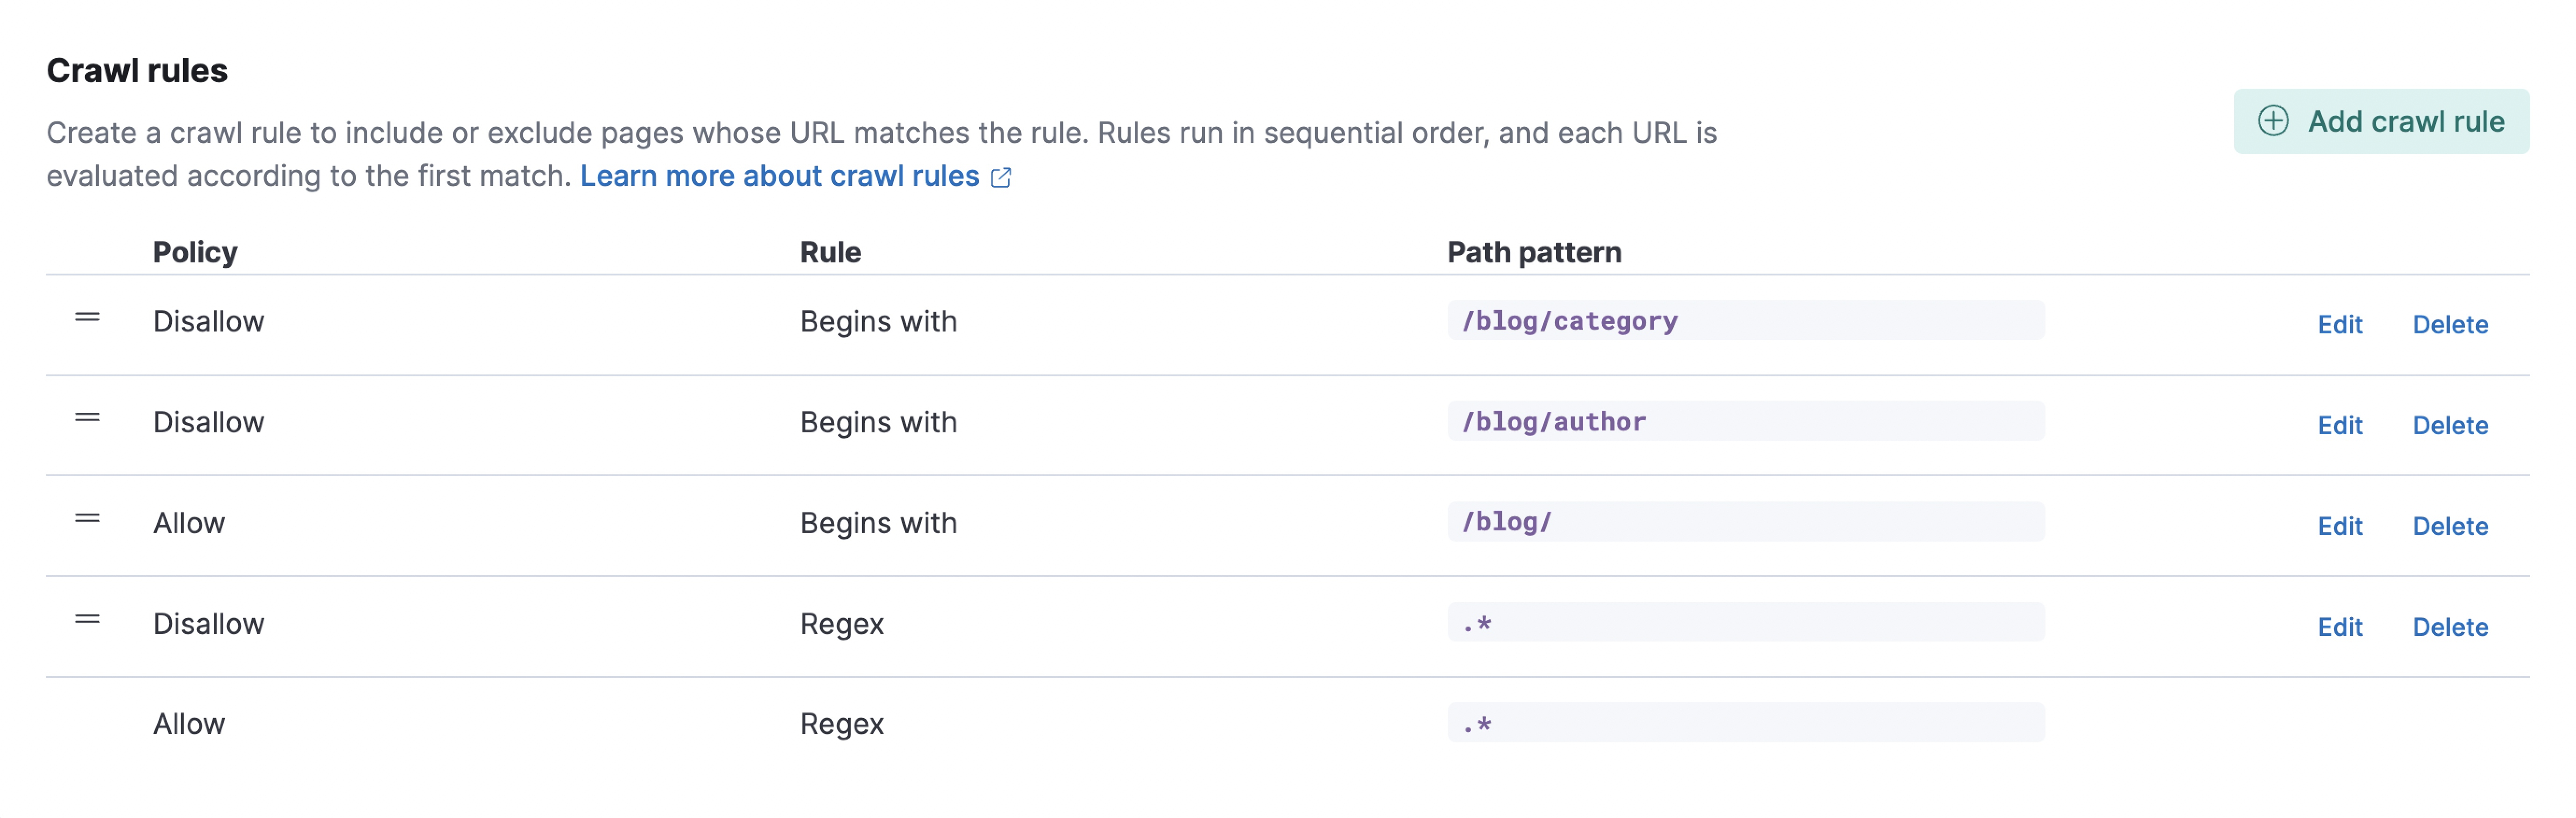
The last rule cannot be moved. This is a default rule that allows the page to be indexed if no other rules have matched.
Run the web crawler
Now that we’ve configured the web crawler, we’re ready to start crawling the blogs from the Elastic website. Let’s hit the Start Crawling button to begin ingesting documents.
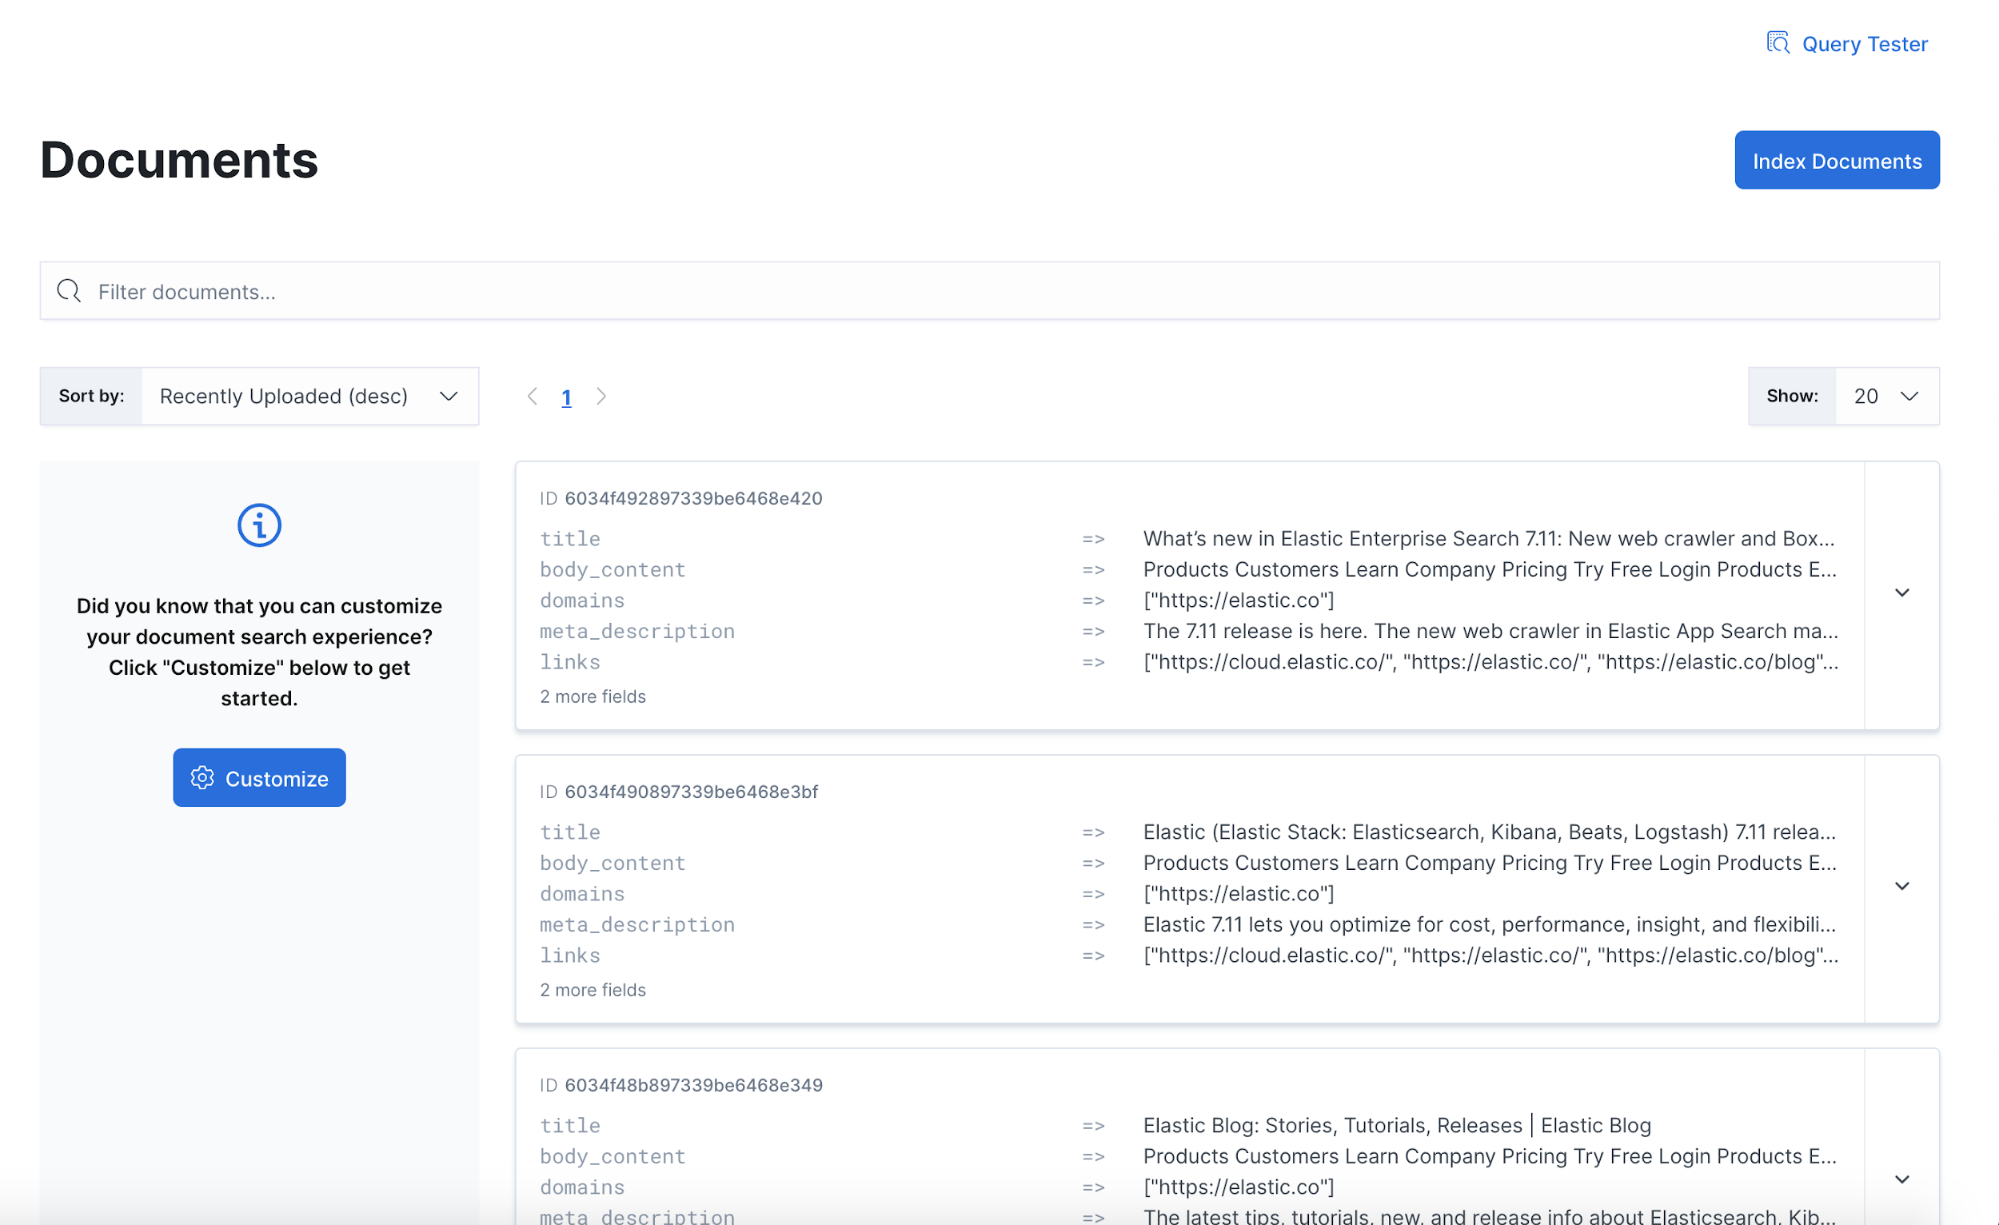
Shortly after, you’ll see documents being indexed. You can see them by navigating to the Documents view.
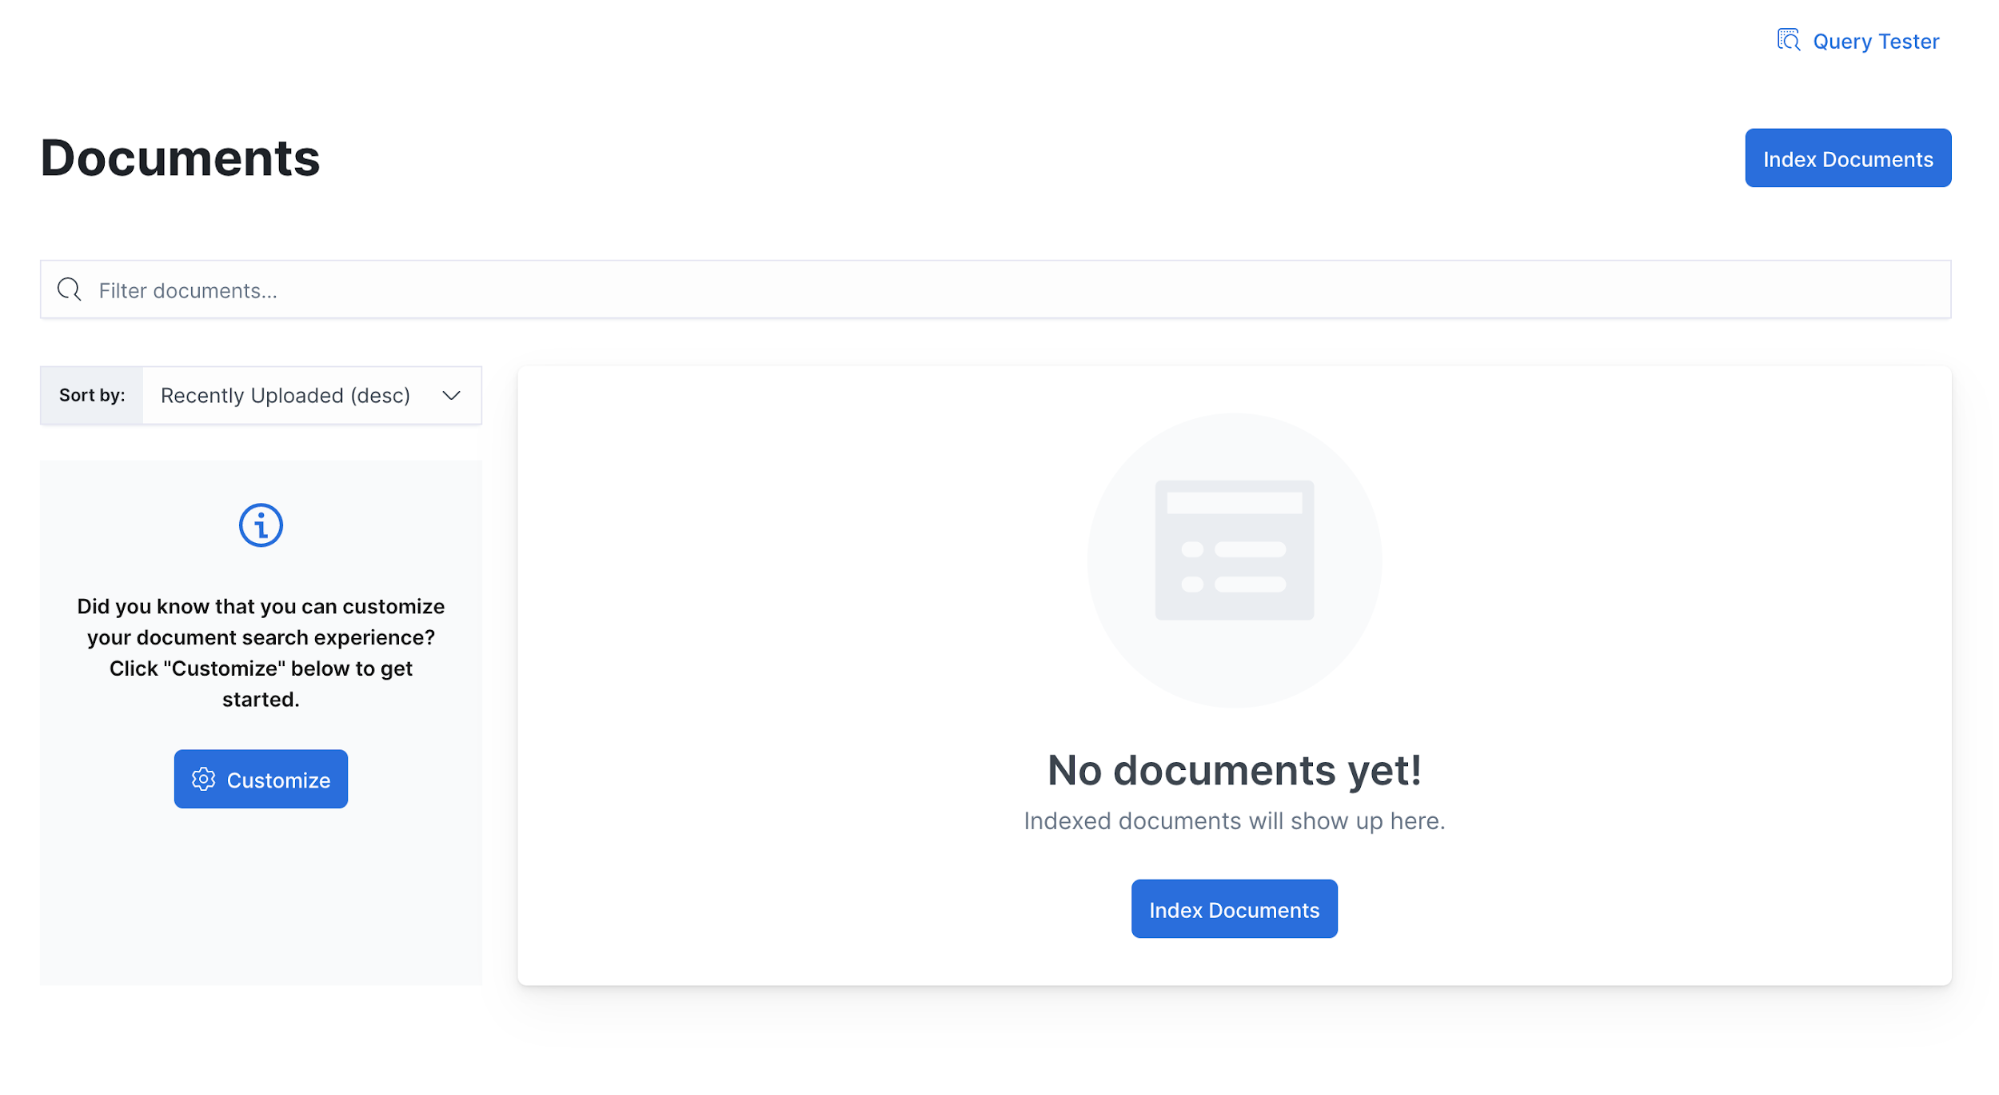
Well, something must be wrong — we have no documents indexed. Let’s investigate.
Monitor the web crawler execution
Check the execution outcome
First, we can check the status of the web crawler execution in the Web Crawler view.
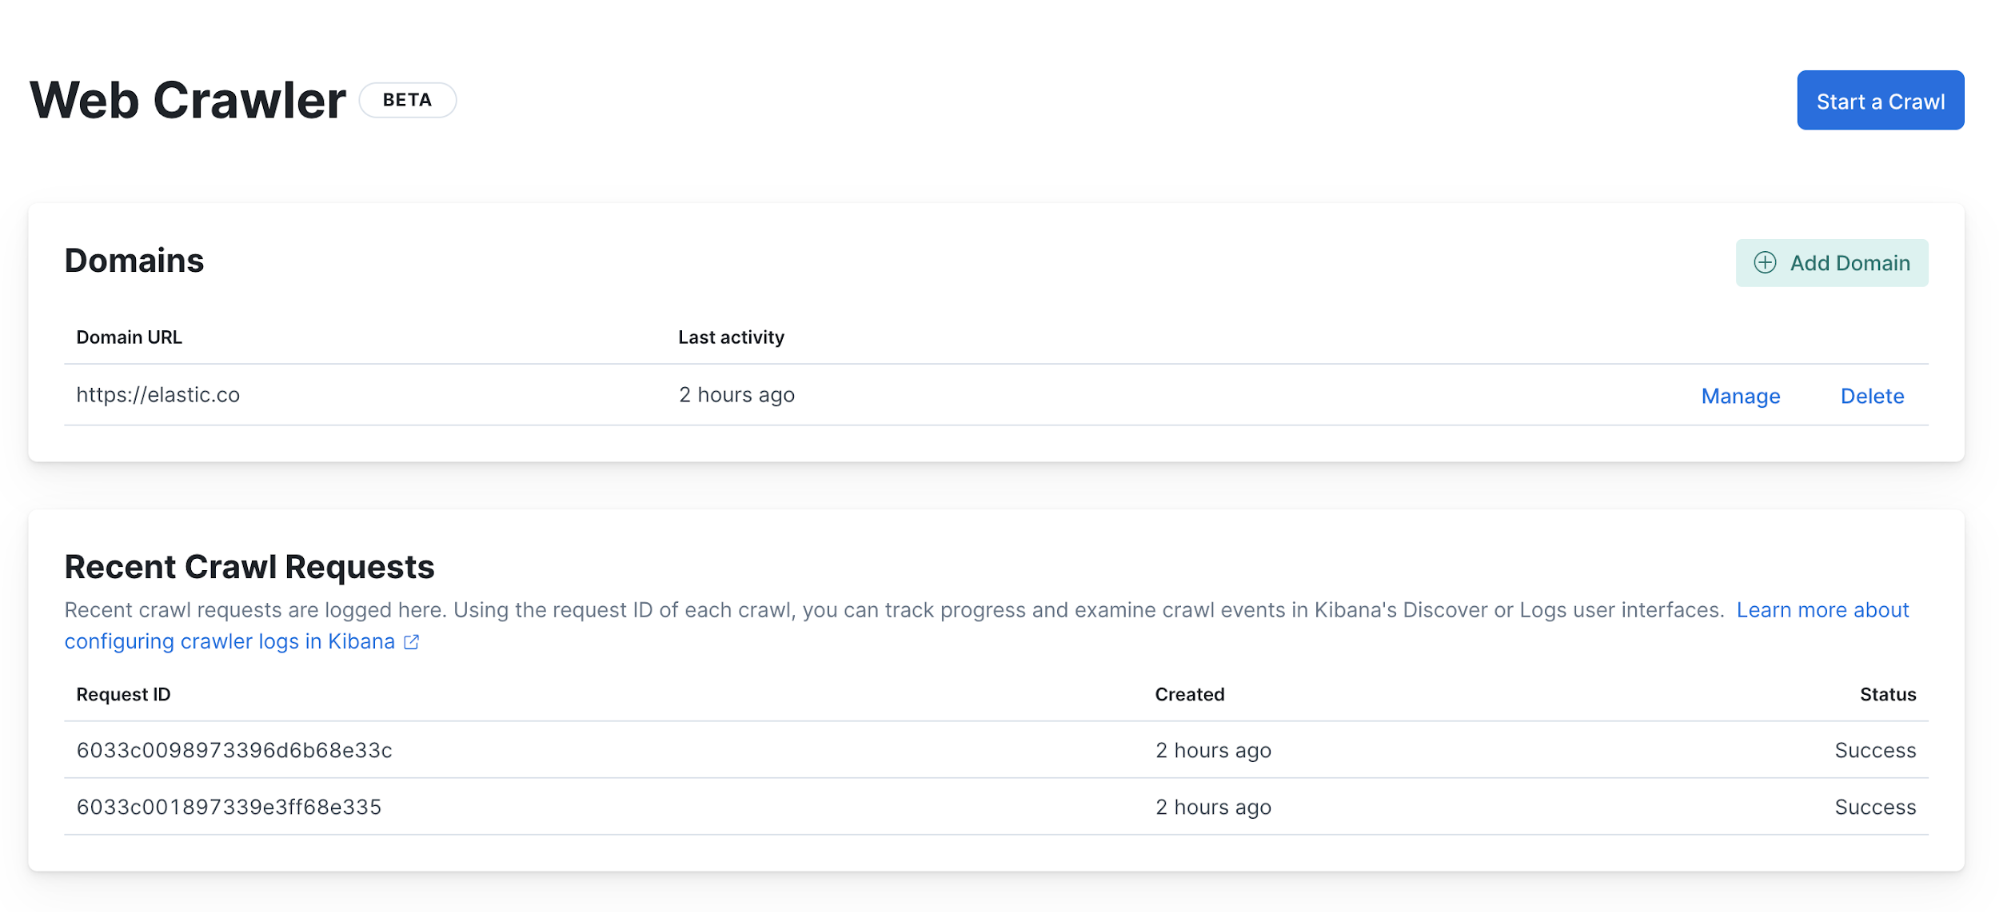
There we can see that two executions have completed and finished with no errors. This tells us that the web crawler executed properly, but it doesn’t explain why we don’t see any documents. We need to investigate further and look at the web crawler events logs.
Access events logs
App Search runs on the Elastic Stack, which is also used for other use cases, such as observability and security. This means that App Search can benefit from features from these solutions, which in our case is very handy. By default, the events logs from the web crawler execution are automatically indexed in the underlying Elasticsearch instance that powers App Search.
The easiest way to access these logs is using Kibana. If you’re using Elastic Cloud, then a Kibana instance is already deployed for you. If you have deployed on-prem, you can download and install Kibana.
Open Kibana and go to the Logs app in the main menu.
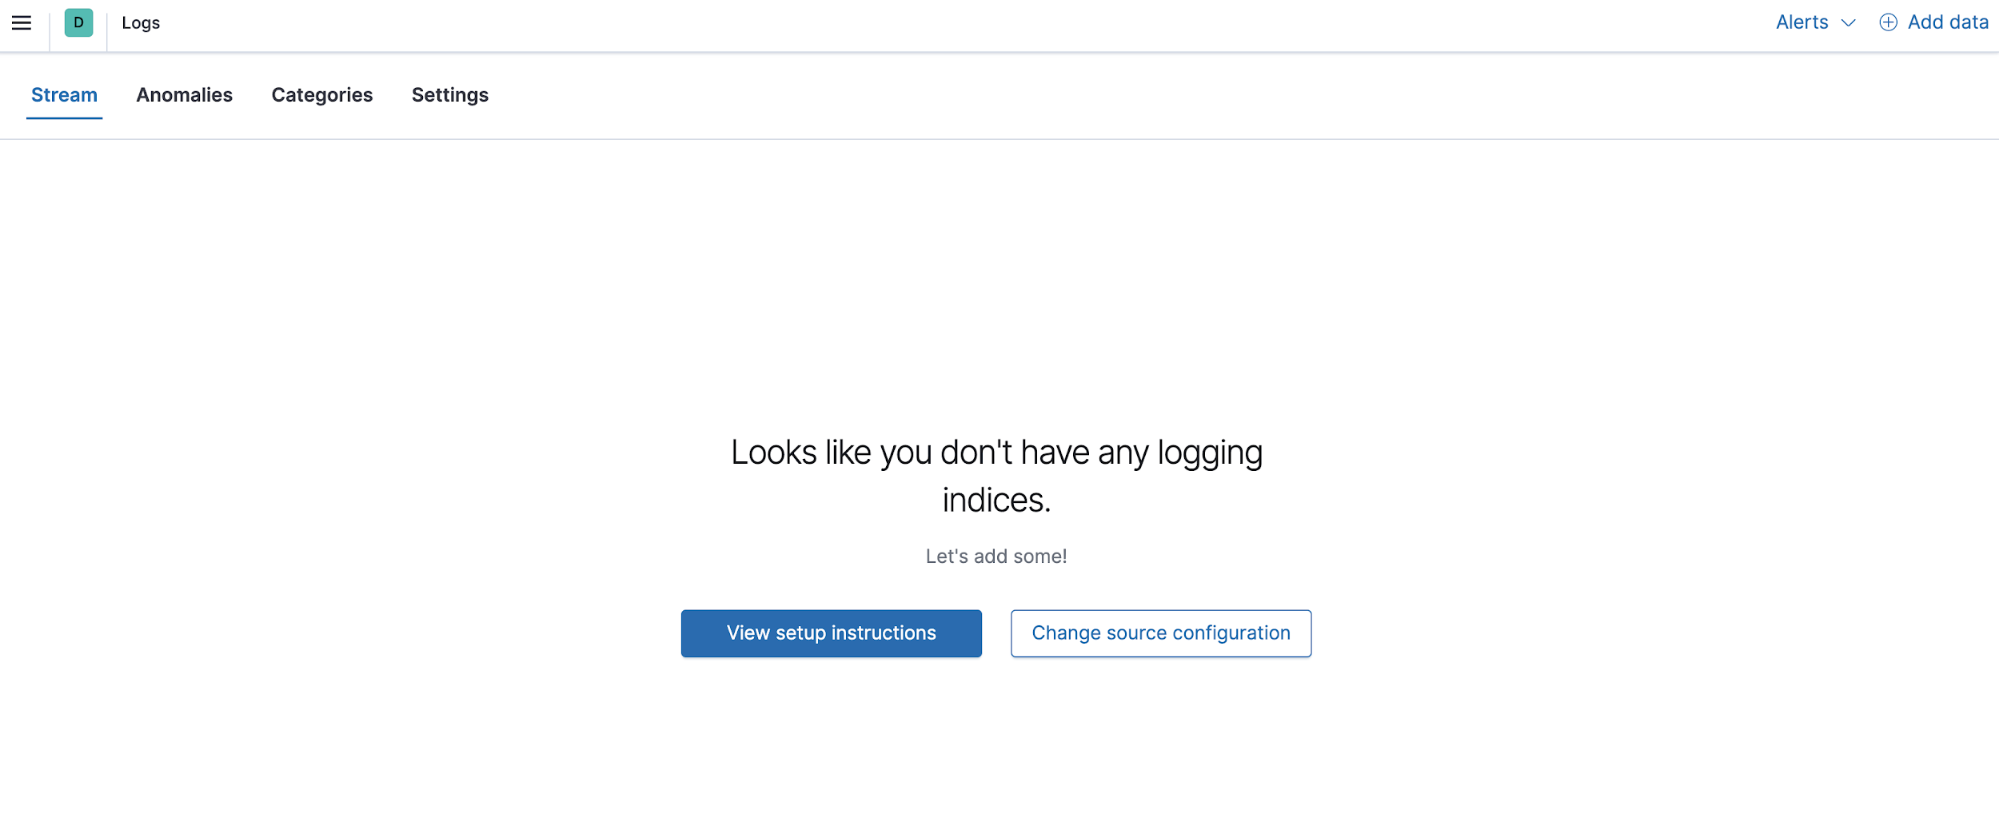
The Logs app can be configured to specify where to find the logs.
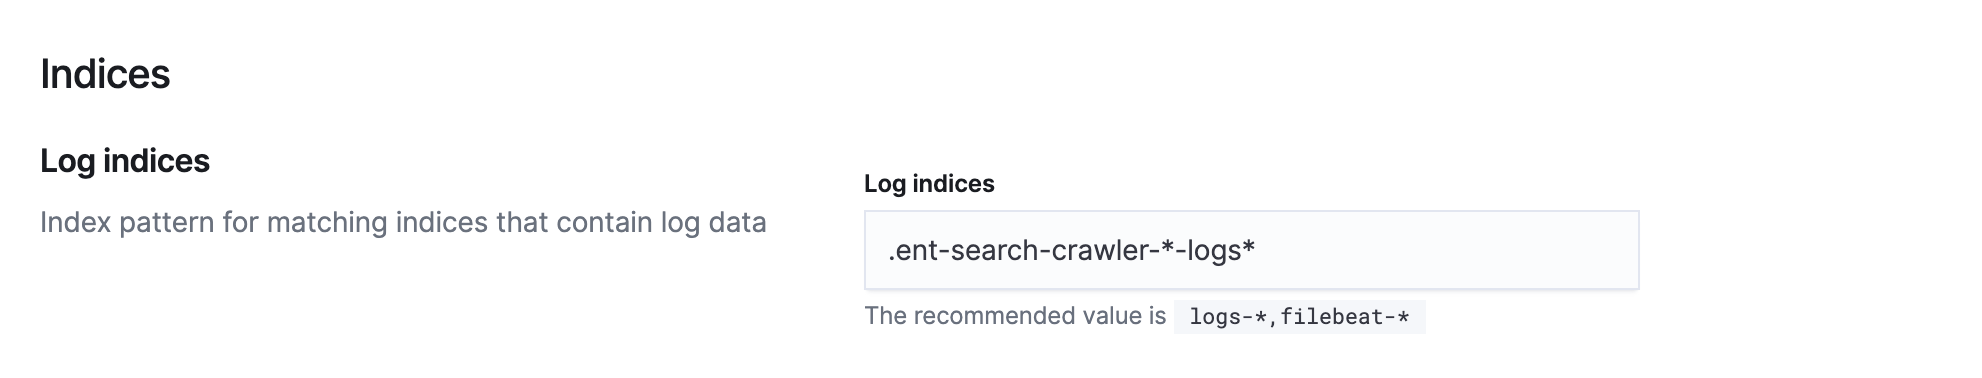
Navigate to Settings to set Log indices to .ent-search-crawler-*-logs*.
We can also specify which fields from the logs we want to display. To investigate our issue, let’s use the following fields:
| Name | Description |
| crawler.crawl.id | Unique ID for the crawl execution |
| url.path | URL path of the page that is being processed |
| url.domain | Domain of the page that is being processed |
| http.response.status_code | Http response code received by the crawler while accessing a page |
| event.action | Event types for URLs, crawl request, and ingestion process |
| crawler.url.deny_reason | Reason for a page not being indexed |
| Message | Provides additional details on certain events |
Other fields are available and can be added easily from the Log Settings UI.
Troubleshoot web crawler errors
Find the error
We can now go back to the Stream view to read the logs, where you’ll see the logs from the last execution.
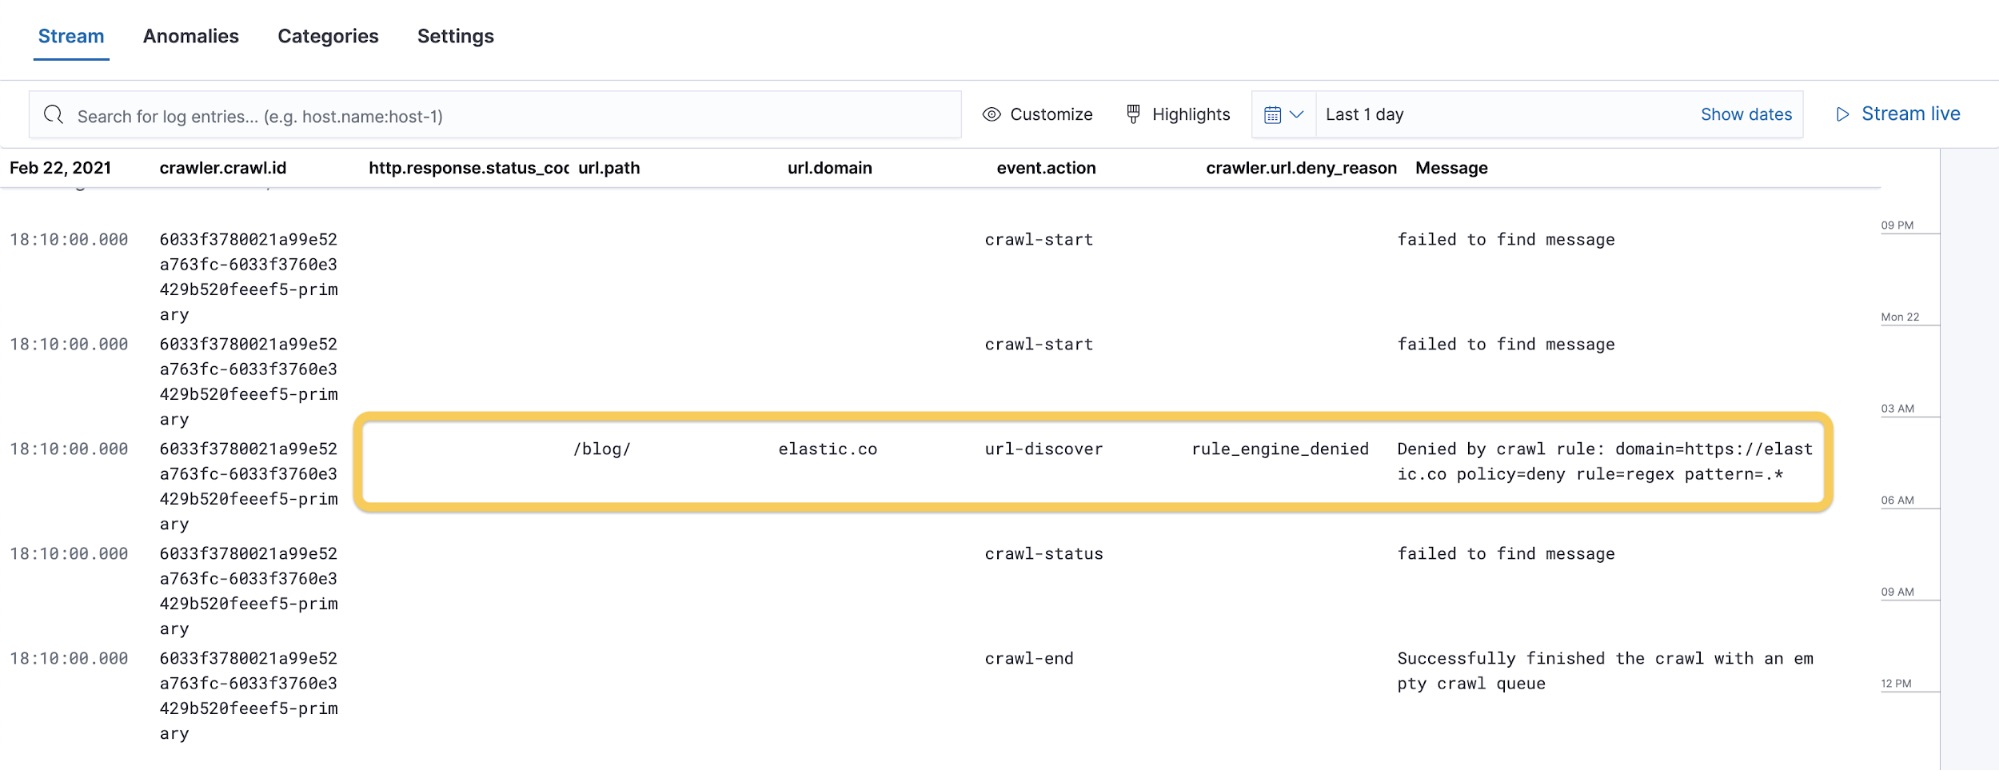
We can quickly notice the main issue with our crawling. Although everything executed, the /blog/ path has been denied, with the message policy=deny rule=regex pattern=.*. This also stops the crawling process because there were no other pages to discover as the first URL was denied.
In our example the deny reason was rule_engine_denied, but the following are some of the most common reasons that will block a page from being processed:
| Deny reason | Description |
| already_seen | Skipping because we have seen this URL before |
| domain_filter_denied | Not in list of allowed domains configured for the crawl request |
| rule_engine_denied | Denied by a configured crawl rule |
| nofollow | Link contains a rel=nofollow attribute or a nofollow robots meta tag is found on the page
|
| too_many_unique_links | Reached the limit on number of unique URLs |
| link_too_deep | Reached crawl depth limit |
| link_too_long | Exceeded URL length limit |
| link_with_too_many_params | Exceeded number of parameters in URL |
Fix the configuration
We can now go back to the configured web crawler rules and check them.
Notice that the rule that blocks everything (Disallow | Regex | .*) is before the rule that allows the pages from the /blog path (Allow | Begins with | /blog/). We can simply change the order of the rules and launch the web crawler again.
Run the web crawler
If you navigate back to the Logs app, you can stream the logs as the crawler is going through the website and indexing documents.
Also, the Logs app benefits from the search capabilities of Elasticsearch, which makes it easy to search through the events logs generated by the web crawler execution.
A typical investigation workflow would be searching all the events logs for a specific crawl id (that can be captured in the App Search admin UI) and a URL path:

You can also navigate to the Documents view in the App Search admin UI to see new documents being indexed in real time.
Conclusion
In this blog post, we learned how to manage the web crawler to quickly crawl content from a website. We then showed how to monitor the web crawler execution by using the Elastic Stack to view the necessary logs. The final step was to troubleshoot and fix the misconfiguration issue we introduced.
If you haven’t already, remember that you can always start up a free 14-day trial of Elastic App Search on Elastic Cloud to try out the web crawler for yourself. Happy crawling!