How to monitor NGINX web servers with the Elastic Stack
In this article, we'll be looking at how we can monitor NGINX using the various components of the Elastic Stack. We'll use Metricbeat and Filebeat to collect data. This data will be shipped off to and stored within Elasticsearch. Finally, we'll view that data with Kibana.
Metricbeat will collect data related to connections (active, handled, accepted, etc.) and the total number of client requests. Filebeat will gather data related to access and error logs. Mileage will vary between different setups, but for the most part we can use this information to deduce certain things, for example:
- A spike in error logs for a certain resource may mean we have deleted a resource that is still needed.
- Access logs can show when a services peak times are (and therefore when it might be best to perform things like maintenance).
- A sudden spike in client requests may point to something malicious (like a DDoS attack).
The core focus of this article is the monitoring functionality, so things like Elasticsearch setup will be brief. I'm using a Mac and will therefore be using the Mac distributions of Elasticsearch, Metricbeat, Filebeat, and Kibana. Distributions for other platforms can be acquired from the downloads page.
Installing Elasticsearch
Metricbeat and Filebeat (in fact, all Beats) need an Elasticsearch cluster to store data. We'll set up a simple Elasticsearch cluster locally. Since we're not exposing Elasticsearch externally, we won't spend time configuring security.
Step 1: Download Elasticsearch
curl -L -O https://artifacts.elastic.co/downloads/elasticsearch/elasticsearch-7.1.0-darwin-x86_64.tar.gz
Step 2: Extract the archive
tar -xvf elasticsearch-7.1.0-darwin-x86_64.tar.gz
Step 3: Change to the bin directory
cd elasticsearch-7.1.0/bin
Step 4: Start our single node cluster
./elasticsearch
By default, your cluster will be running at localhost:9200.
Running NGINX
There are many ways we can run NGINX — standalone on the host, via a Docker container, within a Kubernetes setup, etc. Beats has an Autodiscover feature that can listen to container API events to track our server containers as they spin up or are removed.
Given the variety of ways NGINX can be set up and configured, this article doesn't make too many assumptions and will show host configuration as well as Autodiscover (Docker, in this case) examples.
Configuring Metricbeat and Filebeat
Now we'll configure Beats to start collecting and shipping our data.
Metricbeat
We'll use Metricbeat to collect metrics.
Step 1: Download Metricbeat:
curl -L -O https://artifacts.elastic.co/downloads/beats/metricbeat/metricbeat-7.1.0-darwin-x86_64.tar.gz
Step 2: Extract the archive
tar -xvf metricbeat-7.1.0-darwin-x86_64.tar.gz
Step 3: Change directories
cd metricbeat-7.1.0-darwin-x86_64
Configuration time!
By default our configuration file (metricbeat.yml) will be looking for an Elasticsearch cluster running at localhost:9200, which is what we configured earlier.
Step 4: Enable relevant Metricbeat modules
By default only system level metrics are collected:
./metricbeat modules enable nginx
Step 5: Change file ownerships
We need to change a couple of file ownerships, as we'll be running Metricbeat as root (alternatively, you may choose to use the --strict.perms=false option from the command line to disable strict permission checks):
sudo chown root metricbeat.yml
sudo chown root modules.d/system.yml
sudo chown root modules.d/nginx.yml
Step 6: Enable metricsets
If we open our modules.d/nginx.yml file we can enable the stubstatus metricset, which involves uncommenting the following:
#metricsets:
#  - stubstatus
This metricset collects data from the NGINX ngx_http_stub_status module, it is important that this NGINX module is configured for the metricset to work.
You may also change the hosts being monitored here, by default <a href="http://127.0.0.1">http://127.0.0.1</a> is monitored. For host based setups this is all we need.
Step 7: Autodiscover setups (alternative)
With Autodiscover setups, the equivalent configuration will vary between the three providers, Docker, Kubernetes, and Jolokia. A Docker example would look like the following, where we add a metricbeat.autodiscover to the bottom of the metricbeat.yml configuration file.
metricbeat.autodiscover:
  providers:
    - type: docker
      templates:
        - condition:
            contains:
              docker.container.image: nginx
          config:
            - module: nginx
              metricsets: ["stubstatus"]
              hosts: "${data.host}:${data.port}"
With this configuration all Docker containers using an image with NGINX in the name (contains will perform a substring match, rather than an exact match) will be matched, and will use a config enabling the NGINX module with the stubstatus metricset.
Step 8: Run Metricbeat
Great, now we're configured, we can run Metricbeat with a flag that sends the logs to stderr and disables syslog/file output:
sudo ./metricbeat -e
If everything has worked, you should see some initial output, and then further output each time Metricbeat posts data back to your cluster.
Filebeat
We'll use Filebeat to collect logs.
Step 1: Download Filebeat
curl -L -O https://artifacts.elastic.co/downloads/beats/filebeat/filebeat-7.1.0-darwin-x86_64.tar.gz
Step 2: Extract the archive
tar -xvf filebeat-7.1.0-darwin-x86_64.tar.gz
Step 3: Change directories
cd filebeat-7.1.0-darwin-x86_64
Step 4: Enable the NGINX module
./filebeat modules enable nginx
By default, access and error logs will be collected. As for log file paths Filebeat will try to determine these based on your OS, if you need to set different paths explicitly you can set these in the modules.d/nginx.yml configuration file.
Step 5: Change file ownerships
sudo chown root filebeat.yml
sudo chown root modules.d/nginx.yml
sudo chown root module/nginx/access/manifest.yml
sudo chown root module/nginx/error/manifest.yml
For a host-based setup this is all we need.
Step 6: Autodiscover setup (alternative)
As before, additional configuration is needed to use Autodiscover. Similar to the previous section, the Docker example would need an autodiscover section added to the config, and the filebeat.yml would look like the following:
filebeat.autodiscover:
 providers:
   - type: docker
     templates:
       - condition:
         contains:
           docker.container.image: nginx
         config:
           - module: nginx
             access:
               input:
                 type: docker
                 containers.ids:
                   - "${data.docker.container.id}"
             error:
               input:
                 type: docker
                 containers.ids:
                   - "${data.docker.container.id}"
Here we configure the access and error options to use a Docker input. A Docker input will search for container logs under its path (the base path where Docker logs are located, by default this is /var/lib/docker/containers). We specify containers.ids using the id(s) of the containers that matched our template condition. Put together, the logs (by default) will be sourced from /var/lib/docker/containers/ac29b98ad83ca43bb4c15ae8f0d03aff8c7d57bf5dee9024124374b92b14b0f2/ (ids will differ).
Step 7: Run Filebeat
sudo ./filebeat -e
Installing Kibana
Now that we have Metricbeat and Filebeat shipping off data about our NGINX server(s) we need a way to view this data, which is where Kibana comes in.
Step 1: Download Kibana
curl -O https://artifacts.elastic.co/downloads/kibana/kibana-7.1.0-darwin-x86_64.tar.gz
Step 2: Extract the archive and change directory
tar -xzf kibana-7.1.0-darwin-x86_64.tar.gz
cd kibana-7.1.0-darwin-x86_64
Step 3: Run Kibana
./bin/kibana
By default Kibana will use an Elasticsearch host of http://localhost:9200, and will be accessible at http://localhost:5601.
If you navigate to http://localhost:5601 you should be greeted by the following:
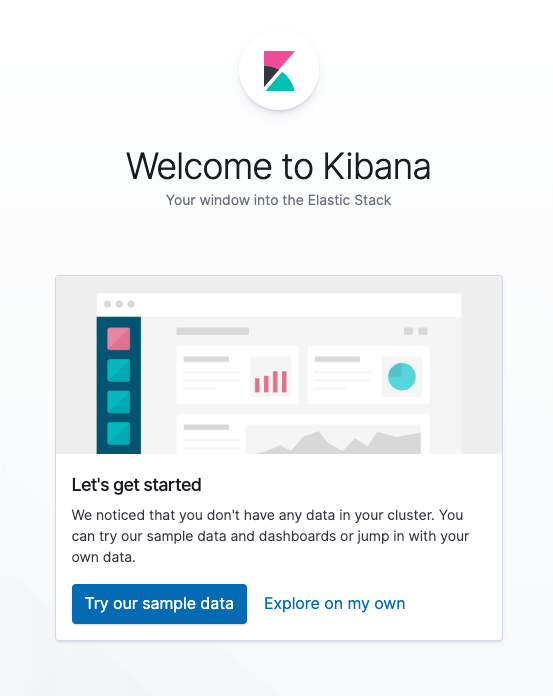
You can optionally try out the sample data, but we'll just click Explore on my own.
Visualizing NGINX data in Kibana
Next we'll take a look at how we can use Kibana to view and analyze our data.
Infrastructure
If we navigate to the Infrastructure app on the Kibana sidebar we'll be able to see a snapshot (last minute) view of our infrastructure. Depending on the configuration that was used, data will be accessible under Hosts for non-Autodiscover based setups, for Autodiscover setups the Docker and Kubernetes buttons (based on the provider that was used) will lead you to the correct dataset:
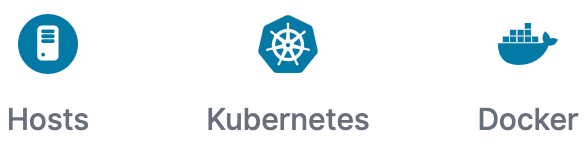
As I was using a Hosts based setup, I can click the Hosts button and see the following data being shipped from Metricbeat:
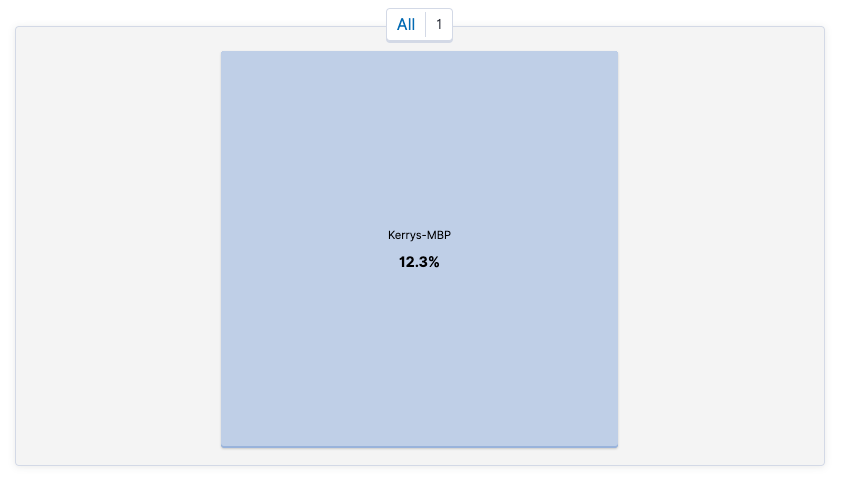
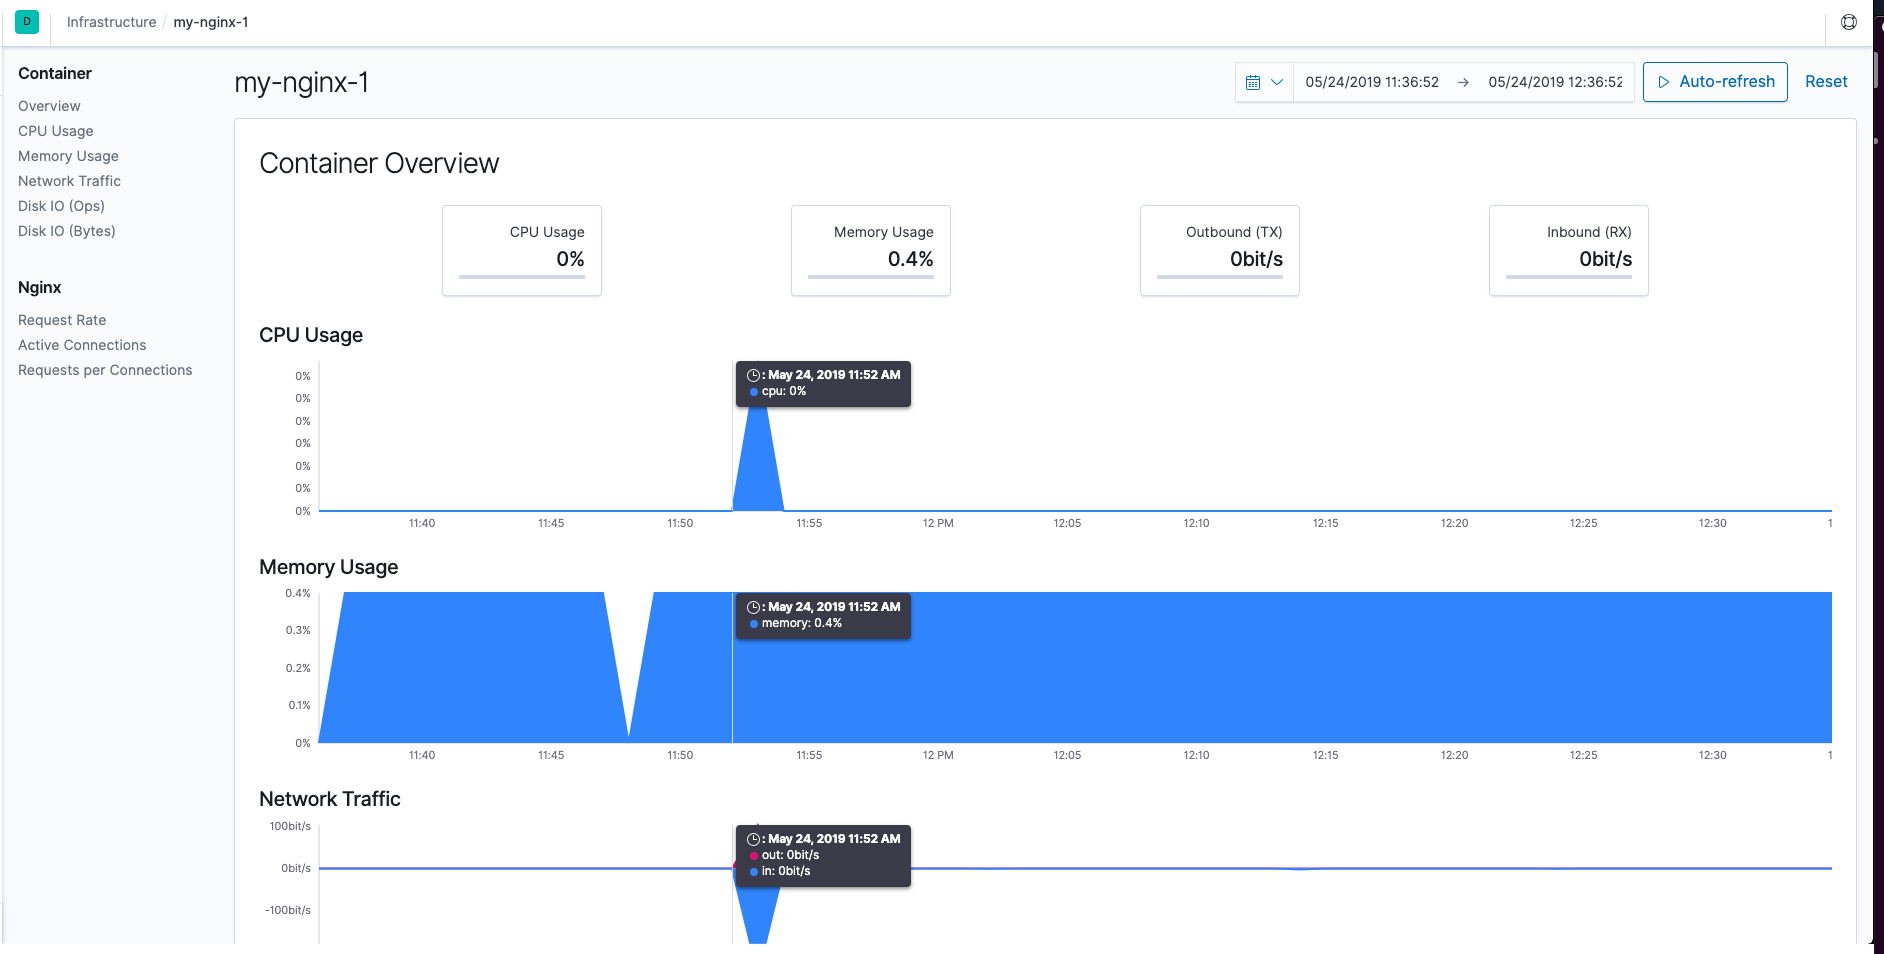
If we select one of the nodes and choose to View Metrics we can see a page with detailed metrics for that single NGINX server.
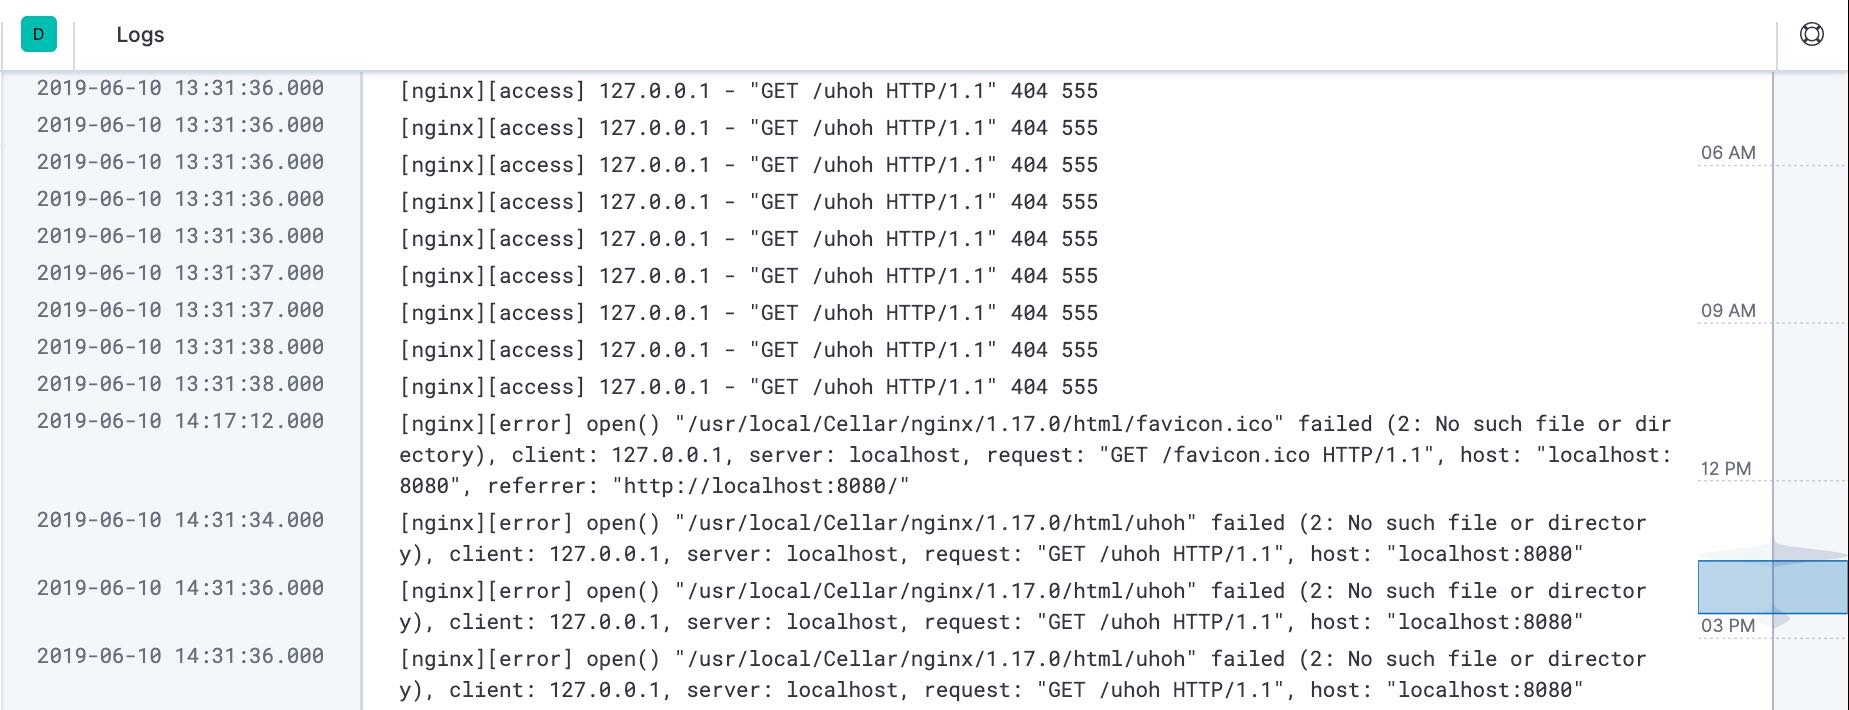
Logs
If we navigate to the Logs app instead we'll be able to see our access and error logs that have been shipped from Filebeat.
Pre-configured NGINX dashboards
Now that we have a running and accessible instance of Kibana we can load some premade dashboards.
To load the Metricbeat dashboards run the following in your Metricbeat directory:
sudo ./metricbeat setup --dashboards
And to do the same for Filebeat:
sudo ./filebeat setup --dashboards
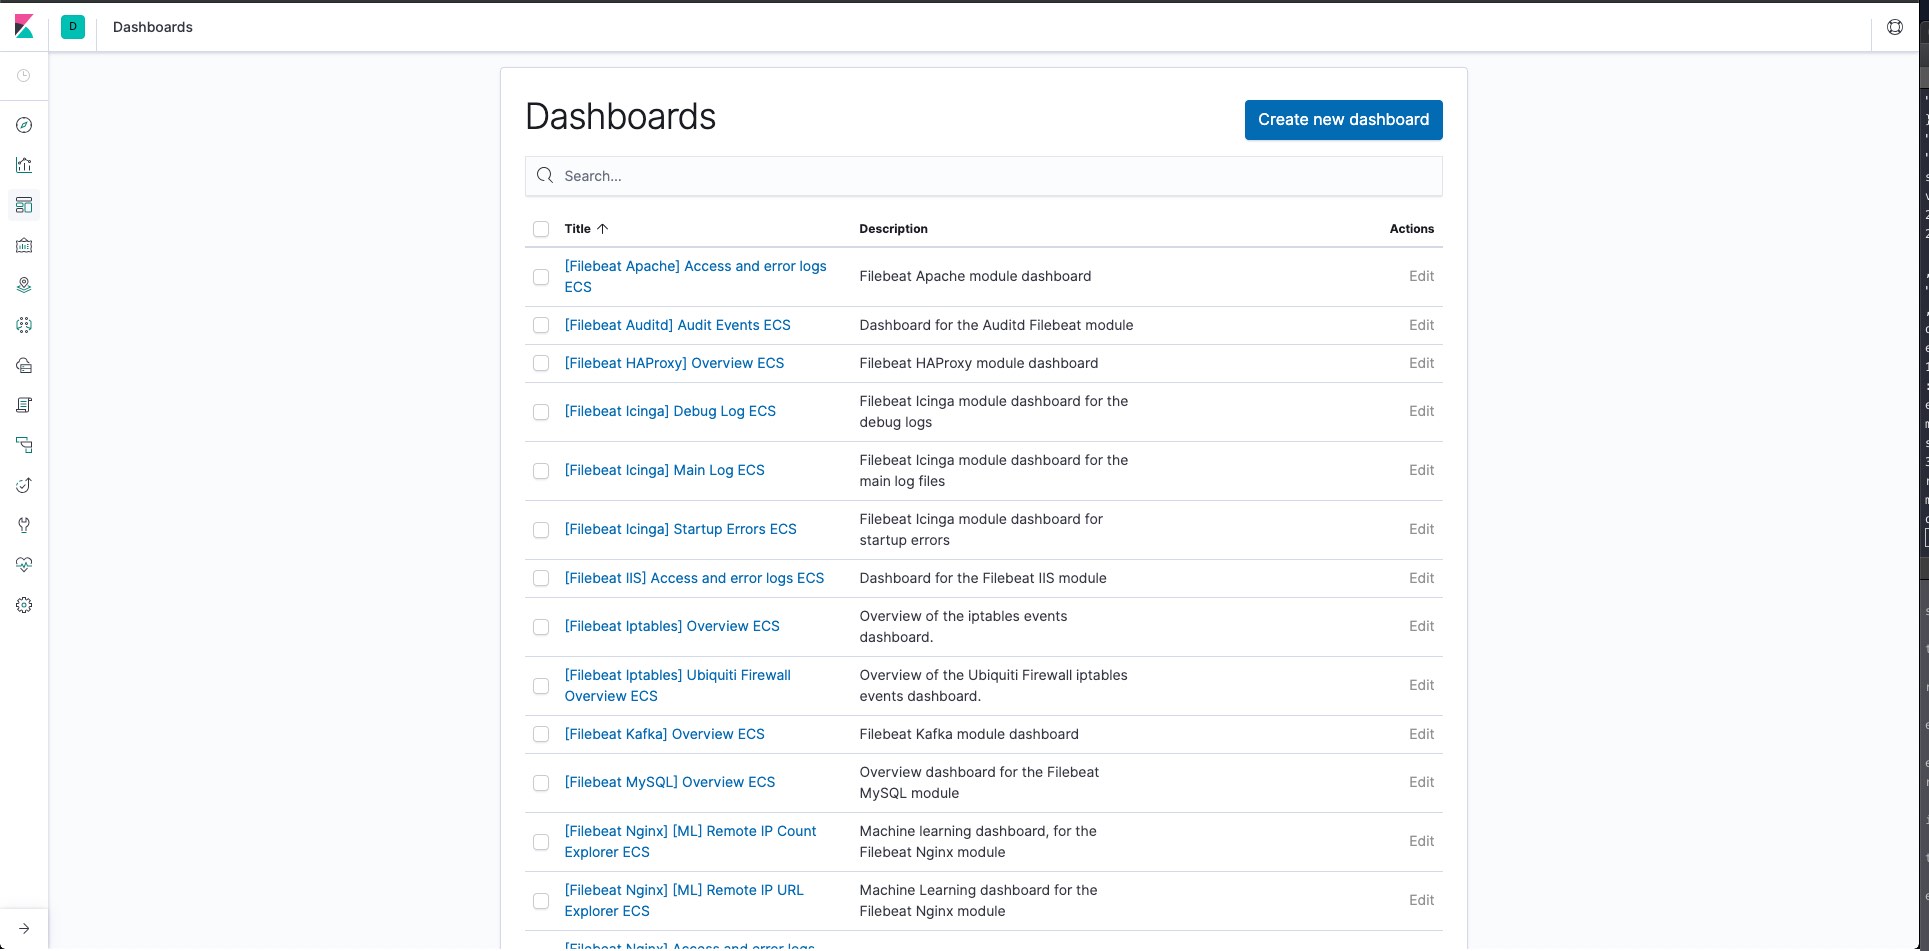
Now if we navigate to the Dashboards tab within Kibana we should see the following:
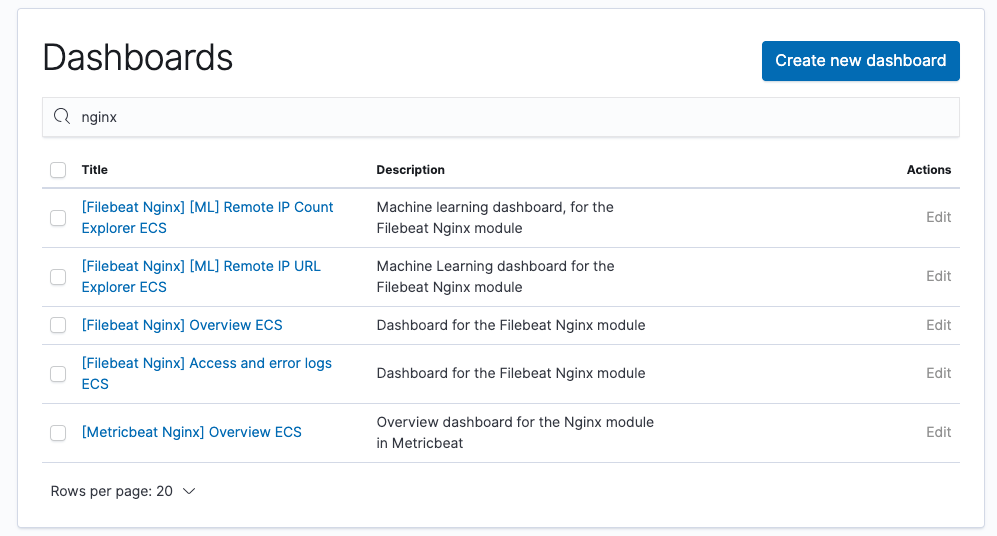
If we narrow this down to an "nginx" search, we have these dashboards available:
The [Filebeat NGINX] Access and error logs ECS dashboard, as an example, looks like the following:
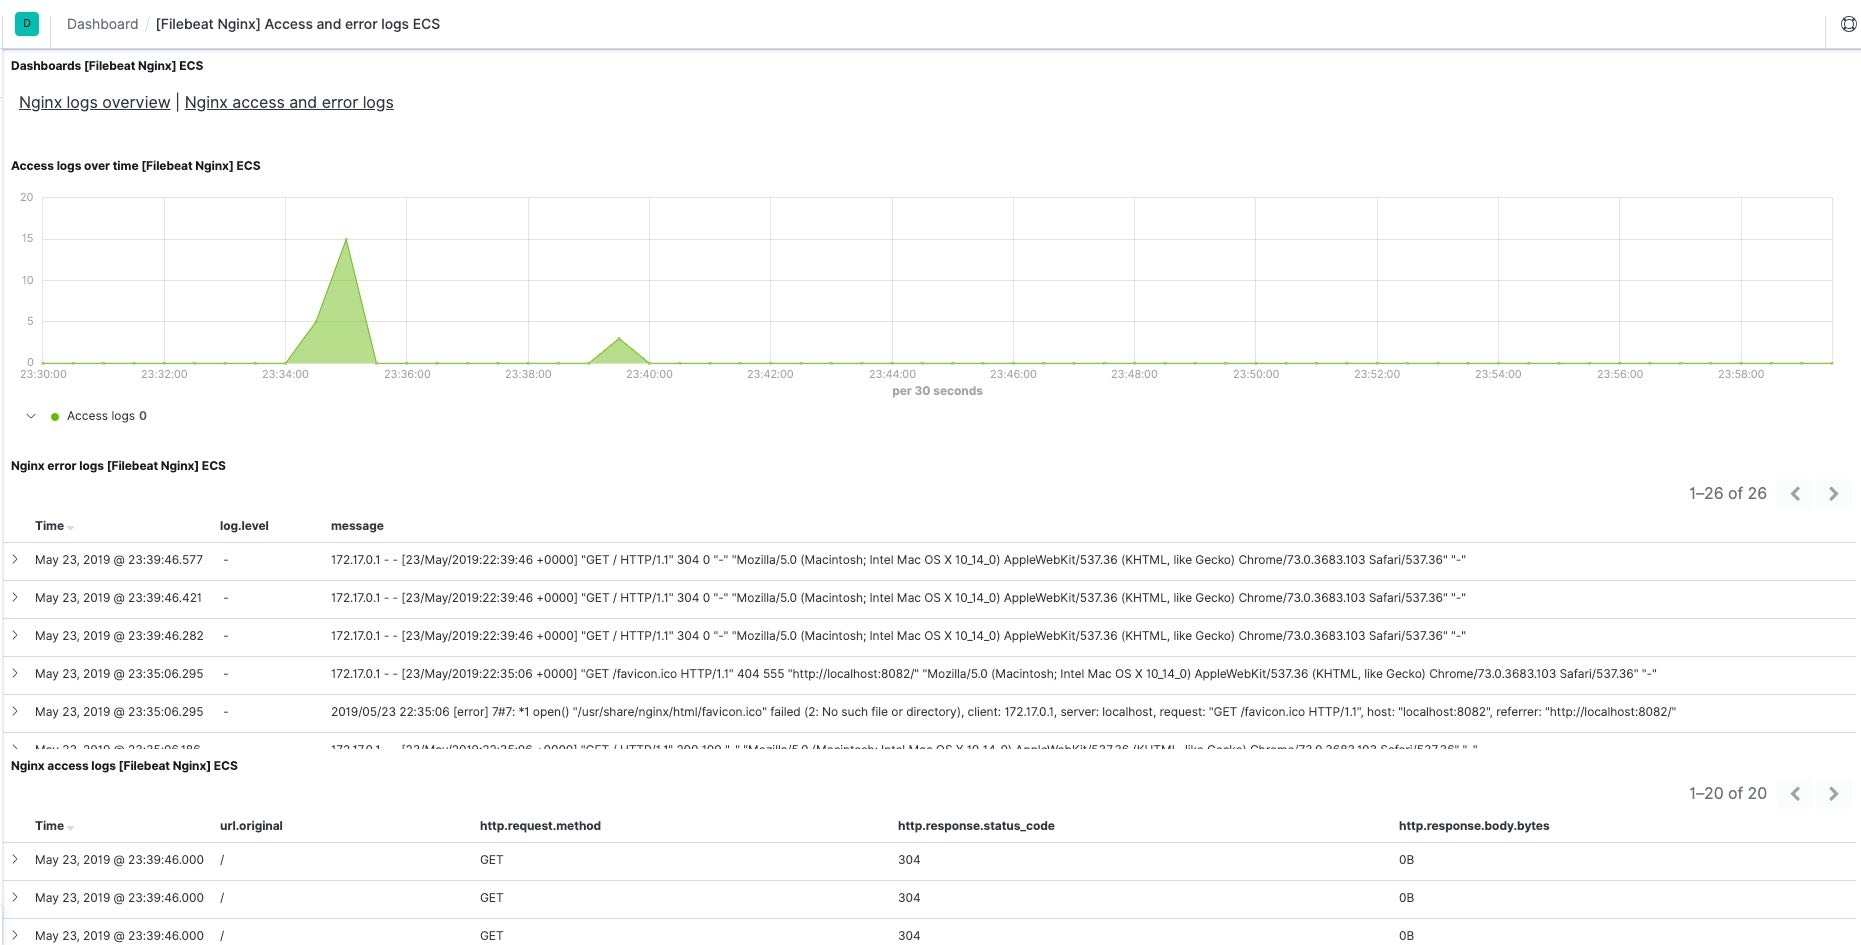
And with that we've learned how to use the Elastic Stack to monitor NGINX servers. From here there are various options to play with (different grouping and filtering options for example) to drill down to the information that really matters to you.