How to consume audit logs from Elastic Cloud

 Share on Twitter
Share on Twitter

 Share on LinkedIn
Share on LinkedIn

 Share on Facebook
Share on Facebook

 Share by Email
Share by Email

 Print this page
Print
In many organizations, the Elastic Stack is run on the Elastic Cloud Enterprise (ECE) platform. This platform enables teams to create, manage, and update Elastic Stack without any prior knowledge.
Since this is a powerful tool, organizations want to be informed about changes in the platform. Many users might access this web user interface (UI) and create deployments, upgrade them, and add or remove specific settings — without [what is the title/persona who owns the overall view] knowing. All the data is inside the built-in logging and metrics clusters; thus, we can leverage it and use Kibana rules and alerting to create alerts for specific events.
Below, I’ll cover how to use the audit functionality of ECE to be alerted when a critical event happens, as well as review topics and questions that often come up in the audit process.
- Audit functionality
- Alerts for critical events
- The audit process
- Review topics and questions
[Related article: 4 ways the Elastic Platform in the cloud multiplies the benefits of search-powered data analytics solutions]
An API-first approach
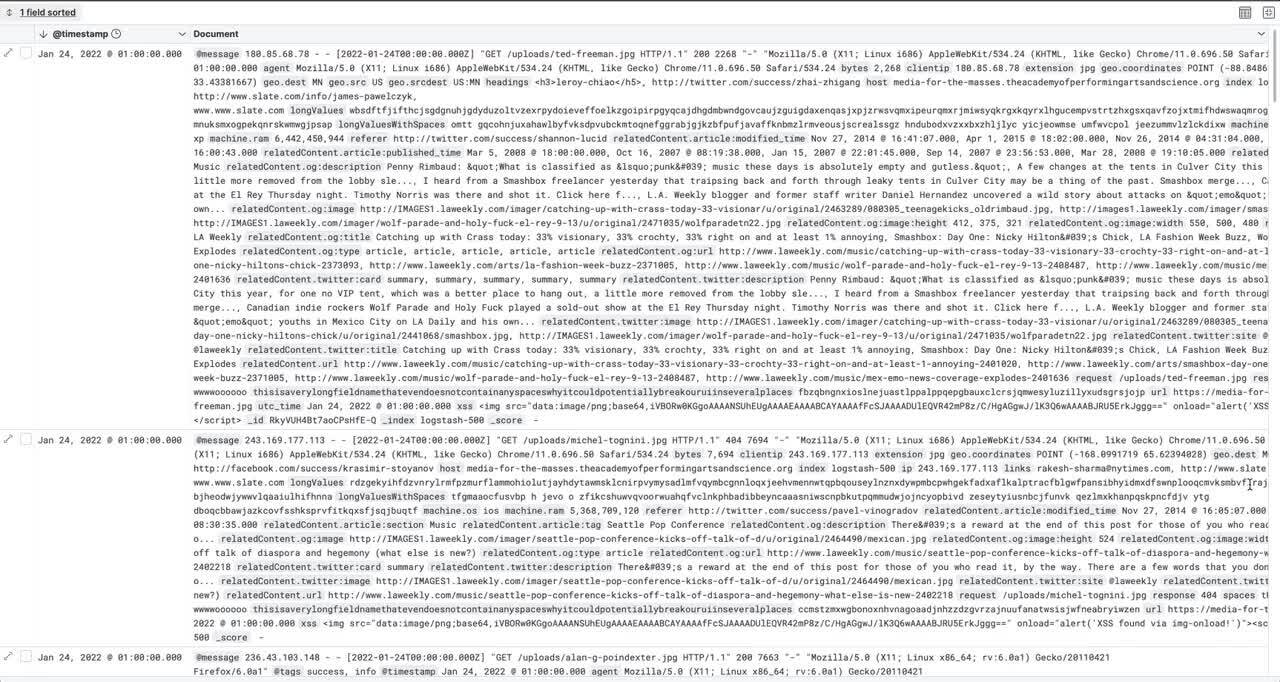
Luckily ECE is built upon an API-first approach. Thus every click we do in a UI is backed by an API (application programming interface). Those API calls go against a proxy, and this proxy logs every request in the internal logging and metrics cluster and stores them inside the Kibana data view called services-logs.
Generally speaking, our API is always designed to be prefixed by /api/v1.
Who logged in and when?
Any login goes against the /auth/_login URL using a POST request. A sample document looks like this:
{
   "request_id": "8f01392d1ab029f5340eeac60c965e88",
   "method": "POST",
   "path": "https://34.140.124.31:12443/api/v1/users/auth/_login",
   "headers": [...],
   "payload": {
       "username": "philipp",
       "password": "-"
   },
   "return_code": 200
}It contains the URL in the path field inside the payload, and we know the username. Don’t worry — the password is permanently excluded. At the bottom of the message, we have a return_code. If this is 200, we can be sure the login worked. If the return_code is missing, the API did not answer, which means a login was tried but was unsuccessful.
Based on the document above, we can create a simple alerting rule to get notified if someone tries to login with philipp and fails at least three times within a certain time.
A deployment was added, altered, and deleted
This section covers everything that is happening to a deployment. Any change — like adding nodes, upgrading to a newer version, or removing nodes — will trigger a plan change, which also goes through an API. The general API for all deployment-related tasks is the following /deployments.
A cluster creation is defined by running a POST against /deployments with a payload that describes a cluster. We won’t go into the payload details, and examples can be found in our documentation. The exciting part is the admin_id and the return_code. This clearly states that philipp created a new deployment. The deployment name is in the payload.name, demo. The return_code is 201 (created) consequently, the API call is successful, and the deployment is created.
Next step: Dashboard
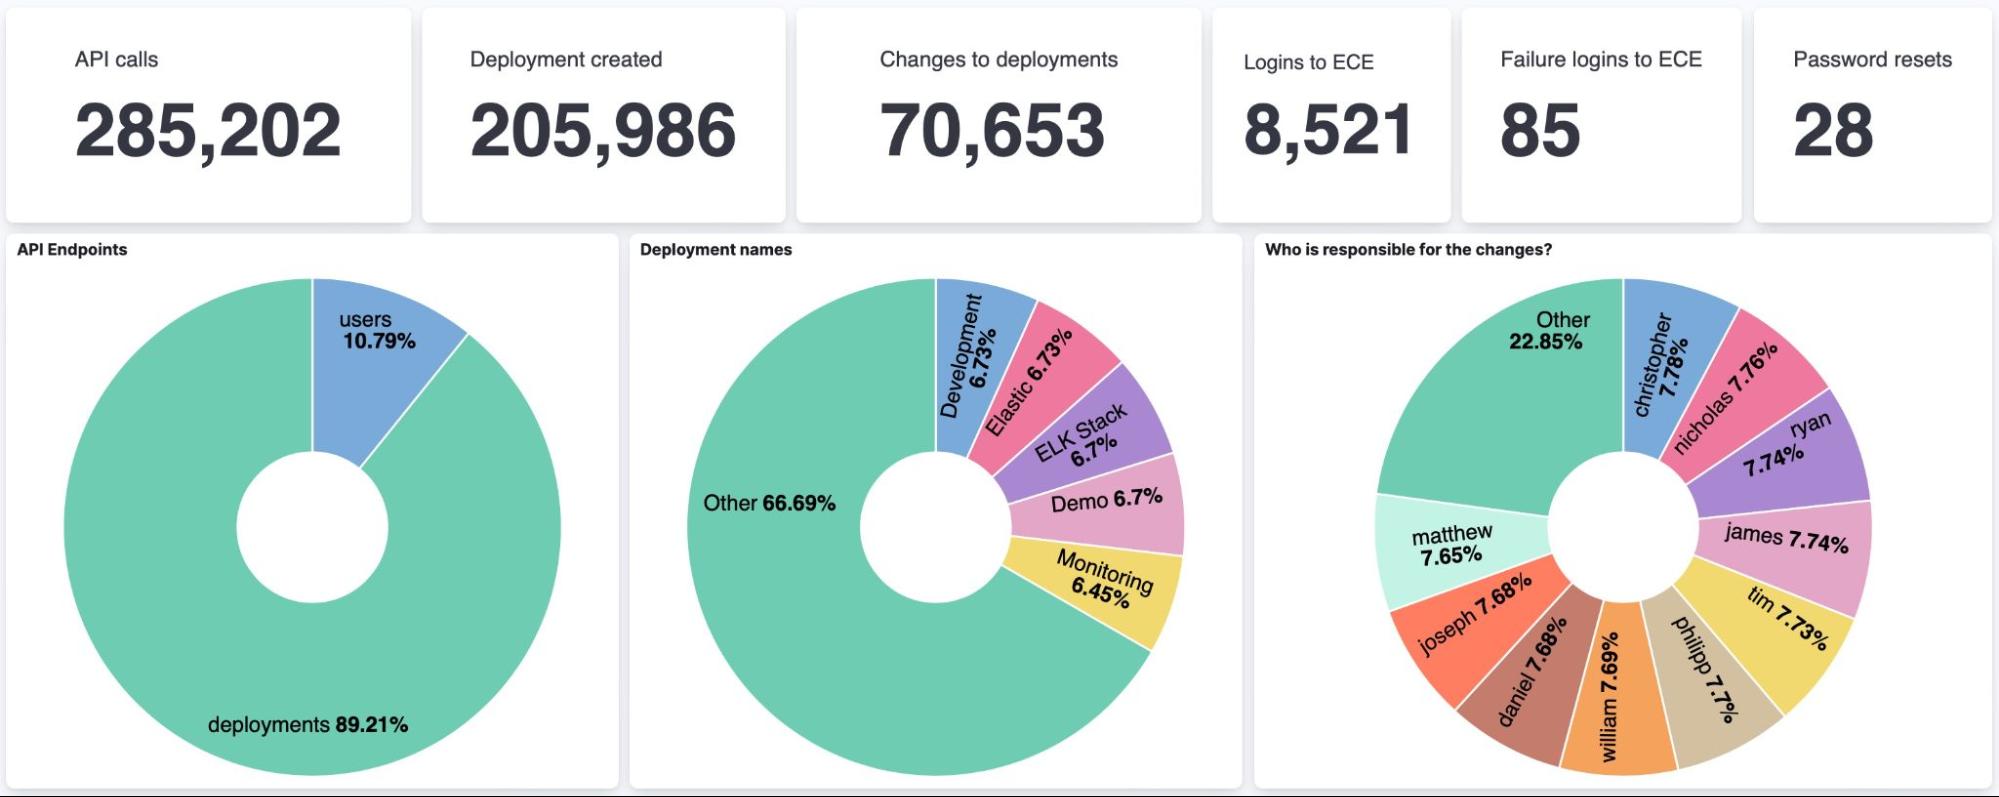
In this blog, we showed how easily one could use the audit functionality of ECE to be alerted when a critical event happens. When combining all those events, we can build a dashboard to watch what is happening in our ECE.
To learn more about building such a dashboard, read New in Kibana: How we made it easier to manage visualizations and build dashboards.
Share
- Share on Twitter
Share on Twitter
- Share on LinkedIn
Share on LinkedIn
- Share on Facebook
Share on Facebook
- Share by Email
Share by Email
- Print this page
Print