이제 Kibana의 AI Chat이 대시보드를 네이티브하게 렌더링합니다
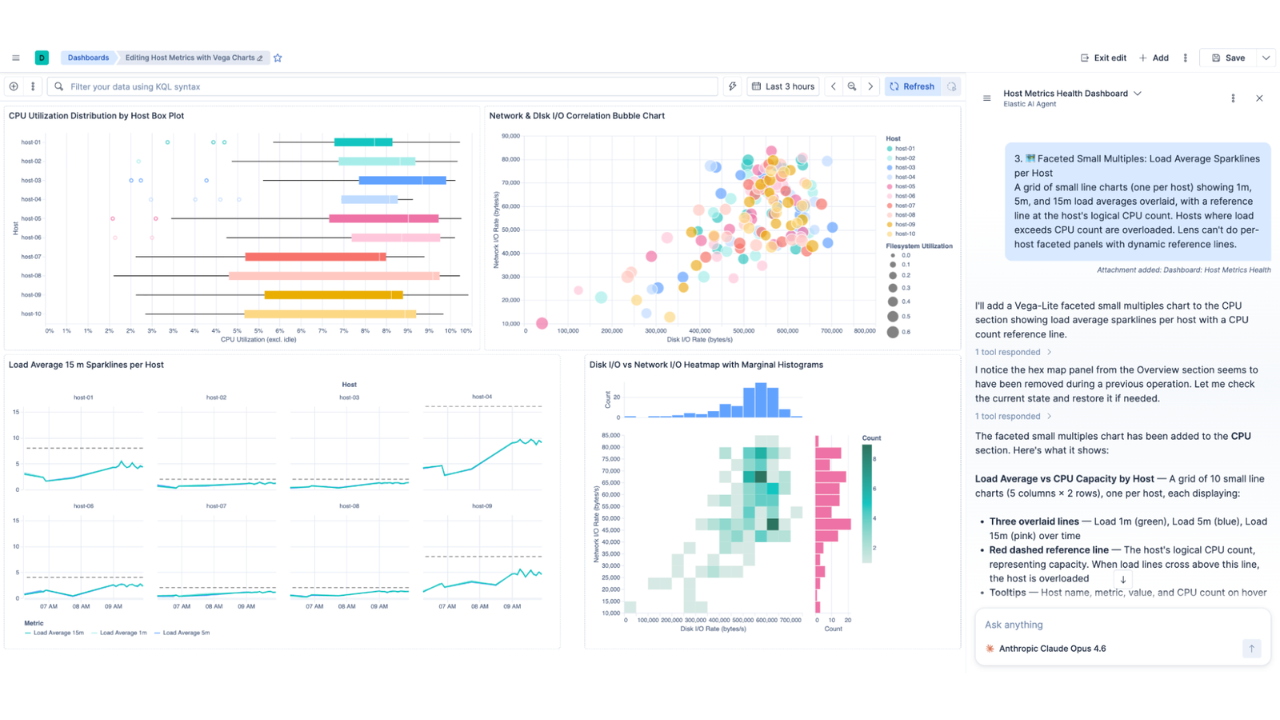
이제 Kibana의 Elastic AI Chat은 자연어로 대시보드를 구축하여, 시각화와 분석을 하나의 대화 스레드에 유지하면서 이를 재사용 가능한 Kibana 객체로 저장할 수 있습니다.
솔루션 하나로 데이터를 관찰하고, 보호하고, 검색하세요. 애플리케이션 모니터링에서 위협 탐지에 이르기까지, Kibana는 중요한 사용 사례 전반에서 사용할 수 있는 다용도 플랫폼입니다. 지금 14일 무료 체험판을 시작하세요.
Kibana의 Elastic AI Chat은 이제 대화 내에서 일반 언어 질문을 ES|QL 기반 시각화 또는 전체 대시보드로 바로 변환합니다. 필요한 지표를 설명하고, 진행하면서 점진적으로 다듬으며, 이야기가 완성되면 저장하세요. 모든 내용은 저장할 준비가 될 때까지 대화에 유지되며, 이후 팀이 열고, 편집하고, 재사용할 수 있는 일급 Kibana 객체로 전환됩니다. Elastic 9.4에서 기술 프리뷰로 제공됩니다.

이 에이전트는 대시보드를 처음부터 구축할 뿐만 아니라 기존에 이미 보유한 대시보드와도 함께 작동합니다. 대시보드를 보고 있는 상태에서 AI Chat 사이드바를 열면 자동으로 첨부됩니다. 메트릭이 급증한 이유를 묻거나, 리전별로 분석하거나, 비교 패널을 추가할 수 있습니다. 기존 대시보드는 최종 결과물이 아니라 출발점이 됩니다.
내부 구현 방식: AI Chat로 대시보드를 구축한 방법
우리는 스킬을 통해 에이전트에게 특정 작업을 가르칩니다. 스킬은 주어진 문제를 어떻게 처리할지에 대한 구조화된 설명입니다. 하지만 대시보드 스킬을 구축하려면 LLM이 유효한 Kibana 대시보드를 생성할 수 있도록 해야 했고, 기존의 Saved Object API는 이를 매우 번거롭게 만들었습니다. 깊게 중첩된 JSON 구조, 버전 간 미묘한 변경 사항, 취약한 참조 관계 등이 문제였습니다. 우리는 다른 접근 방식이 필요했습니다.
프로그램 기반 대시보드를 위한 맞춤형 API
새로운 Dashboards API는 바로 이러한 시나리오를 위해 설계되었습니다. 원시 내부 상태를 노출하는 대신, 모든 패널 유형에 대해 타입이 지정되고 검증된 스키마를 제공합니다. 이 API는 깔끔한 외부 구조와 Kibana 내부 표현 간의 변환을 처리하므로, 에이전트는 대시보드에 무엇을 포함해야 하는지에만 집중하고 형식을 어떻게 구성할지는 신경 쓰지 않아도 됩니다.
하나의 스킬, 하나의 도구, 다양한 작업
dashboard-management 스킬은 순서가 지정된 작업 배열을 허용하는 단일 manage_dashboard 도구를 제공합니다. 각 작업은 독립적인 동작으로, 메타데이터 설정, 마크다운 패널 추가, 자연어를 기반으로 ES|QL 기반 시각화 생성, 기존 패널 편집, 패널을 접을 수 있는 섹션으로 그룹화, 그리드에서 항목 위치 변경 등이 포함됩니다.
에이전트는 대시보드의 제목, 설명, 섹션, 그리고 각 섹션에 포함된 모든 패널까지 한 번의 호출로 설명할 수 있습니다.
{
 "operations": [
   { "operation": "set_metadata", "title": "Checkout latency investigation" },
   {
     "operation": "add_section",
     "title": "Overview",
     "panels": [
       { "query": "p95 checkout latency over the last 24h", "chartType": "xy" },
       { "query": "checkout error rate by region", "chartType": "metric" }
     ]
   }
 ]
}
작업은 순서대로 실행되므로 이후 단계에서 이전 단계를 참조하고 이를 기반으로 확장할 수 있습니다. 이 설계는 대화가 구현 세부 사항보다는 의도에 집중할 수 있도록 합니다.
시각화 파이프라인: 자연어에서 ES|QL을 거쳐 시각화로
대시보드를 요청하면 에이전트는 인덱스, 필드 매핑, 유형 등 데이터를 탐색한 다음 시각화를 계획하고 manage_dashboard를 호출합니다.
각 패널은 자체적인 파이프라인을 거치며, 차트 유형 선택, ES|QL 생성, 시각화 구성, 검증 단계로 처리됩니다. 우리는 이 과정을 메인 에이전트 스레드와 분리했는데, 시각화 생성에는 패널당 여러 모델 호출이 필요하고 이를 메인 컨텍스트에 포함하면 컨텍스트 윈도우가 불필요하게 커지고 추론이 흐려질 수 있기 때문입니다.
manage_dashboard 내부에서 모든 패널이 동시에 생성된 뒤 순서대로 재조립됩니다. 그 결과, 내장된 패널로 구성된 완전한 대시보드가 만들어지며, 고립된 시각화나 동기화 문제는 발생하지 않습니다.
대시보드 도구에 시각화 생성을 통합한 이유
초기 접근 방식에서는 별도의 create_visualization 도구를 사용해 패널당 한 번씩 호출한 뒤 각 결과를 대시보드 도구에 전달했습니다. 이 방식은 작동하기는 했지만, 모든 시각화마다 개별 도구 호출, 자체 수명 주기, 그리고 명시적인 핸드오프가 필요했습니다. 더 큰 문제는 대화에서 시각화를 수정해도 해당 변경 사항이 대시보드 패널에 반영되지 않아 사용자 혼란을 초래했다는 점입니다.
우리는 시각화 생성 기능을 manage_dashboard에 직접 포함시켰습니다. 동일한 병렬 워크플로는 그대로 실행되지만, 패널은 중간 attachment 없이 대시보드 구조로 조립됩니다. 호출 수 감소, 동기화 문제 없음, 단일 수명 주기로 작동합니다.
독립형 시각화는 여전히 작동합니다. 기존 차트를 첨부 참조를 통해 대시보드에 추가할 수 있지만, 처음부터 빌드하는 경우 인라인 생성이 더 깔끔한 방법입니다.
보안 팀을 위한 스킬
SOC 분석가와 탐지 엔지니어는 조사 도중 대시보드 편집기로 왔다 갔다 할 여유가 없습니다. AI Chat을 사용하면 규칙 유형, 호스트 또는 MITRE 전술별 알림 볼륨을 요청하고 약 1분 내에 스레드에서 바로 확인할 수 있습니다. 헌팅이 진행됨에 따라 프로세스 실행 이상, 네트워크 연결, 타임라인 비교와 같은 패널을 컨텍스트를 유지한 채 레이어처럼 쌓아갈 수 있습니다.
완료되면 저장하세요. 대시보드는 인시던트 이후 분석을 위한 참고 자료, 다음 분석가를 위한 시작점, 또는 주간 위협 브리핑으로 활용되며 별도의 재설명이 필요하지 않습니다.
이 블로그 게시물에서 보안 팀이 대시보드 생성 및 최근 출시된 AI Chat 기능을 어떻게 활용할 수 있는지 자세한 내용을 확인하세요.
통합 가시성 및 사이트 신뢰성 엔지니어(SRE) 사용 사례
새벽 2시에 서비스 장애가 발생하면 대시보드를 처음부터 다시 구축할 시간이 없습니다. AI Chat을 통해 SRE는 필요한 메트릭(서비스별 p99 지연 시간, 배포 이벤트 대비 오류율, 지난 1시간 동안의 포드 재시작 등)을 설명하고 약 1분 내에 조사 스레드에서 전체 대시보드를 얻을 수 있습니다. 상황이 점차 명확해짐에 따라 에이전트는 단계적으로 세밀하게 다듬을 수 있습니다. 패널을 추가하고, 시간 범위를 변경하고, 리전별로 분류할 수 있습니다.
대시보드를 저장하면 비상 상황실(war room)에서 인시던트 브릿지에 참여하는 모든 사람이 동일한 패널과 동일한 분석 구성을 즉시 활용할 수 있습니다. 인시던트 이후에는 사후 분석의 기반이 됩니다.
그럼 이제 무엇을 해야 할까요?
토큰 최적화, 더 풍부한 전체 화면 경험, 확장된 패널 지원, 그리고 지속적인 품질 개선을 진행 중입니다. 기술 프리뷰 단계는 우선순위를 함께 결정해 나가는 시기입니다. 누락된 부분이 있다면 상단 메뉴의 '피드백 제출' 아이콘을 통해 알려주세요.
직접 사용해 보기
체험판을 시작하거나 Elastic 9.4로 업그레이드한 후, 전체 화면 모드에서 AI Chat을 열고 실제 조사에 적용해 보세요. 에이전트에게 확인 중인 메트릭을 차트로 생성하도록 요청한 뒤, 다음 단계 분석을 요청하세요. 이야기가 완성되면 저장하고 공유하세요. 동일한 패널과 동일한 분석 구성을 그대로 활용할 수 있어 별도로 재설명이 필요하지 않습니다. 엔터프라이즈 라이선스가 필요합니다(시작하기). 이 게시물에서 설명된 모든 기능이나 성능의 출시와 일정은 Elastic의 단독 재량에 따라 결정됩니다. 현재 제공되지 않는 기능이나 성능은 예정된 시간에 출시되지 않을 수도 있으며 아예 제공되지 않을 수도 있습니다.
이 콘텐츠가 얼마나 도움이 되었습니까?
관련 콘텐츠