AI Chat in Kibana rendert jetzt nativ Dashboards
Der Elastic AI Chat in Kibana erstellt jetzt Dashboards aus natürlicher Sprache, wobei Ihre Visualisierungen und Analysen in einem Thread beibehalten werden und Sie diese als wiederverwendbare Kibana-Objekte speichern können.
Beobachten, schützen und durchsuchen Sie Ihre Daten mit einer einzigen Lösung. Von der Anwendungsüberwachung bis zur Bedrohungserkennung – Kibana ist Ihre vielseitige Plattform für kritische Anwendungsfälle. Starten Sie jetzt Ihre kostenlose 14-tägige Testphase.
Der Elastic AI Chat in Kibana wandelt jetzt Fragen in einfacher Sprache in ES|QL-gestützte Visualisierungen oder ein vollständiges Dashboard um – direkt innerhalb Ihrer Konversation. Beschreiben Sie die Metriken, die Sie benötigen, verfeinern Sie diese im Laufe des Prozesses und speichern Sie, wenn die Geschichte feststeht. Alles bleibt in der Konversation, bis Sie bereit sind, es zu speichern, dann wird es zu einem erstklassigen Kibana-Objekt, das Ihr Team öffnen, bearbeiten und wiederverwenden kann. Als technische Vorschau in Elastic 9.4 verfügbar

Der Agent erstellt Dashboards von Grund auf, arbeitet aber auch damit, was Sie bereits haben. Öffnen Sie die AI Chat-Seitenleiste, während Sie ein Dashboard aufrufen, dann wird es automatisch angehängt. Fragen Sie nach den Gründen für den plötzlichen Anstieg einer Kennzahl, analysieren Sie die Ergebnisse nach Regionen oder fügen Sie ein Vergleichspanel hinzu. Ihr bestehendes Dashboard wird zum Ausgangspunkt, nicht nur zum Endprodukt.
Hinter den Kulissen: So erstellen wir Dashboards im AI Chat
Wir vermitteln den Agenten spezifische Aufgaben durch Fertigkeiten – strukturierte Beschreibungen, wie man ein bestimmtes Problem angeht. Aber eine Dashboard-Fähigkeit aufzubauen bedeutete, einem LLM beizubringen, gültige Kibana-Dashboards zu generieren, und die alte Saved Object-API gestaltete dies schwierig: Umständlich verschachteltes JSON, subtile Änderungen von Version zu Version, ungenaue Referenzen. Wir brauchten einen anderen Ansatz
Eine speziell entwickelte API für programmatische Dashboards
Die neue Dashboards-API wurde genau für dieses Szenario entwickelt. Statt den internen Rohzustand offenzulegen, bietet es typisierte, validierte Schemata für jeden Paneltyp. Die API übernimmt die Übersetzung zwischen sauberen externen Strukturen und den internen Darstellungen von Kibana, sodass sich der Agent auf den Inhalt des Dashboards konzentrieren kann, anstatt auf dessen Formatierung.
Eine Fähigkeit, ein Tool, viele Einsatzmöglichkeiten
Der dashboard-management Skill stellt ein einzelnes manage_dashboard Tool zur Verfügung, das eine geordnete Reihe von Abläufen akzeptiert. Jeder Ablauf zählt als einzelne Aktion: Metadaten festlegen, ein Markdown-Panel hinzufügen, ES|QL-basierte Visualisierungen aus natürlicher Sprache erstellen, vorhandene Panels bearbeiten, Panels in ausklappbare Abschnitte gruppieren oder Elemente im Raster neu positionieren.
Der Agent kann in einem einzigen Aufruf ein komplettes Dashboard beschreiben: Titel, Beschreibung, Abschnitte und jedes darin enthaltene Panel:
{
 "operations": [
   { "operation": "set_metadata", "title": "Checkout latency investigation" },
   {
     "operation": "add_section",
     "title": "Overview",
     "panels": [
       { "query": "p95 checkout latency over the last 24h", "chartType": "xy" },
       { "query": "checkout error rate by region", "chartType": "metric" }
     ]
   }
 ]
}
Die Abläufe werden der Reihe nach ausgeführt, sodass spätere Schritte auf frühere verweisen und darauf aufbauen können. Dieses Design lenkt den Fokus der Konversation auf die Absicht und nicht auf Details der Umsetzung.
Die Visualisierungspipeline: Natürliche Sprache zu ES|QL zu Visualisierungen
Wenn Sie nach einem Dashboard fragen, untersucht der Agent Ihre Daten – Indizes, Feld-Mappings, Typen – plant dann die Visualisierungen und ruft manage_dashboard auf.
Jedes Panel durchläuft seine eigene Pipeline: Auswahl des Diagrammtyps, ES|QL-Generierung, Visualisierungskonfiguration und Validierung. Wir haben dies vom Haupt-Agent-Thread isoliert – die Erstellung der Visualisierung erfordert mehrere Modellaufrufe pro Panel, und die Einbindung in den Hauptkontext würde das Fenster aufblähen und die Argumentation schwächen.
Im manage_dashboard werden alle Panels gleichzeitig erstellt und dann in der richtigen Reihenfolge neu zusammengesetzt. Das Ergebnis ist ein vollständiges Dashboard mit eingebetteten Panels – keine verwaisten Visualisierungen, keine Synchronisierungsprobleme.
Warum wir die Erstellung von Visualisierungen in das Dashboard-Tool verlagert haben
Bei unserem ersten Ansatz haben wir ein separates create_visualization Tool verwendet – ein Aufruf pro Panel, um dann jeden Anhang an das Dashboard-Tool zu übergeben. Es funktionierte, aber jede Visualisierung brauchte ihren eigenen Tool-Aufruf, ihren eigenen Lebenszyklus und eine explizite Übergabe. Schlimmer noch, die Bearbeitung einer Visualisierung in der Konversation aktualisierte das Dashboard-Panel nicht, was die Nutzer verwirrte.
Wir haben die Erstellung von Visualisierungen direkt in manage_dashboard integriert. Es werden die gleichen parallelen Workflows ausgeführt, Panels jedoch ohne Zwischenanhänge zur Dashboard-Struktur zusammengesetzt. Weniger Aufrufe, keine Synchronisierungsprobleme, ein Lebenszyklus.
Einzelne Visualisierungen funktionieren weiterhin – Sie können bestehende Diagramme über Anhangsreferenzen in ein Dashboard einfügen – aber für die Erstellung von Grund auf ist die Inline-Erstellung der bessere Weg.
Für Sicherheitsteams
SOC-Analysten und Detection Engineers können es sich nicht leisten, mitten in einer Untersuchung zum Dashboard-Editor zurückzukehren. Mit dem AI Chat können Sie das Alarmvolumen nach Regeltyp, Host oder MITRE-Taktik abfragen und es in etwa einer Minute in Ihrem Thread sehen. Während die Suche fortschreitet, fügen Sie Panels hinzu – Anomalien bei der Prozessausführung, Netzwerkverbindungen, Zeitachsenvergleiche – ohne den Kontext zu unterbrechen.
Speichern Sie, wenn Sie fertig sind. Das Dashboard dient als Referenz für die Überprüfung nach Vorfällen, als Ausgangspunkt für den nächsten Analysten oder als wöchentliches Briefing zu Bedrohungen – eine erneute Erklärung ist nicht erforderlich.
Erfahren Sie in diesem Blogbeitrag mehr darüber, wie Sicherheitsteams Dashboard-Erstellungen und andere kürzlich eingeführte AI Chat-Funktionen nutzen können.
Für Observability- und Site Reliability Engineers (SREs)
Wenn ein Dienst um 2:00 Uhr nachts ausfällt, haben Sie keine Zeit, Dashboards von Grund auf neu zu erstellen. Mit dem AI Chat kann ein SRE die benötigten Kennzahlen beschreiben (P99-Latenz nach Dienst, Fehlerquote bei Deployment-Ereignissen, Pod-Neustarts in der letzten Stunde) und in etwa einer Minute ein vollständiges Dashboard im Untersuchungs-Thread erhalten. Der Agent kann die Darstellung schrittweise verfeinern, sobald sich das Bild klärt: Ein Panel hinzufügen, das Zeitfenster ändern, nach Regionen aufschlüsseln.
Speichern Sie das Dashboard, dann ist es sofort für alle im Lagezentrum verfügbar (gleiche Panels, gleiches Framing), die der Incident Bridge beitreten. Nach dem Vorfall wird es zur Grundlage für die Nachbesprechung.
Was kommt als Nächstes?
Wir arbeiten an der Token-Optimierung, reichhaltigeren Vollbild-Interaktionen, breiterer Panel-Unterstützung und kontinuierlichen Qualitätsverbesserungen. Die technische Vorschau ist der richtige Zeitpunkt, um Prioritäten zu setzen – falls etwas fehlt, teilen Sie uns dies über das Symbol „Feedback einreichen“ im oberen Menü mit.
Ausprobieren
Führen Sie ein Upgrade auf Elastic 9.4 durch (oder starten Sie eine Testversion), öffnen Sie den AI Chat im Vollbildmodus und probieren Sie ihn bei einer echten Untersuchung aus. Bitten Sie den Agenten, die von Ihnen betrachteten Kennzahlen grafisch darzustellen, und um die nächste Aufschlüsselung. Wenn die Geschichte stimmt, speichern und teilen Sie sie – gleiche Panels, gleiches Framing, keine erneute Erklärung nötig. Erfordert eine Unternehmenslizenz (Jetzt loslegen). Die Entscheidung über die Veröffentlichung der in diesem Blogbeitrag beschriebenen Leistungsmerkmale und Features sowie deren Zeitpunkt liegt allein bei Elastic. Es ist möglich, dass noch nicht verfügbare Leistungsmerkmale oder Features nicht rechtzeitig oder überhaupt nicht veröffentlicht werden.
Wie hilfreich war dieser Inhalt?
Zugehörige Inhalte

Kibana Dashboards API: Ein stabiler Vertrag für jeden Panel-Typ, vor GA von über 50 Teams getestet
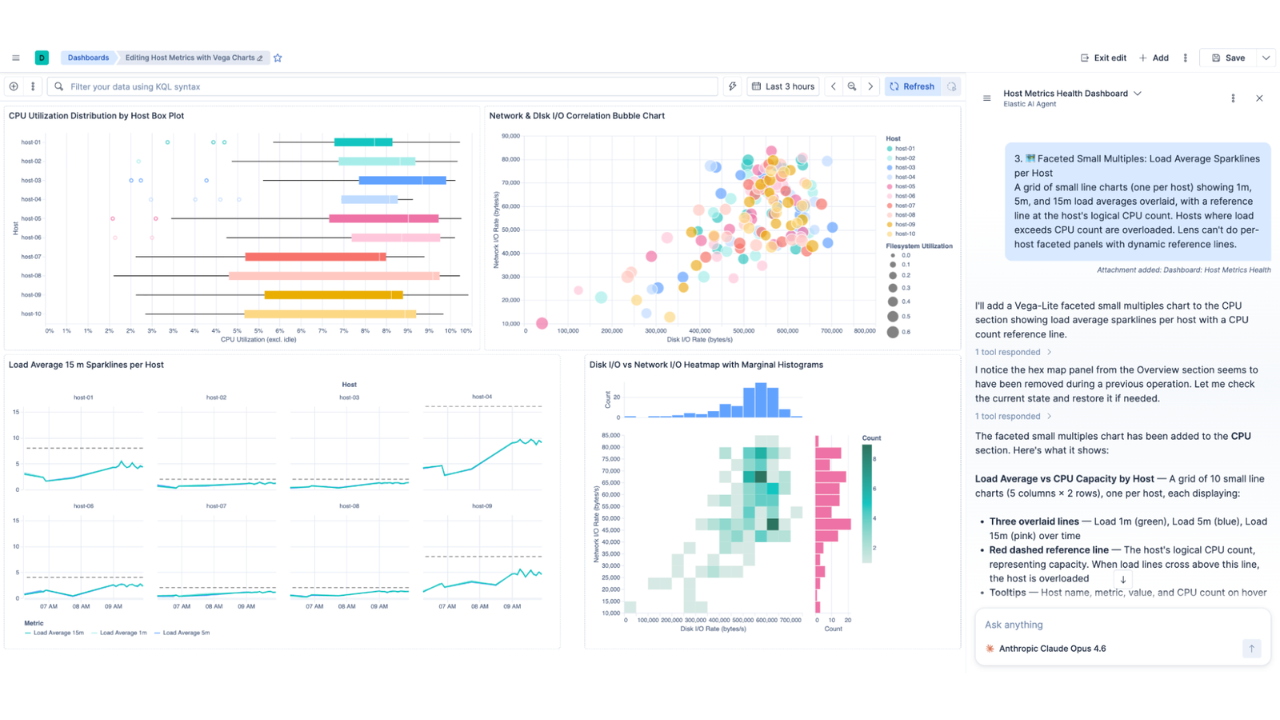
Direkt zum Dashboard in unter einer Minute, fünfmal günstiger: KI-Dashboards und benutzerdefinierte Vega-Lite-Diagramme in Kibana

137.000 Menschen, keine menschlichen Entscheidungen: agentische Katastrophenreaktion mit Elasticsearch