Agent Builder is available now GA. Get started with an Elastic Cloud Trial, and check out the documentation for Agent Builder here.
New models are released every week that surpass previous ones in intelligence, speed, or cost. This makes vendor lock-in risky and managing multiple connectors, billing accounts, and APIs unnecessarily complex. Each model behaves differently, in terms of token consumption, response latency, and compatibility with specific tool sets.
In this article, we'll build an AI-enriched audio products catalog, connect it to Elastic Agent Builder, and use OpenRouter to access different models while monitoring their performance across the entire workflow, from data ingestion to agent interactions.
Prerequisites
- Elastic Cloud 9.2 or Elastic Cloud Serverless
- Integration server with APM enabled
- OpenRouter account and API Key
- Python 3.9+
What is OpenRouter?
OpenRouter is a platform that unifies access to over 500 models from multiple providers through a single account and API. Instead of managing separate accounts for OpenAI, Anthropic, Google, and others, you access all of them through OpenRouter.
OpenRouter handles load balancing across providers, automatically routing requests to the provider with the best latency and fewest errors. You can also manually select providers or configure fallback chains. OpenRouter is compatible with standard APIs, code assistants, integrated development environments (IDEs), and more.
One key feature is Broadcast, which sends traces of your model usage to external observability systems. Since OpenRouter supports OpenTelemetry, we can monitor our complete pipeline plus any other OpenRouter usage costs in the Elastic Stack.
Architecture overview
We'll use an audio products catalog for which we generate new fields with AI using an inference ingest pipeline and then create an agent that can answer questions based on the indexed product data.
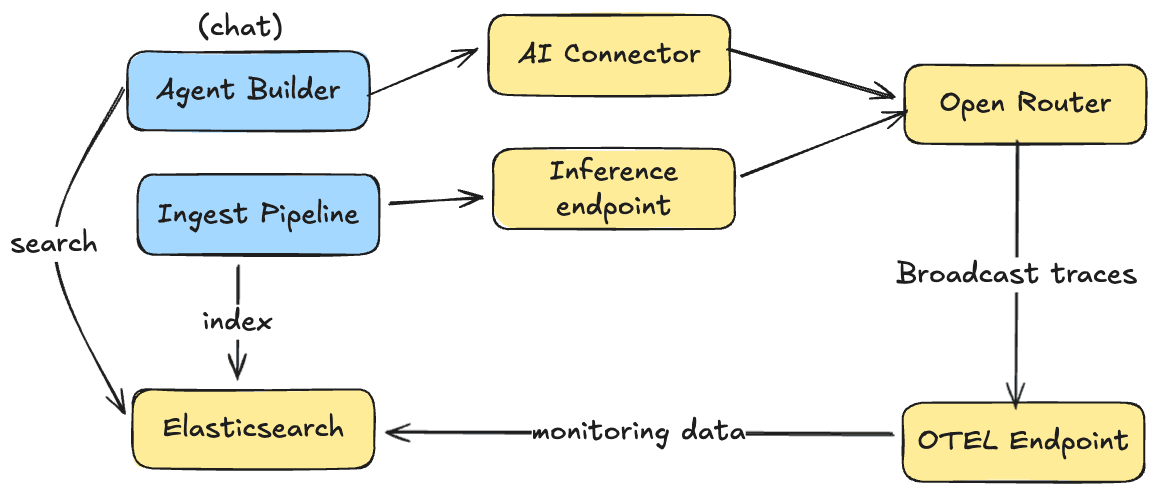
When ingesting data, the ingest pipeline uses an OpenRouter inference endpoint to generate new attribute fields based on the unstructured descriptions of the products, which triggers OpenRouter to send logs about that inference to Elasticsearch.
Similarly, when chatting with the Agent Builder that uses this data, logs are also sent to Elasticsearch for visualization.
We’ll use separate OpenRouter API keys for Agent Builder and ingestion:
OPENROUTER_API_KEYfor Agent Builder InteractionsOPENROUTER_INGESTION_KEYfor the inference pipeline
This allows us to differentiate traffic in monitoring dashboards and attribute costs to specific workflows.
Setup
First, we need to create an AI connector for the agent to interact with the large language model (LLM) and an inference endpoint for the ingest pipeline to extract fields from descriptions. Both connect to OpenRouter using the same API (but can use different keys for monitoring separation).
Create the AI connector
The AI connector allows Agent Builder to communicate with LLMs. We configure it to use OpenRouter as the provider:
We use a reasoning-capable model, like GPT-5.2, for the agent since it needs to handle complex queries and tool orchestration.
Create the inference endpoint
The inference endpoint allows Elasticsearch to call LLMs during data processing:
We use a fast, cheaper model, like GPT-4.1 Mini, for bulk ingestion tasks that don't require advanced reasoning capabilities.
Data pipeline
Let's configure the ingest pipeline. It will read from the product description field and extract structured categories that Agent Builder can use for filtering and aggregations.
For example, given this product description:
"Premium wireless Bluetooth headphones with active noise cancellation, 30-hour battery life, and premium leather ear cushions. Perfect for travel and office use."
We can extract:
- Category: Headphones
- Features: ["wireless", "noise_cancellation", "long_battery"]
- Use case: Travel
The key is providing possible values to the LLM as an enum so it groups consistently. Otherwise, we might get variations like "noise cancellation", "ANC", and "noise-canceling" that are harder to aggregate.
After using OpenAI to extract a JSON with the new attributes, we use the json processor to spread them into new fields.
Now let's index some sample audio products:
Agent Builder
Now we can create an Agent Builder agent to use this index and answer both text questions and analytical queries using the new fields we've created:
For tools, we use search for semantic queries and Elasticsearch Query Language (ES|QL) for analytical queries:
Now you can chat with your agent and ask questions like:
- "What headphones do we have for travel?"
- "Show me products with noise cancellation under $200"
- "What's the average price by category?"
The agent uses the AI-enriched fields to provide better filtering and aggregations.
Implementing OpenRouter Broadcast
Now let's set up inference monitoring. First, we need our OpenTelemetry endpoint URL. Navigate to the APM tutorial in Kibana:
Collect the URL and authentication token from the OpenTelemetry tab:
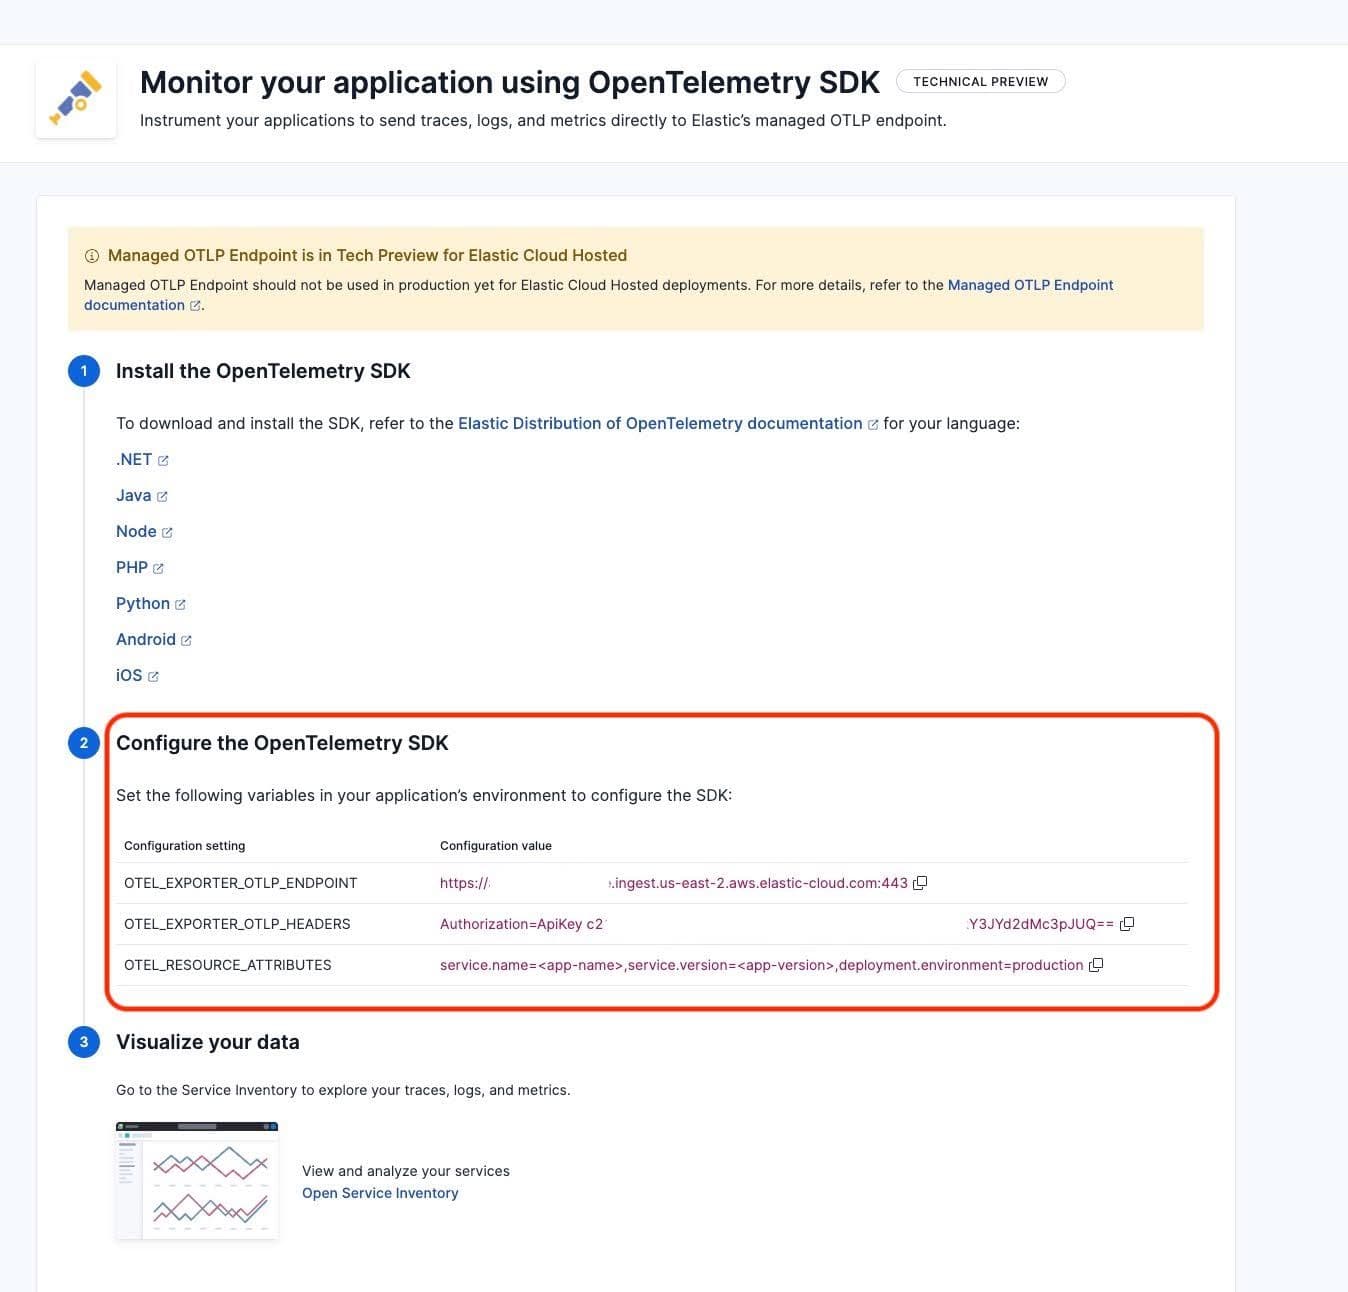
Important: Your Kibana server needs to be reachable via the public internet so that it can receive data from OpenRouter.
In OpenRouter, go to Broadcast settings and add a new destination for the "OpenTelemetry Collector":
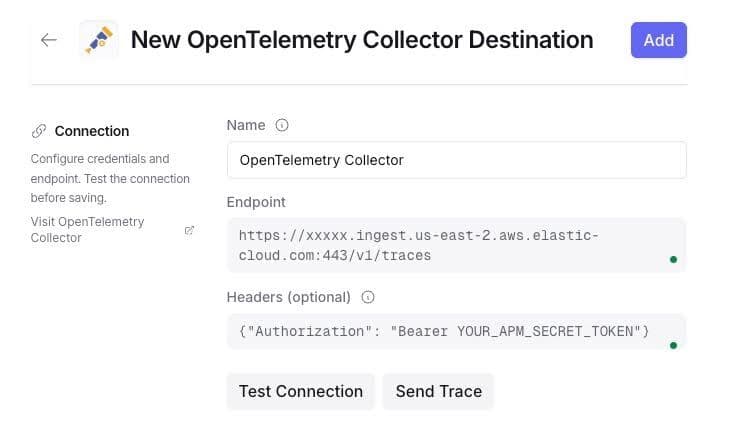
Important: Configure the endpoint with the /v1/traces path and authentication headers:
Press Test connection, and you should see a success message.
Monitoring in Elastic
After using OpenRouter models, you should start seeing documents in Kibana. The indexed documents are in the data stream traces-generic.otel-default with service.name: "openrouter" and include information about:
- Request and response details.
- Token usage (prompt, completion, total).
- Cost (in USD).
- Latency (time to first token, total).
- Model information.
From now on, the activity of the inference pipeline and Agent Builder in relation to LLM usage will be recorded in OpenRouter and sent to Elastic.
Default APM dashboards
You can view the default dashboards in Kibana under Observability > Applications > Service Inventory > openrouter:
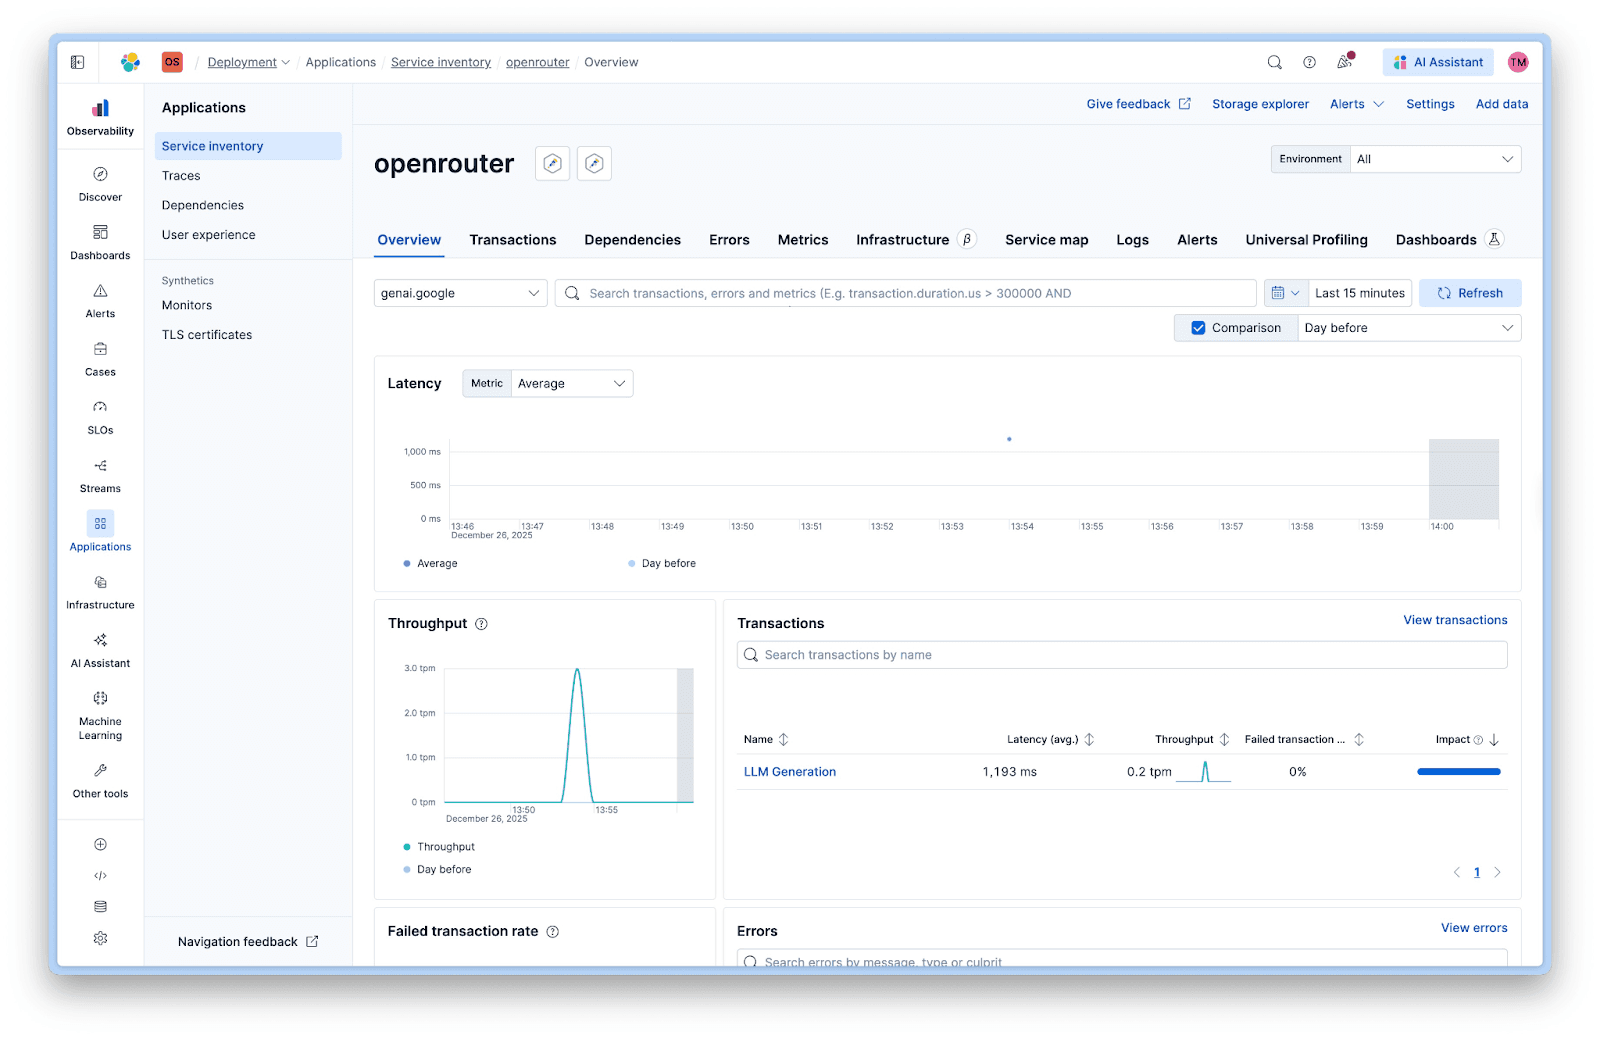
The service view shows:
- Latency: Average response times across all calls.
- Throughput: Requests per minute.
- Failed transactions: Error rates.
- Transactions: Breakdown by operation type.
Custom LLM monitoring dashboard
For more control over the information displayed, you can create a custom dashboard. We created one that differentiates ingestion from agent chat and measures relevant parameters, like token usage and cost, plus usage outside Elastic, like coding assistants via API key filters:
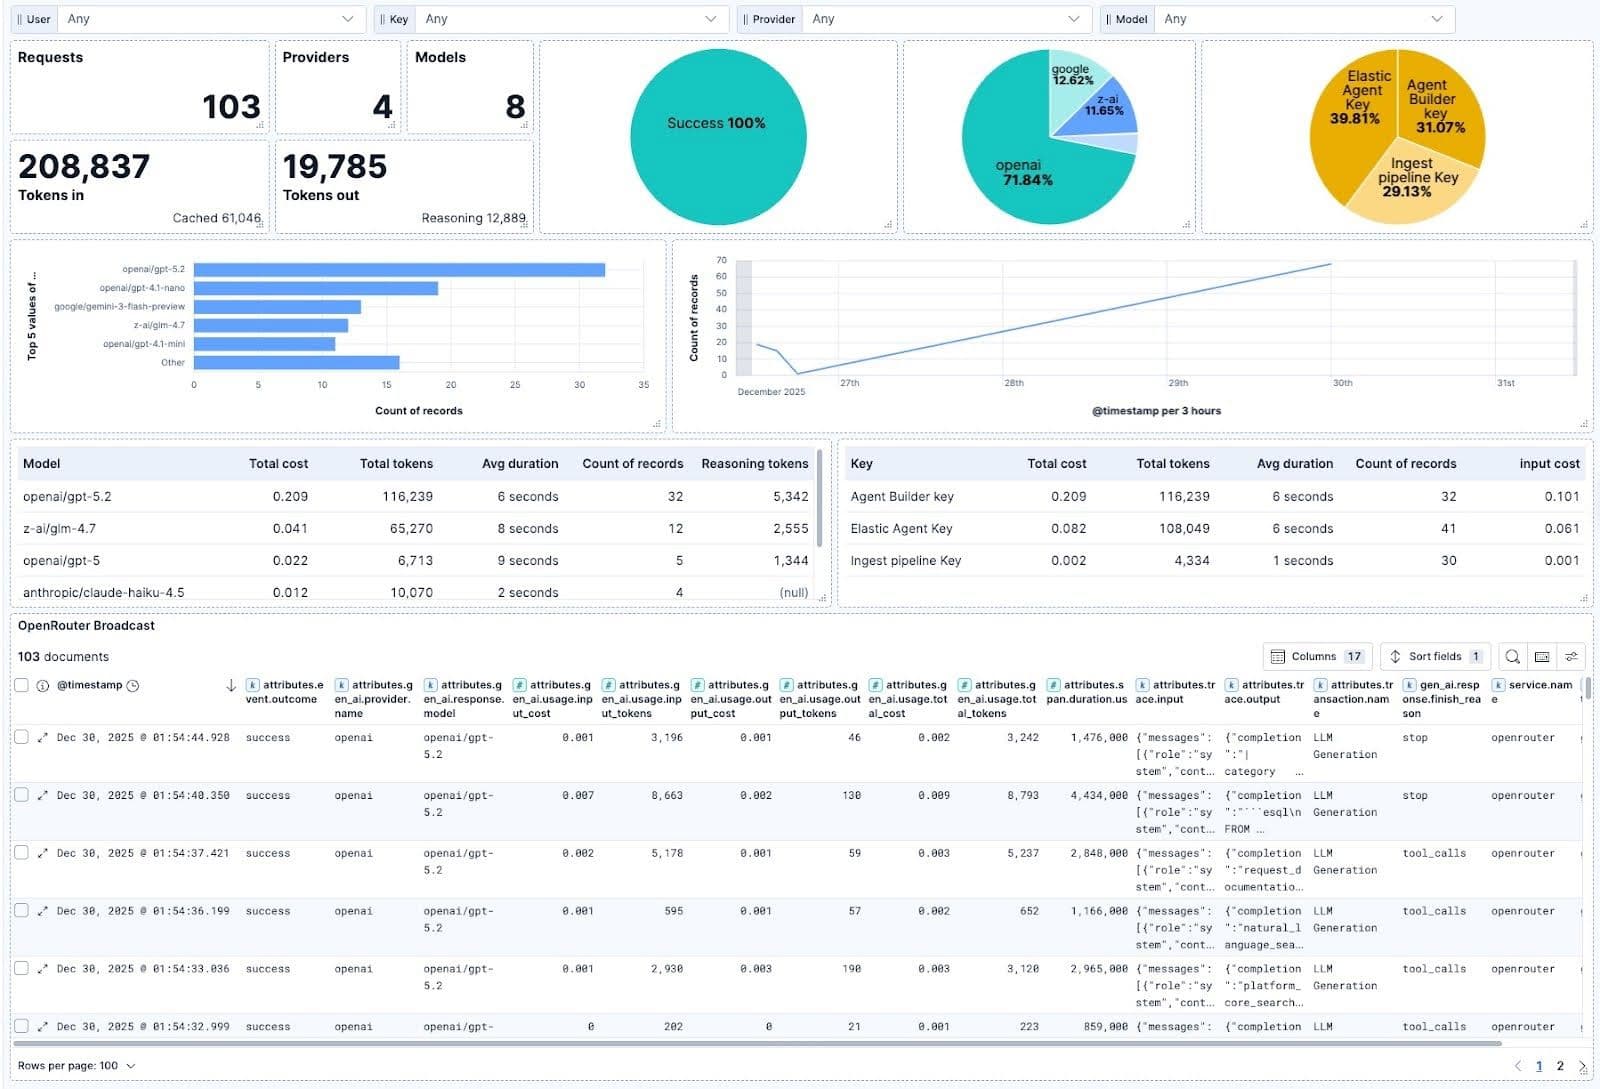
The dashboard shows:
- Success rate by workflow type.
- Token usage by model.
- Cost breakdown by API key.
- Latency trends over time.
- Model comparison metrics.
You can download the dashboard here and import it to your Kibana instance using Saved Objects import.
Conclusion
OpenRouter lets you move quickly and test multiple models and providers using the same API and billing account, making it convenient to compare models of different types—large parameter, small parameter, commercial, open source, and more.
Using OpenRouter Broadcast, we can effortlessly monitor the performance of these models during ingestion via ingest pipelines or chat via Agent Builder, plus combine it with OpenRouter usage for other purposes, like coding agents and apps.
Related Content
July 23, 2026
Faster Elasticsearch issue triage with redesigned AutoOps
AutoOps introduces clearer severity, updated page layouts, and simpler issue triage for Elastic Cloud Hosted deployments and Cloud Connect clusters.
July 20, 2026
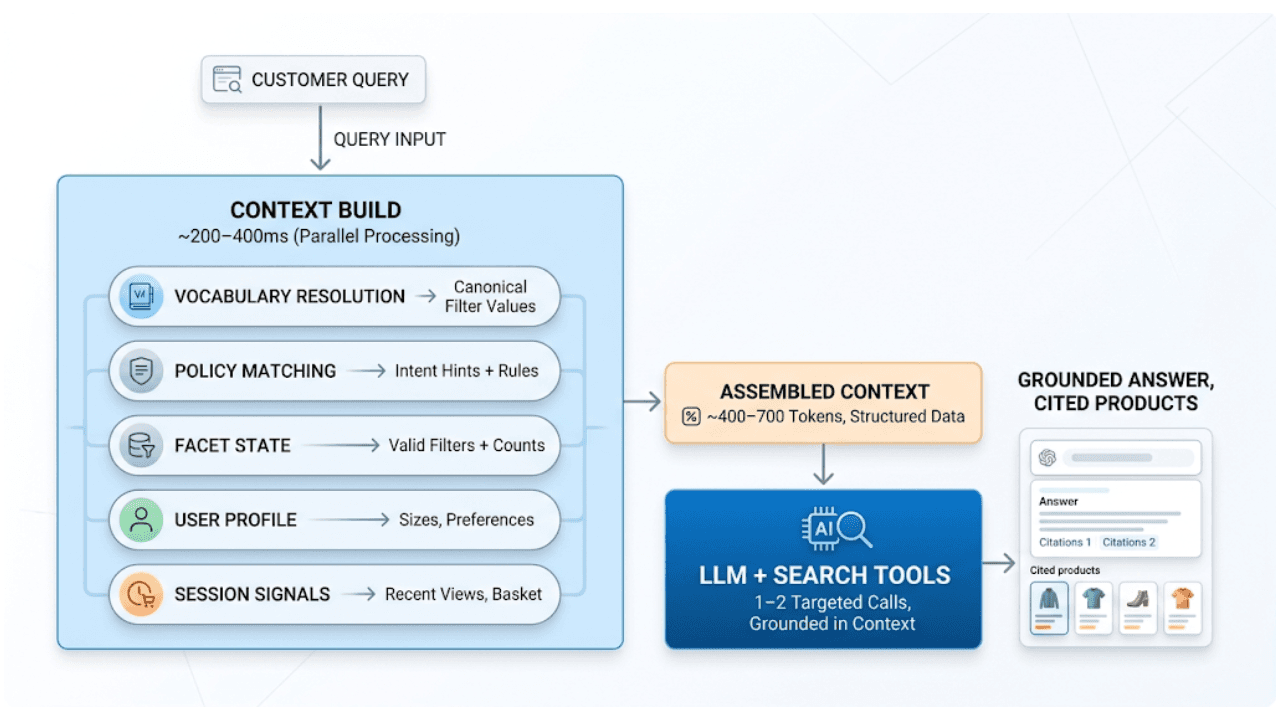
AI shopping agents: Why context comes before the query
AI shopping agents that guess at your vocabulary make expensive mistakes. Pre-computed catalog context stops the guessing before the first tool call.
July 15, 2026
98.9% faster queries, 4x more indexing throughput: a systematic Elasticsearch performance diagnosis
Use AutoOps, the Profile API and ES Rally together to find cluster hotspots, slow queries and index bottlenecks, with real benchmarks showing a 98.9% latency cut and 4x indexing gain.

July 7, 2026
Your compliance posture just got an upgrade: Elasticsearch now supports FIPS 140-3
Elastic 9.4 brings FIPS 140-3 support for Elasticsearch and Kibana to GA. Here's what changes for federal, defense and regulated deployments, and how to migrate from 140-2.
June 30, 2026
Building a multilingual voice agent with Elastic Agent Builder & Sarvam AI
A working demo combining Sarvam AI speech with Elastic Agent Builder: identity verification, per-customer ES|QL queries, and mid-call language switching across 22 Indian languages without multilingual indices.