AutoOps in action: Investigating Elasticsearch cluster performance on ECK
Explore how Elastic's InfoSec team implemented AutoOps in a multi-cluster ECK environment, cutting cluster performance investigation time from 30+ minutes to five minutes.
Update: AutoOps now supports ECK native integration. Read more here.
At Elastic, the InfoSec Security Engineering team is responsible for deploying and managing InfoSec's ECK clusters. In the Elastic on Elastic series, we highlight InfoSec’s role as Customer Zero. By running the latest stack versions and features, we aim to provide practical advice and an inside look at how we operate. In this segment, we cover installing AutoOps in our multi-cluster Elastic Cloud on Kubernetes (ECK) environment and highlight how it delivered value immediately.
AutoOps for Elasticsearch streamlines cluster operations by providing performance recommendations, resource utilization insights, real-time issue detection, and guided remediation. With the recent announcement of AutoOps for self-managed (on‑premises) clusters, we were eager to deploy it and see how it could help us monitor and maintain the health of our large multi-cluster ECK environment.
Installing AutoOps for ECK
To ensure scalability and consistency, the Security Engineering team aims to manage all infrastructure as code (IaC). Staying in line with this approach, we created a Helm chart to deploy the AutoOps agent across our ECK environment. For additional information on our base ECK and Helm approach, please refer to a previous blog post in this series.
AutoOps chart
cloud-connected-autoops/
├─ chart.yaml
├─ values.yaml
└─ templates/
   └─ deployment.yaml
chart.yaml
apiVersion: v1
description: Autoops cloud connected Agent chart
name: cloud-connected-autoops
version: 0.1.0
values.yaml
version: 9.2.0deployment.yaml This is derived from the official AutoOps repository, however we templatized the image version to simplify future upgrades and enable compatibility with our existing automation:
 image: >-
   docker.elastic.co/elastic-agent/elastic-otel-collector-wolfi:{{ .Values.version }}
With the AutoOps Helm chart defined, we can now install AutoOps in our environment using Cloud Connect. This feature allows us to use Elastic Cloud services within our self-managed ECK clusters without the overhead of installing and maintaining additional infrastructure.
The documentation outlines the required steps for setting up an Elastic Cloud Connect account and generating the necessary connection details for each cluster. Given our ECK environment, we utilized the Kubernetes installation method.
With the connection configured, we only needed to enable the Elastic Agent by adding a simple boolean flag to the values.yml for each ECK cluster:
cloud-connected-autoops:
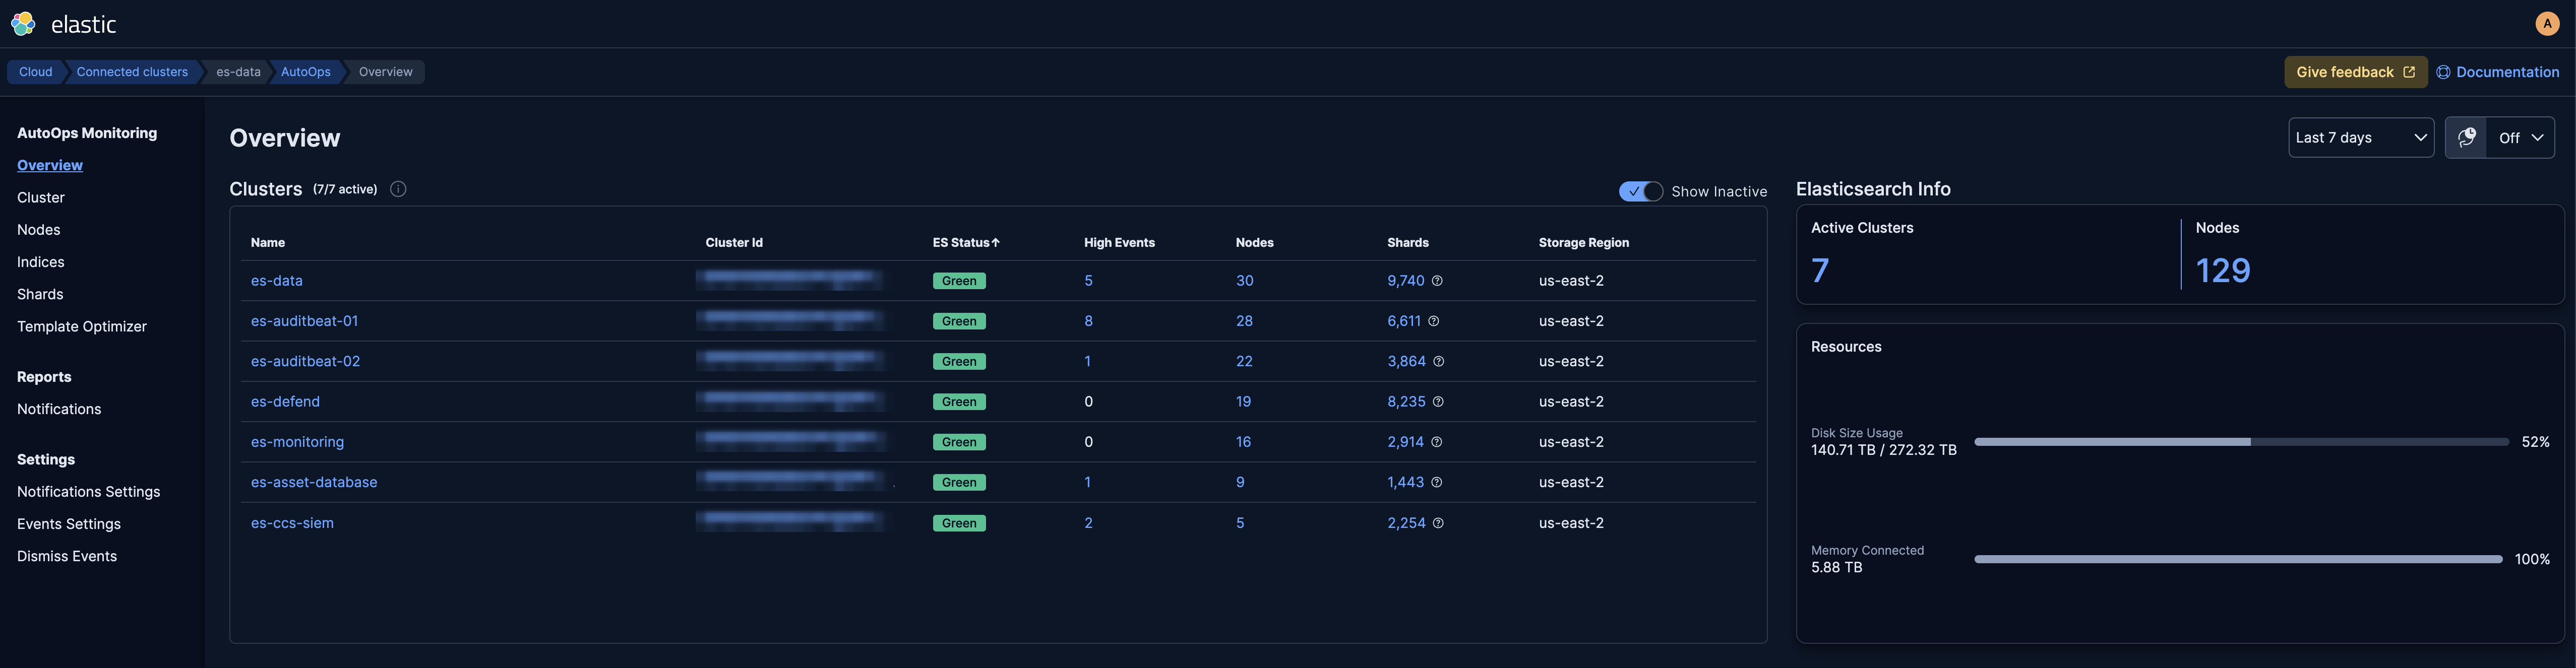
enabled: trueOnce the installation is complete, each connected cluster should be listed on the AutoOps overview page:
AutoOps in action
We currently utilize Stack Monitoring to monitor cluster health and use default rules to send us alerts. While we plan to migrate to AutoOps alerting in the near future, our existing alerting still relies on Stack Monitoring.
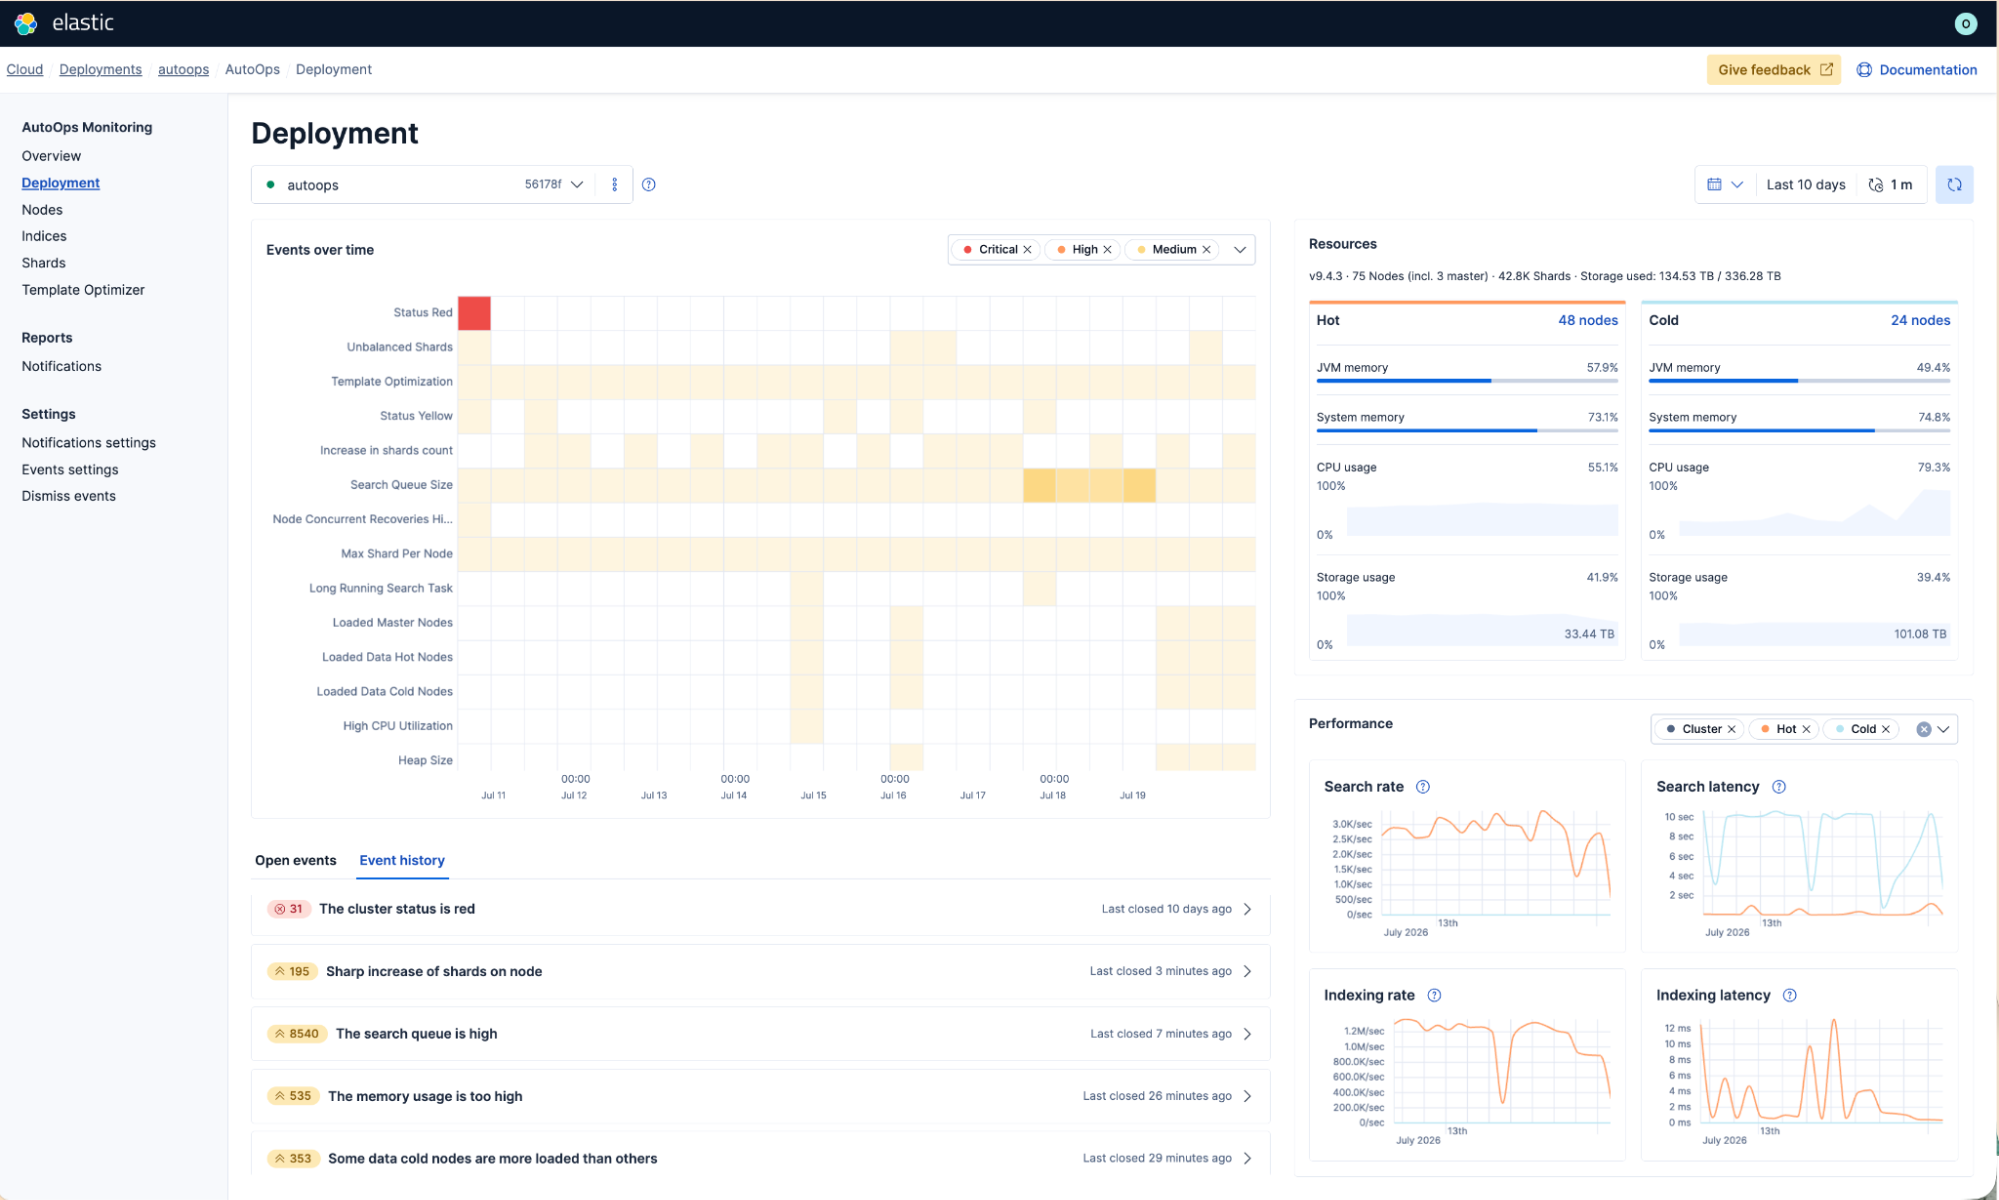
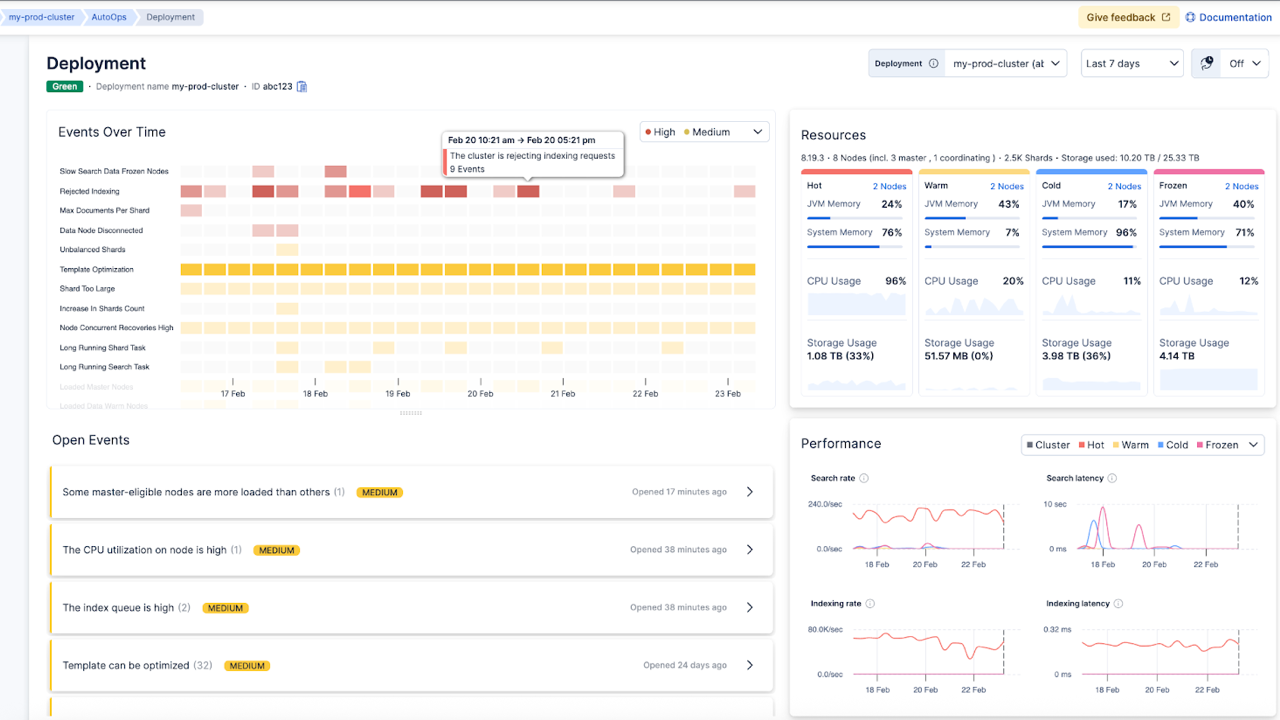
The opportunity to test AutoOps presented itself when we received a thread pool write rejections alert in our alerting Slack channel:

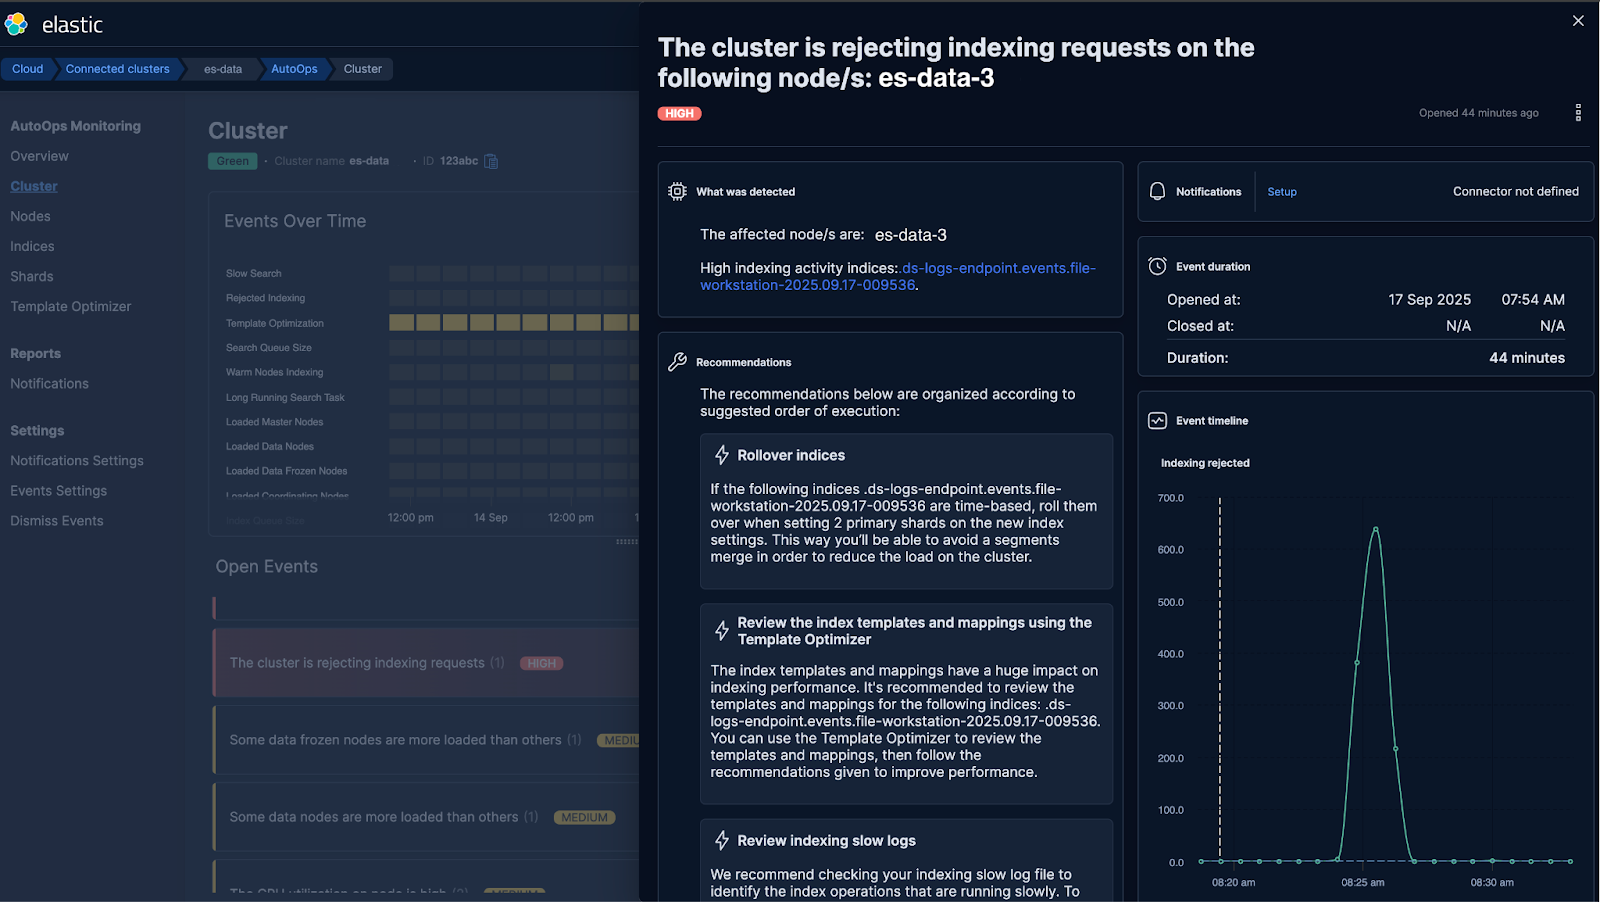
After receiving the standard alert, we checked AutoOps for additional context. AutoOps flagged the same issue but provided extra crucial detail, including the exact index causing the write rejections:
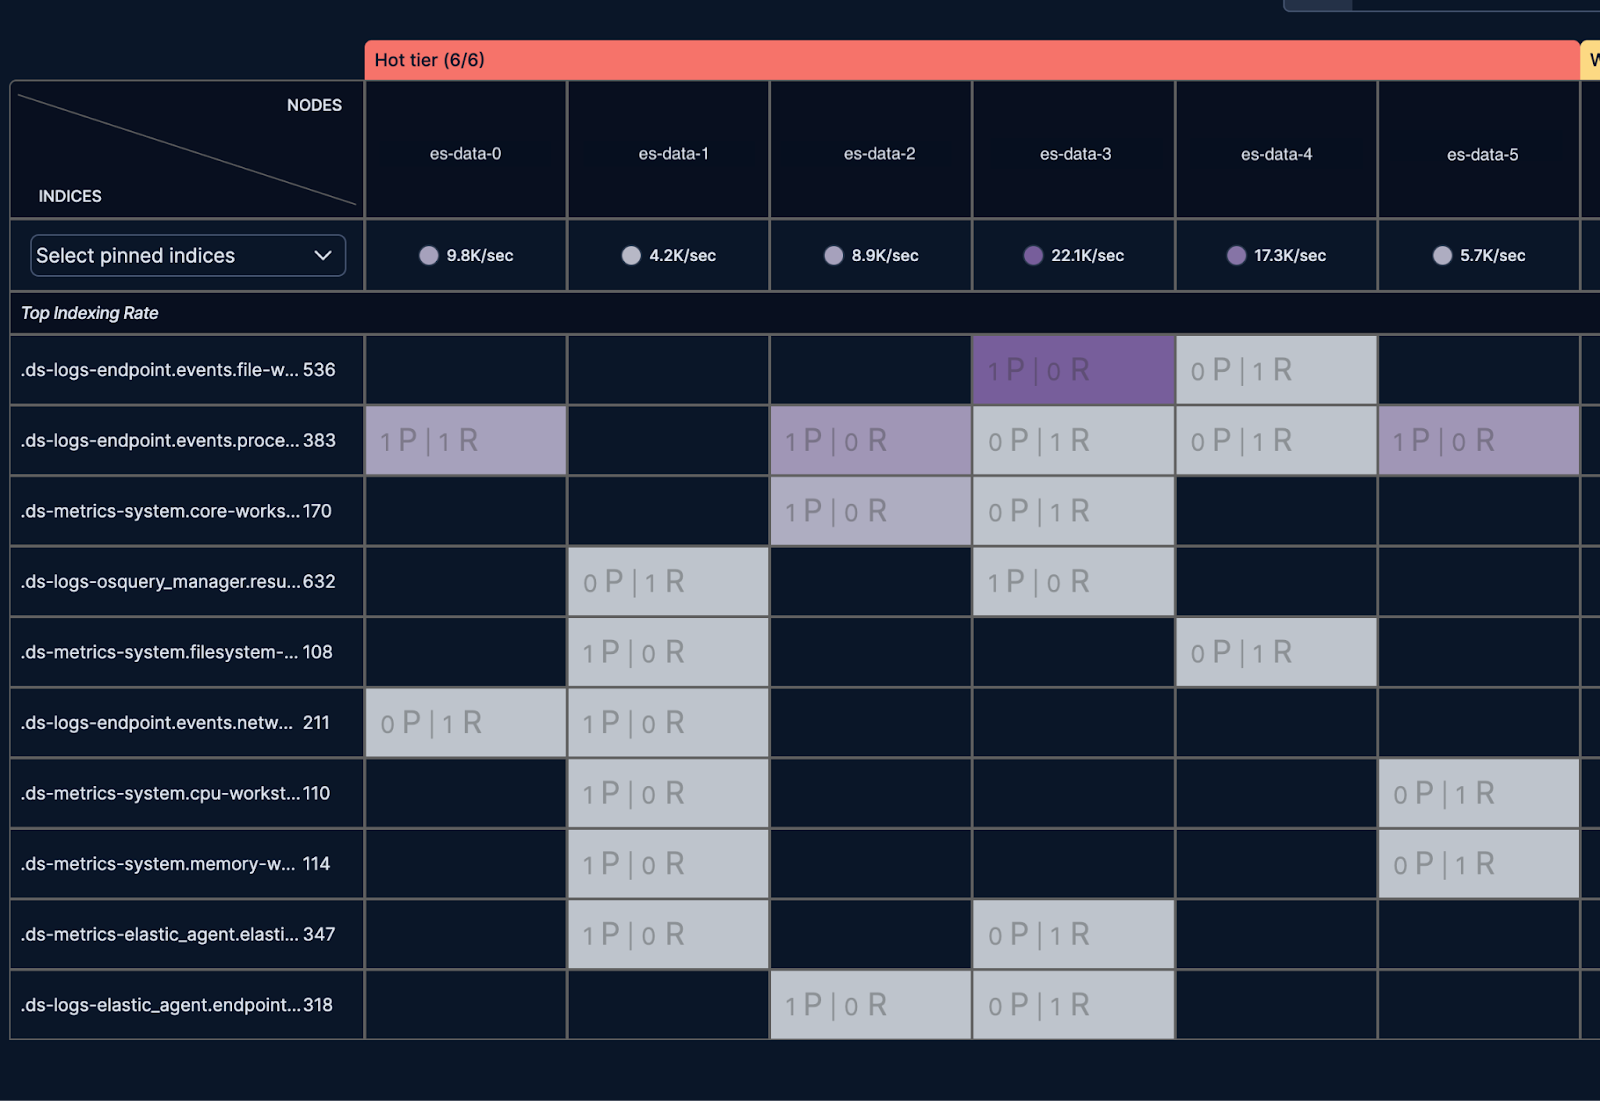
Next, we navigated to the shard Analyzer page, which visualizes sharding hotspots. The visualization made it clear that this particular node had the highest ingestion rate and was managing two write indices. The graph also indicated other nodes that were underutilized:
To alleviate the load on es-data-3, we moved the smaller write index to es-data-5 using a cluster reroute command:
POST /_cluster/reroute
{
"commands": [
{
"move": {
"index": ".ds-logs-osquery_manager.result-workstation-2025.09.15-000632",
"shard": 0,
"from_node": "es-data-3",
"to_node": "es-data-5"
}
}
]
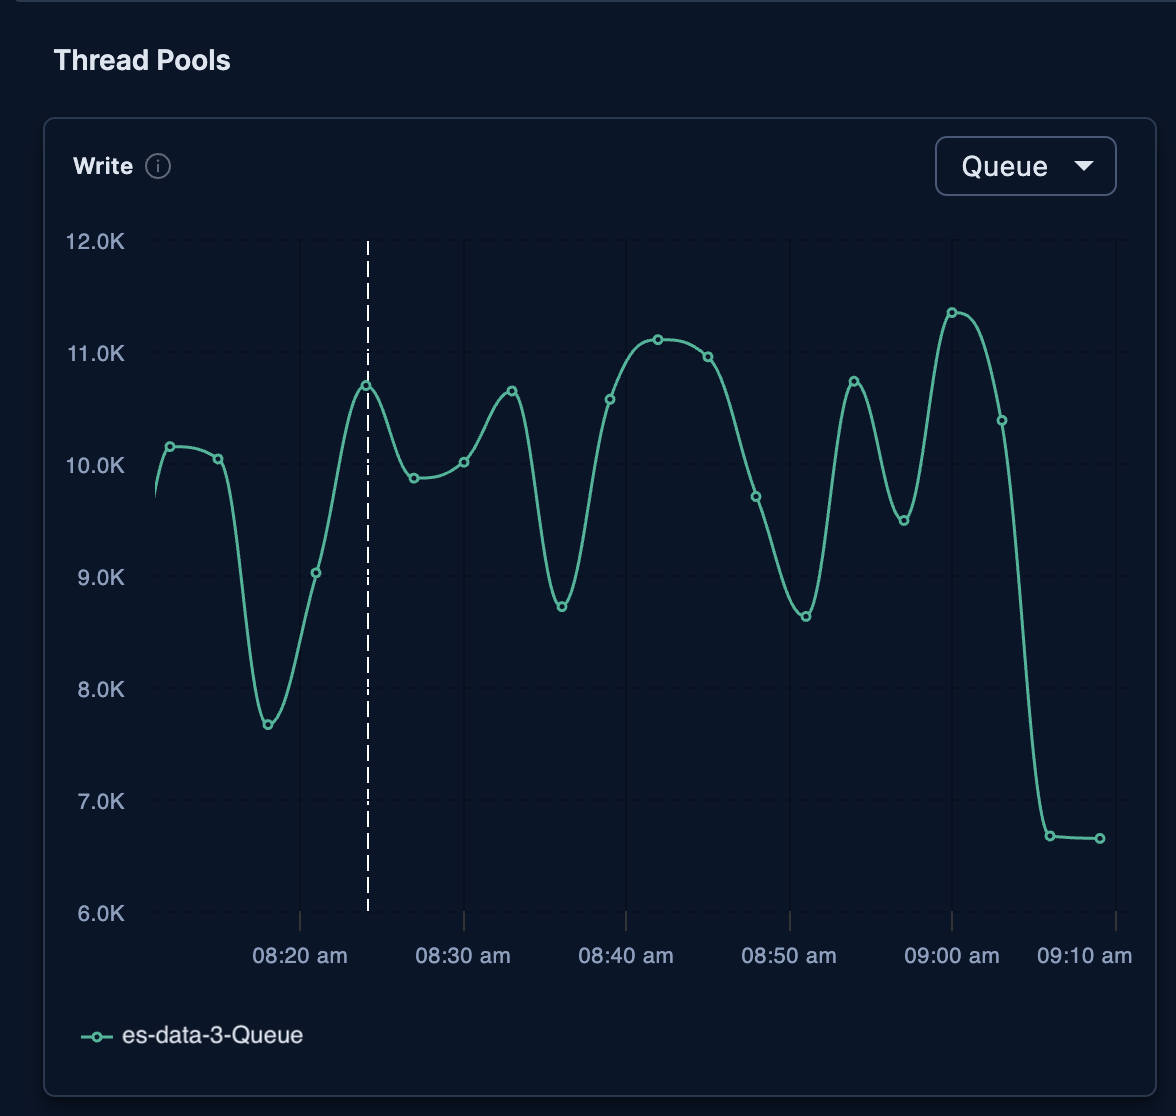
}After executing the reroute, the write thread pool for es-data-3 decreased immediately:
Without AutoOps, investigating Elasticsearch performance would have required manually querying individual node metrics, shard allocations, and thread pools, often through multiple point in time API calls. AutoOps centralizes this data, continuously collects it in real time, and visualizes trends over time. As a result, we were able to investigate and resolve an issue that would have previously taken thirty minutes or more in just five minutes.
While this example only scratches the surface of AutoOps’ capabilities, our hands-on experience shows that its detailed metrics and visualizations make investigating and resolving Elasticsearch performance issues easier and more efficient than previously possible.
To learn more about deploying AutoOps for Self Managed clusters, check out the announcement.