Reporting
Generate, schedule, and email reports
Quickly generate reports of any Kibana visualization or dashboard. Get a report on demand, schedule it for later, trigger it based on specified conditions, and automatically share it with others — managers, customers, compliance officers. It's architected to scale and travel well, letting you take a piece of Kibana anywhere you like.
Getting started with Elasticsearch: Store, search, and analyze with the open source Elastic Stack.
Watch videoIntro to ELK: Get started with logs, metrics, data ingestion and custom visualizations in Kibana.
Watch videoGetting started with Elastic Cloud: Launch your first deployment.
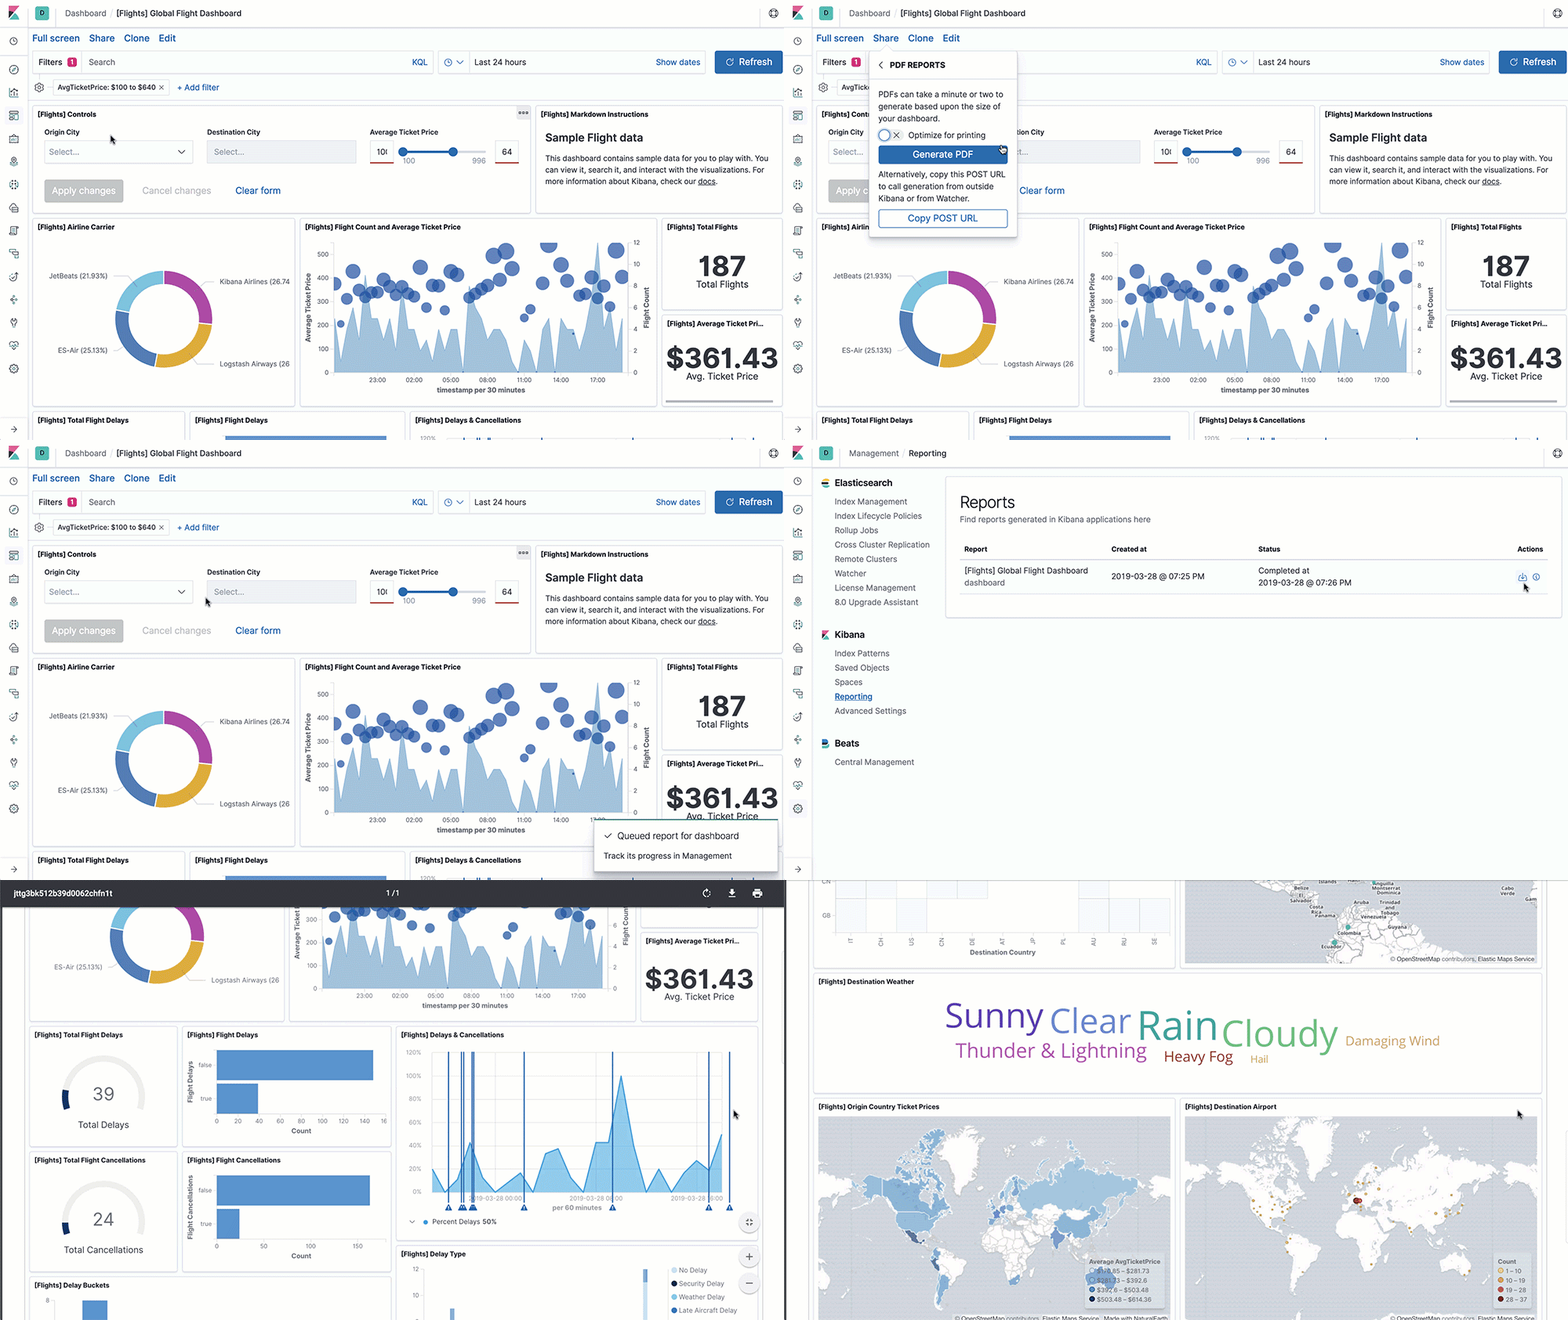
Learn morePush a button, get a report. Easy.
Kibana is a fantastic way to visualize and explore your Elasticsearch data. Its reporting features let you easily export your favorite Kibana visualizations and dashboards. Each report is print-optimized, customizable, and PDF-formatted. And the option to add your own logo will give your reports the branded, polished look that will color your team impressed.

Ship reports on a schedule or per-event basis
Email recurring status updates — daily, weekly, fortnightly, you choose — of your infrastructure health, website metrics, and more to your team by combining the reporting and alerting capabilities. Or trigger a report when certain conditions are met, say, when more than a specified number of errors occur over a defined period of time.
Export raw documents, saved searches, and metrics
Quickly export the results of your ad-hoc analysis into a CSV file to share with your colleagues. Share an exact replica of your findings in the Kibana UI — including the columns defined, formatted fields, and scripted fields. Want to get your raw data more frequently? Combine CSV export with our alerting capabilities to schedule data dumps regularly or send only when specific conditions are met.

Everyone can have a report. Share the Kibana.
Handle a large volume of reporting requests. With built-in, asynchronous rendering, reporting for the Elastic Stack scales for the modern enterprise. No additional infrastructure is needed. And keep a pulse on your reports in progress, successful, or failed with the reporting status screen. The interface also lets you download past reports.
Kibana visualizations are more portable than ever
Taking your Kibana visualizations and dashboards offline never looked so good. This helps share the Kibana love with stakeholders who don’t have or need ready access to your live Kibana instance.