Elastic Observability 7.5.0 released
Elastic Observability 7.5 brings a significant expansion of our metrics story and adds several key integrations between APM, logging, and security data for organizations adopting observability initiatives.
Our metrics story has gained steam in recent releases with the addition of Metrics Explorer, a purpose-built user interface for real-time metrics analytics. We’ve also made it easier to get started with metrics using turnkey data integrations for the most important infrastructure and service metrics, including Kubernetes, Prometheus, and Amazon Web Services (AWS). In 7.5, we build on that momentum by introducing turnkey monitoring of Microsoft Azure metrics and logs as part of our partnership with Microsoft. We have also added initial support for viewing endpoint security data directly in the Elastic Metrics and Logs apps. These advances help Elastic Stack users set up monitoring of critical services more quickly and enable them to combine metrics with important events, such as audit logs from endpoint devices, more efficiently.
This release also helps analysts identify contributing factors and get to the root cause of incidents faster by adding “easy button” navigation from traces to logs driven by deterministic correlation based on unique identifiers in distributed traces. Finally, analysts can make use of a curated user interface for anomaly detection on top of log data and monitor the status of Kubernetes services with Uptime more effectively via flexible configuration aimed at dynamic environments.
"Over the past several years, we have been in the process of completely redesigning our end-to-end enterprise monitoring system, moving from a complex, multi-tool architecture to one that is centered around the Elastic Stack," said Mick Miller, Senior Product Manager, Cloud Native Team at KeyBank. "As we continue the effort to merge previously disparate datasets into Elastic, we are excited by updates coming in the 7.5 release and beyond, especially new workflows that allow analysts to move seamlessly between APM traces, logs, and metrics. Weaving together all data points related to a critical business application makes our analysts more productive, as they query and analyze logging, metrics, and tracing data in one single view."
Azure cloud monitoring
Earlier in the year, we introduced support for Microsoft Azure as part of the Elasticsearch Service on Elastic Cloud. In 7.5, our Azure monitoring story gets even stronger with the addition of turnkey metrics and logs ingestion directly from Azure services. "Microsoft is pleased to see our collaboration with Elastic resulting in Azure-optimized monitoring capabilities and enhanced experiences for developers on Azure," said John Montgomery, Corporate Vice President of Product from Microsoft's Developer Division. With the addition of Metricbeat and Filebeat modules for Azure monitoring, Azure users can now directly monitor logs and metrics from Azure Event Hub and Azure Monitor and use pre-built Kibana dashboards to speed up the analysis.
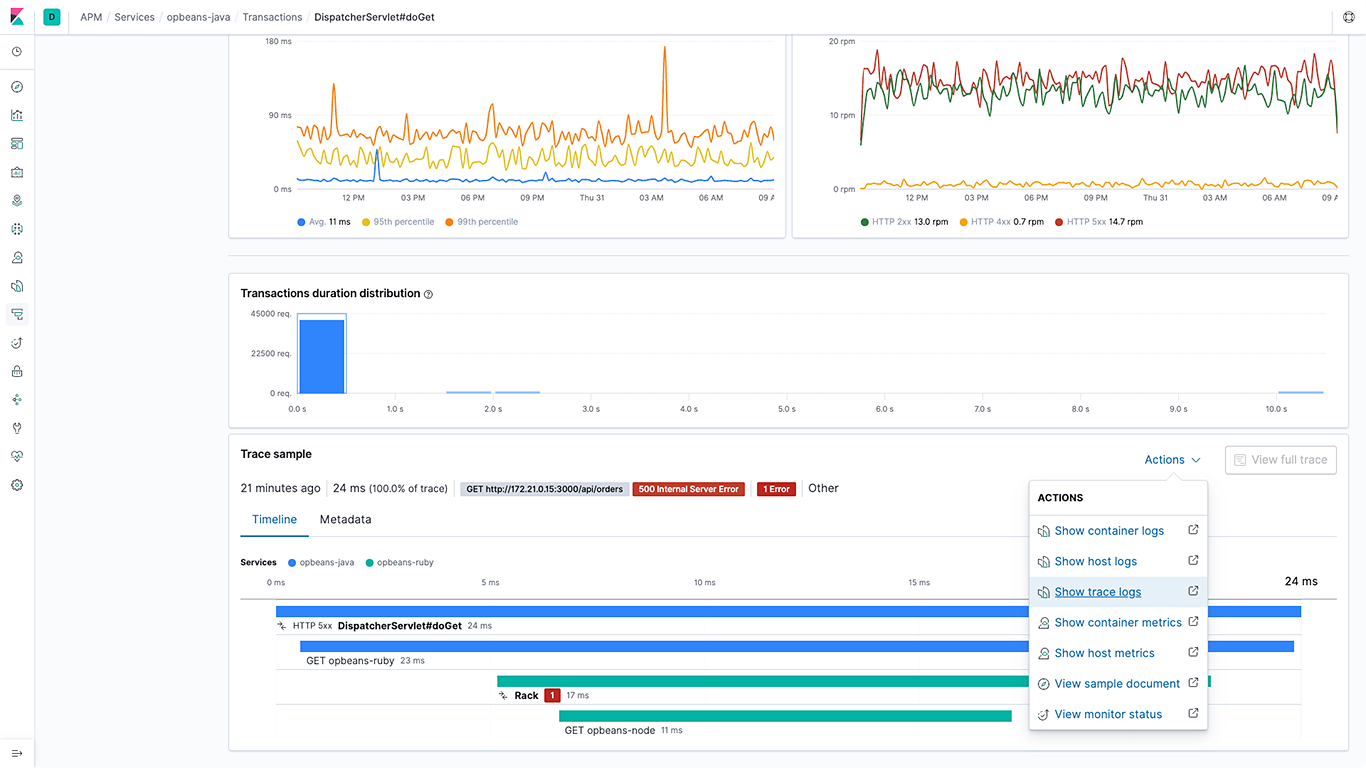
Navigation between APM traces and logs
The 7.5 release significantly expands the ability to navigate from APM traces to logs by adding support for writing the trace unique identifier (ID) in log messages in all Elastic APM agents. APM agents also write these structured logs directly in Elastic Common Schema (ECS) format. The Elastic APM and Logs apps leverage correlation IDs introduced by the agents to navigate between traces and logs in a deterministic manner. This ability allows analysts to bring together all data related to a slow or failed APM transaction with the click of a button.
Log rate anomaly detection
Machine learning and anomaly detection can help operators pick out important trends that they would otherwise miss in a sea of data. The rate at which logs from different sources come into the system is important. A change in that rate could signal a number of important events: a new application or log source was just onboarded, logging activity suddenly went up due to a promotion (or an attack!), log shipping suddenly stopped, perhaps due to an agent or ingest pipeline malfunction, and so on.
In 7.5 we introduce a curated UI for dataset-based log rate anomaly detection, which enables operators to get instant answers to all these questions with a single click.
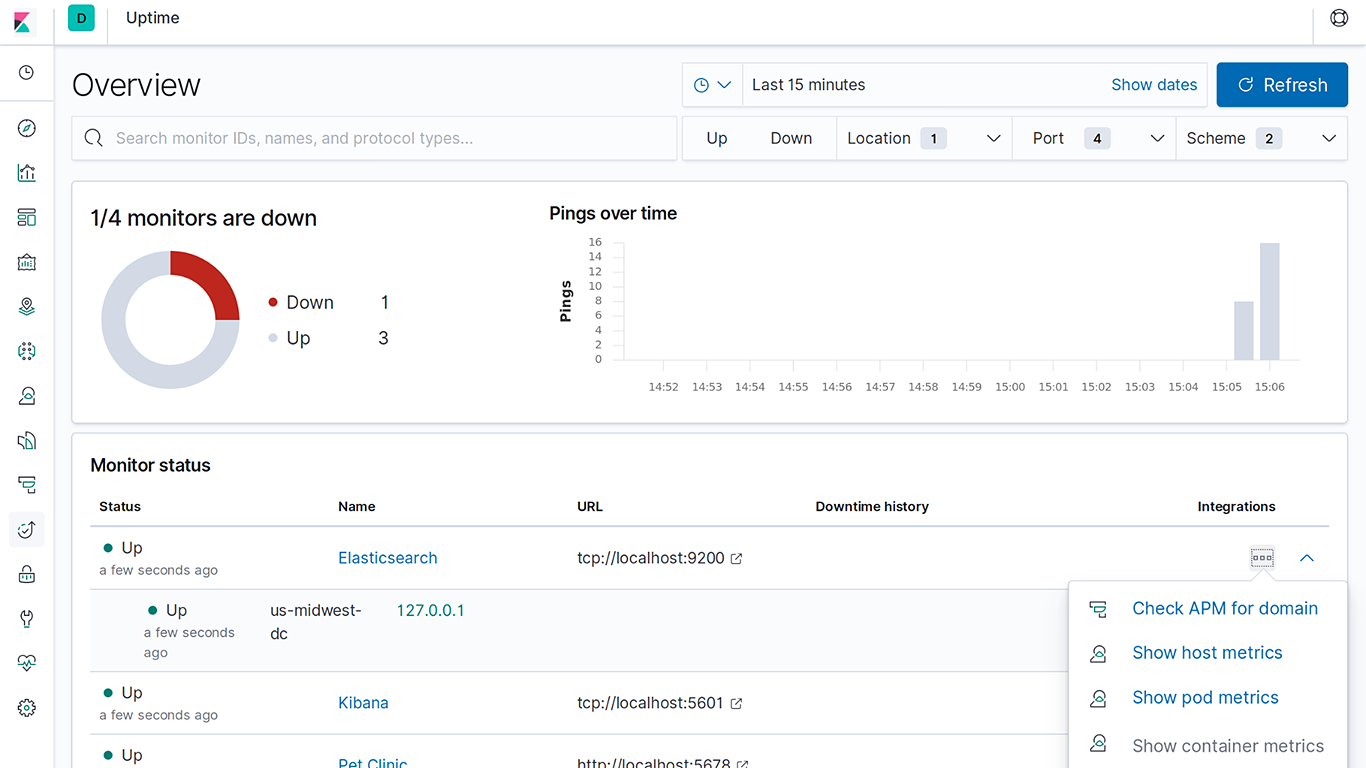
Monitoring status of Kubernetes services
Kubernetes monitoring is particularly challenging due to the dynamic nature of infrastructure and services running on it. To ensure all these services are available and responding requires really flexible configuration options. In 7.5, we’re enhancing Uptime to include hint-based auto-discovery, which is a particularly great fit for monitoring the health of Kubernetes services.
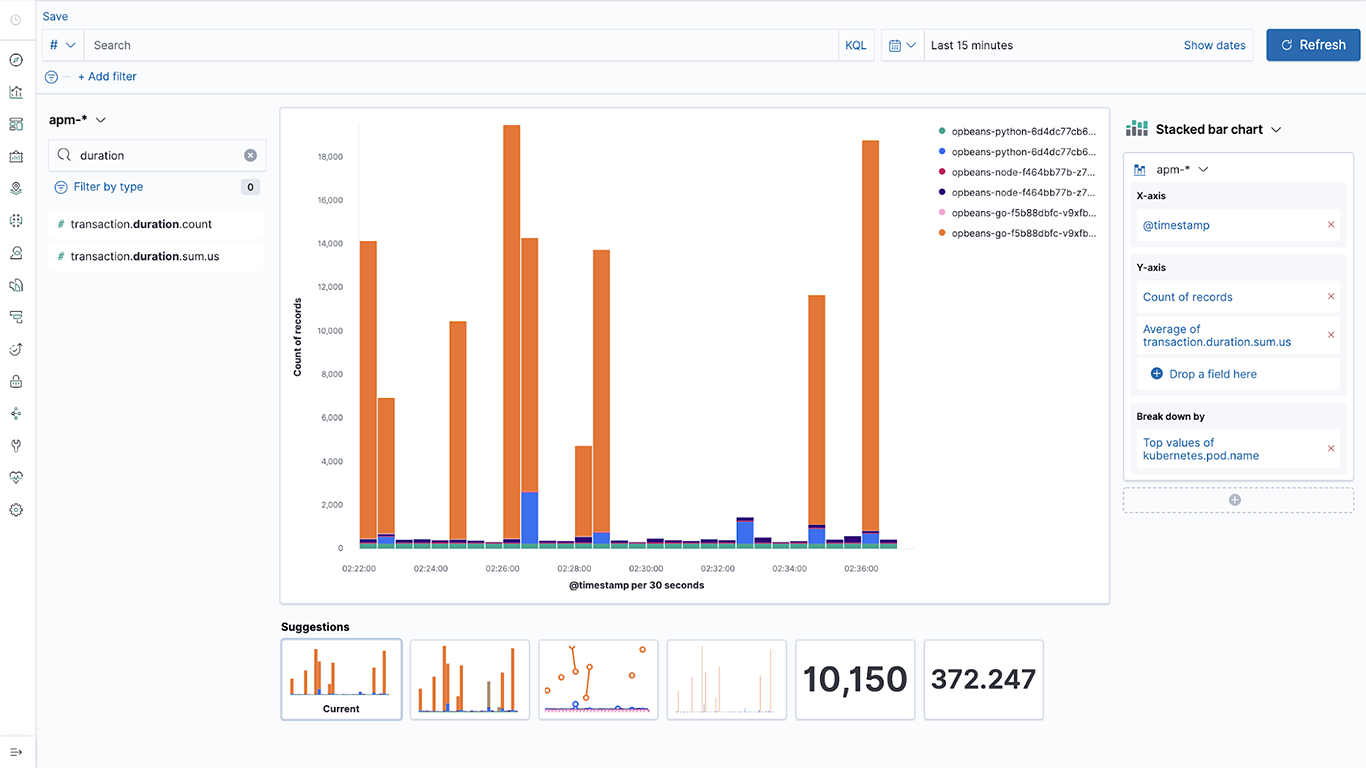
Lens: Drag-and-drop composable visualizations
Our approach to observability is based on the concept of “open data” — every data point is just another index in Elasticsearch, and users can build powerful data visualizations directly on top of this data. Kibana Lens offers a simple drag-and-drop interface to create beautiful charts on top of observability data by simply dragging fields.
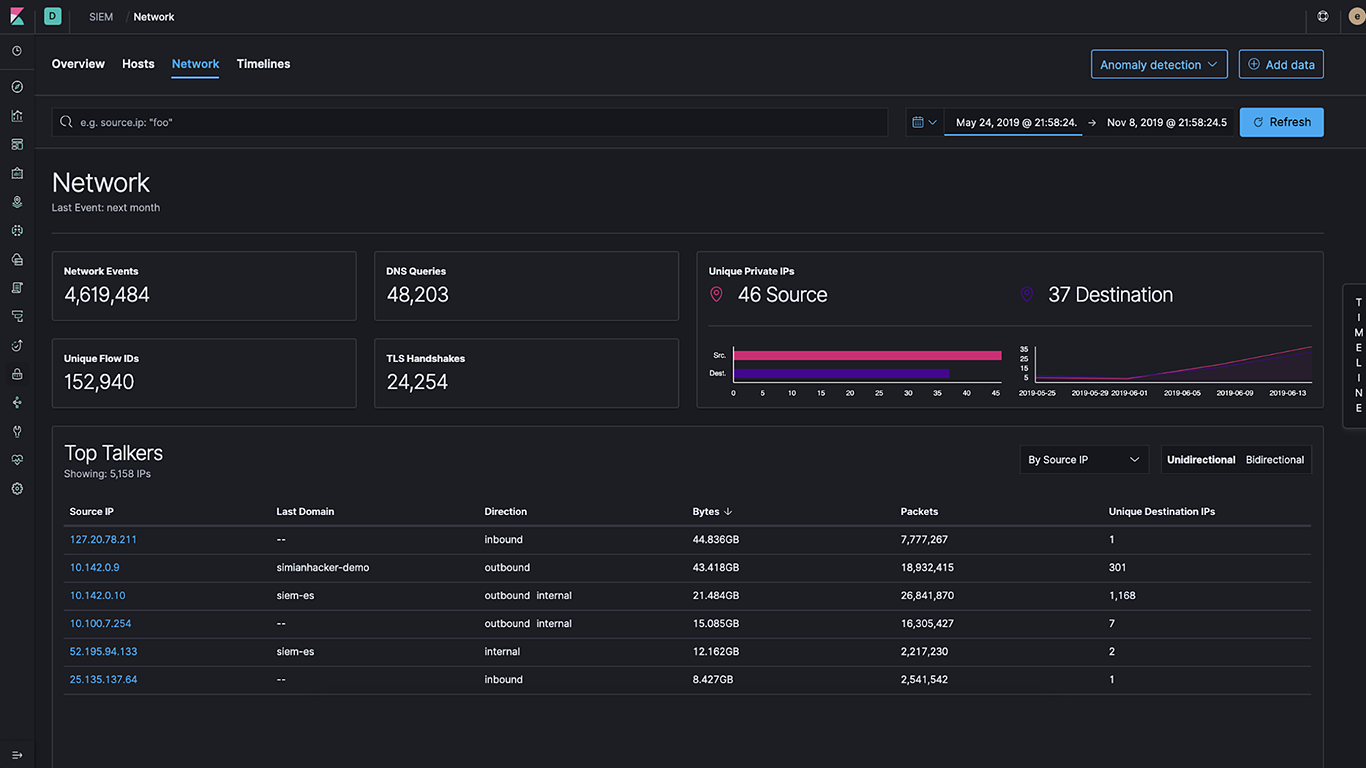
Network and security event monitoring
Since it became generally available in 7.4, the SIEM app continues to add network event monitoring capabilities. This means that every observability user can simply toggle to another tab to see their observability data through the lens of security, as well as combine it with sophisticated network analytics.
Get started today
Want to give Elastic Observability a spin? Check out our latest version with a free 14-day trial of our Elasticsearch Service on Elastic Cloud or install the latest version of the Elastic Stack.
Related blogs: