A Preview of SQL in Canvas with Rashid, Creator of Kibana
This post is part of the Elastic{ON} 2018 blog series where we recap specific demos and related deep-dive sessions from the conference. From machine learning forecasting to APM to security analytics with Mr. Robot — check out the list at the bottom of this post.
Rashid Khan, creator of Kibana, gives us a preview of Canvas. This tool allows users to create custom, infographic-inspired visualizations. Using a demo that tracks the performance of slot cars on a racetrack at Elastic{ON} 2018, he gives us a peek into what’s possible using SQL in Canvas.
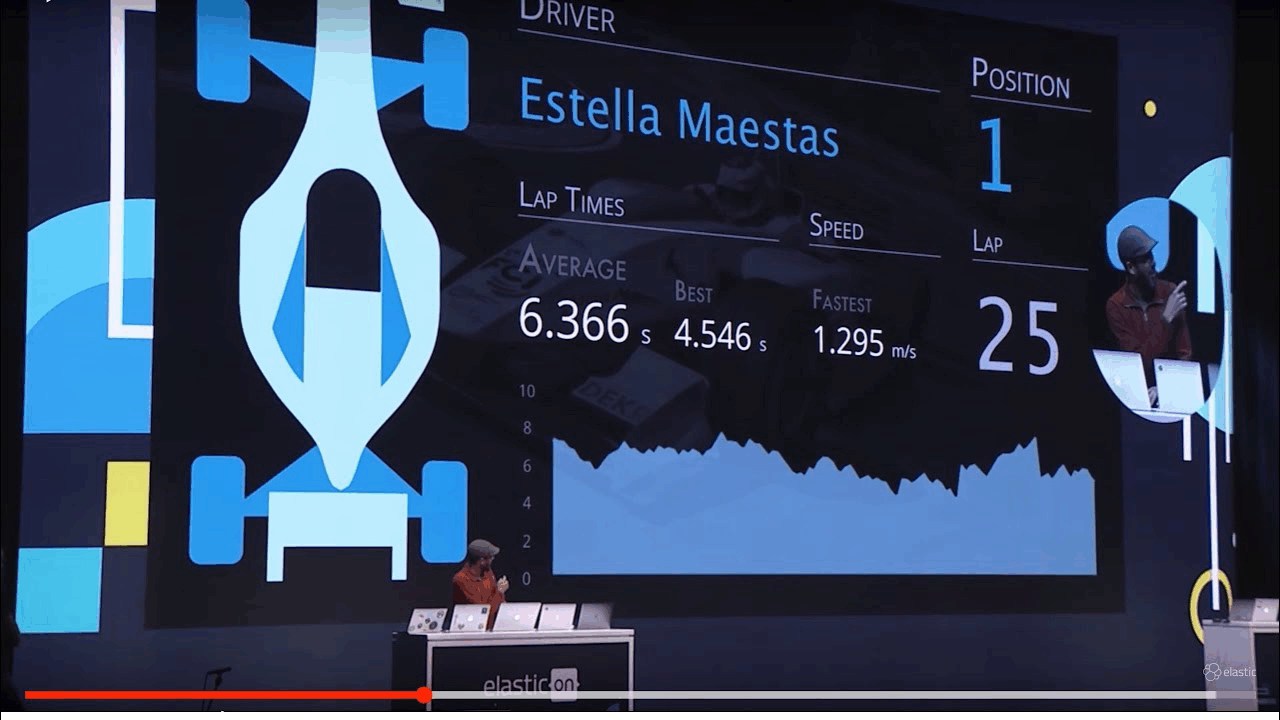
Canvas is a composable, flexible, creative space for live data. It’s an expressive way of visualizing data—worthy of being displayed in team presentations and on the big screen of your office. Elements can be connected to data and configured with a simple UI where you can play with palettes, fonts, backgrounds, and more. In his demo, Rashid Khan created beautiful, custom charts and graphs with simple one-liners using SQL. Streaming data into Elasticsearch from the slot car track at the conference, he demonstrated how to assign values to the x-axis, y-axis, and the size of the points on the chart.
Typing directly into the editor in Canvas, he tracked the performance of the slot car drivers from a few different perspectives. First, he showed us which drivers were going the fastest. On the big screen we watched the chart populate with data that was simple to parse and would be impressive to highlight in corporate presentations. Bright bubbles popped up to denote the maximum speed of each driver. As he changed the SQL and Canvas expression, the chart shifted to instead show how quickly the drivers got around the track. A strong trend line formed with color gradients representing each driver’s performance. Interestingly enough, maximum speed wasn’t always tied to completing the track the fastest. It’s a good reminder, Rashid noted, that balancing pace with speed is important.
Are you ready to go beyond the preview and see how everything works behind the curtains? Dive into the nitty gritty details of building visualizations in Canvas. Watch Rashid go from concept to creation with the Canvas expression language and UI in this demo-driven session. There’s a lot more happening in the world of visualization. Check out what’s coming next in Kibana including accessibility improvements, even more UIs, and a streamlined approach to deploying solutions for use cases such as logging and, metrics, and more. And don’t miss how geo is starting taking shape in Elasticsearch and Kibana.
See what else we covered during the conference in these recaps:
- Geo Roadmap for Elasticsearch and Kibana: Layers, GeoJSON, Vega
- But First, Coffee - An Elastic{ON} Canvas Story
- How Mr. Robot's Technical Consultant Used Kibana in the Show
- Operational Data Analysis with the Elastic Stack
- Monitor Kubernetes with Beats Autodiscover Feature
- Here to Help - An Elastic{ON} Canvas Story
- Data Rollups in Elasticsearch
- App Search with Elasticsearch
- Using Kibana and Beats for Security Analytics
- Machine Learning Forecasting on Elasticsearch Data
- APM for the Elastic Stack - A Recap
- Machine Learning, Logging, and More on Hosted Elasticsearch