Monitoring Microsoft SQL Server using Metricbeat and Elasticsearch
We are pleased to introduce support for Microsoft SQL Server as part of our generally available Metricbeat modules to capture database metrics. Microsoft SQL Server has been a popular and successful SQL database over the years, and we are really excited about this new addition to the Metricbeat family.
Two metricsets are launching as beta with Metricbeat 7.0: performance and transaction_log. In addition, a curated dashboard was also developed to help navigate Microsoft SQL Server metrics in Kibana.
Performance metric set
The first thing that any user will want to look at is, as you have probably guessed, performance. It is very important is track the number of transactions, connected users, and cache hits, and all of this is included in this metricset. These metrics are retrieved from Performance Counters in Microsoft SQL Server
user_connections: Total number of user connectionslogins_per_sec: Total number of logins started per secondconnections_reset_per_sec: Total number of logins started from the connection pooltransactions: Total number of transactionsbatch_requests_per_sec: Number of Transact-SQL command batches received per secondbuffer.cache_hit.pct: The ratio of total number of cache hits divided by the total number of cache lookups over the last few thousand page accesses. After a long period of time, this ratio moves very little. Because reading from the cache is much less expensive than reading from disk, you’ll want this ratio to be high.compilations_per_sec: Number of SQL compilations per second. This indicates the number of times the compile code path is entered. This includes compiles caused by statement-level recompilations in SQL Server. After SQL Server user activity is stable, this value reaches a steady state.
Transaction Log metric set
This is another key metricset to include in your monitoring, because it helps you understand the shape and size of the server log. Some of the key metrics included here are:
space_usage: This shows space usage information about the transaction log, a key metric to understand the performance of a Microsoft SQL Server. It also shows the time passed since the last backup of the log, useful for disaster recoverystats: This returns summary level attributes and information on transaction log files of databases. Use this information for monitoring and diagnostics of transaction log health. Here you can see active size, total size, or backup time for example.
Getting started with SQL Server monitoring using Metricbeat
The easiest way to configure this module can be found on the "Add Data UI" screen in Kibana. This UI is a Basic feature, which means it's part of the free, default distribution of Kibana.
Here you will find instructions to set up the module as shown on the following screen:
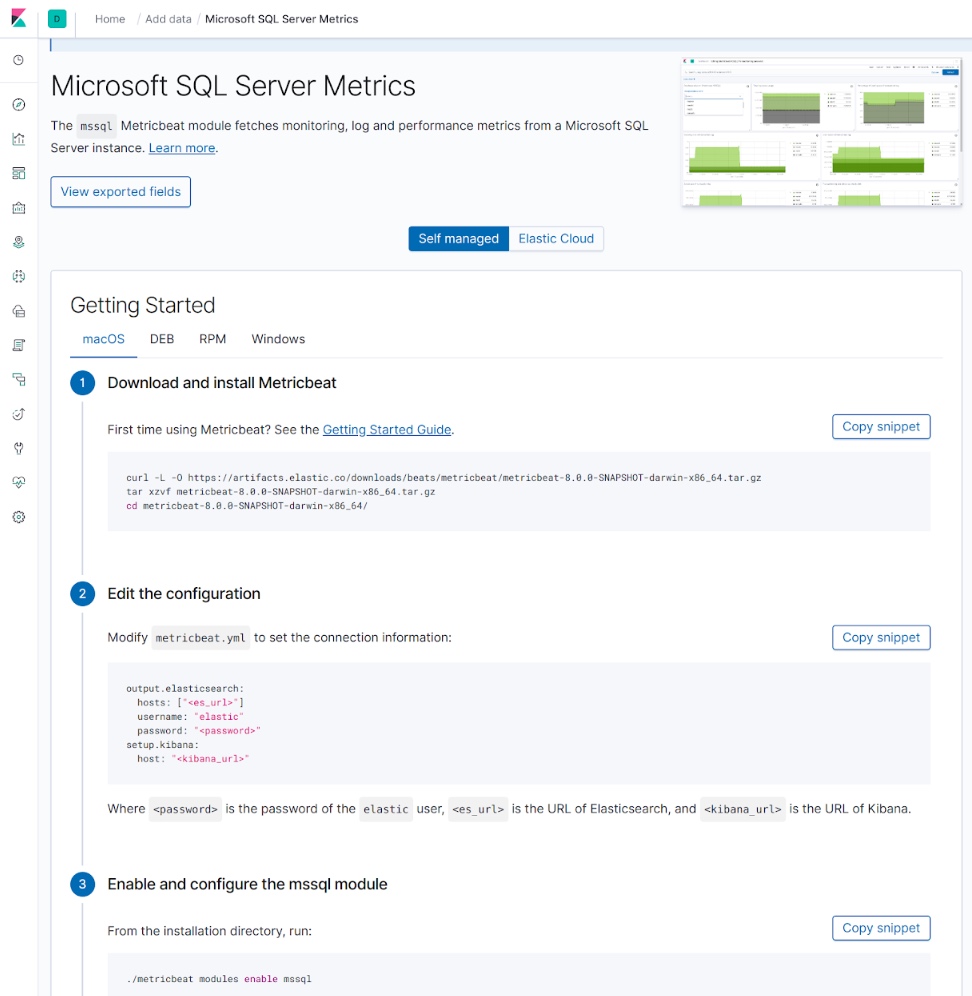
Following the instructions, you will see how easy it is to activate the Microsoft SQL Server Metricbeat module by setting up the addresses of the SQL Servers, filling username and password, and enabling the module. Once enabled, you can start Metricbeat and set up the dashboards:
./metricbeat modules enable mssql
./metricbeat -E setup.dashboards.enabled=true -e
Microsoft SQL Server dashboards
Two curated dashboards are included with the module — one for the Transaction Log, and the other for the Performance metricset. In the following screenshot you can see the "Transaction Log" dashboard.
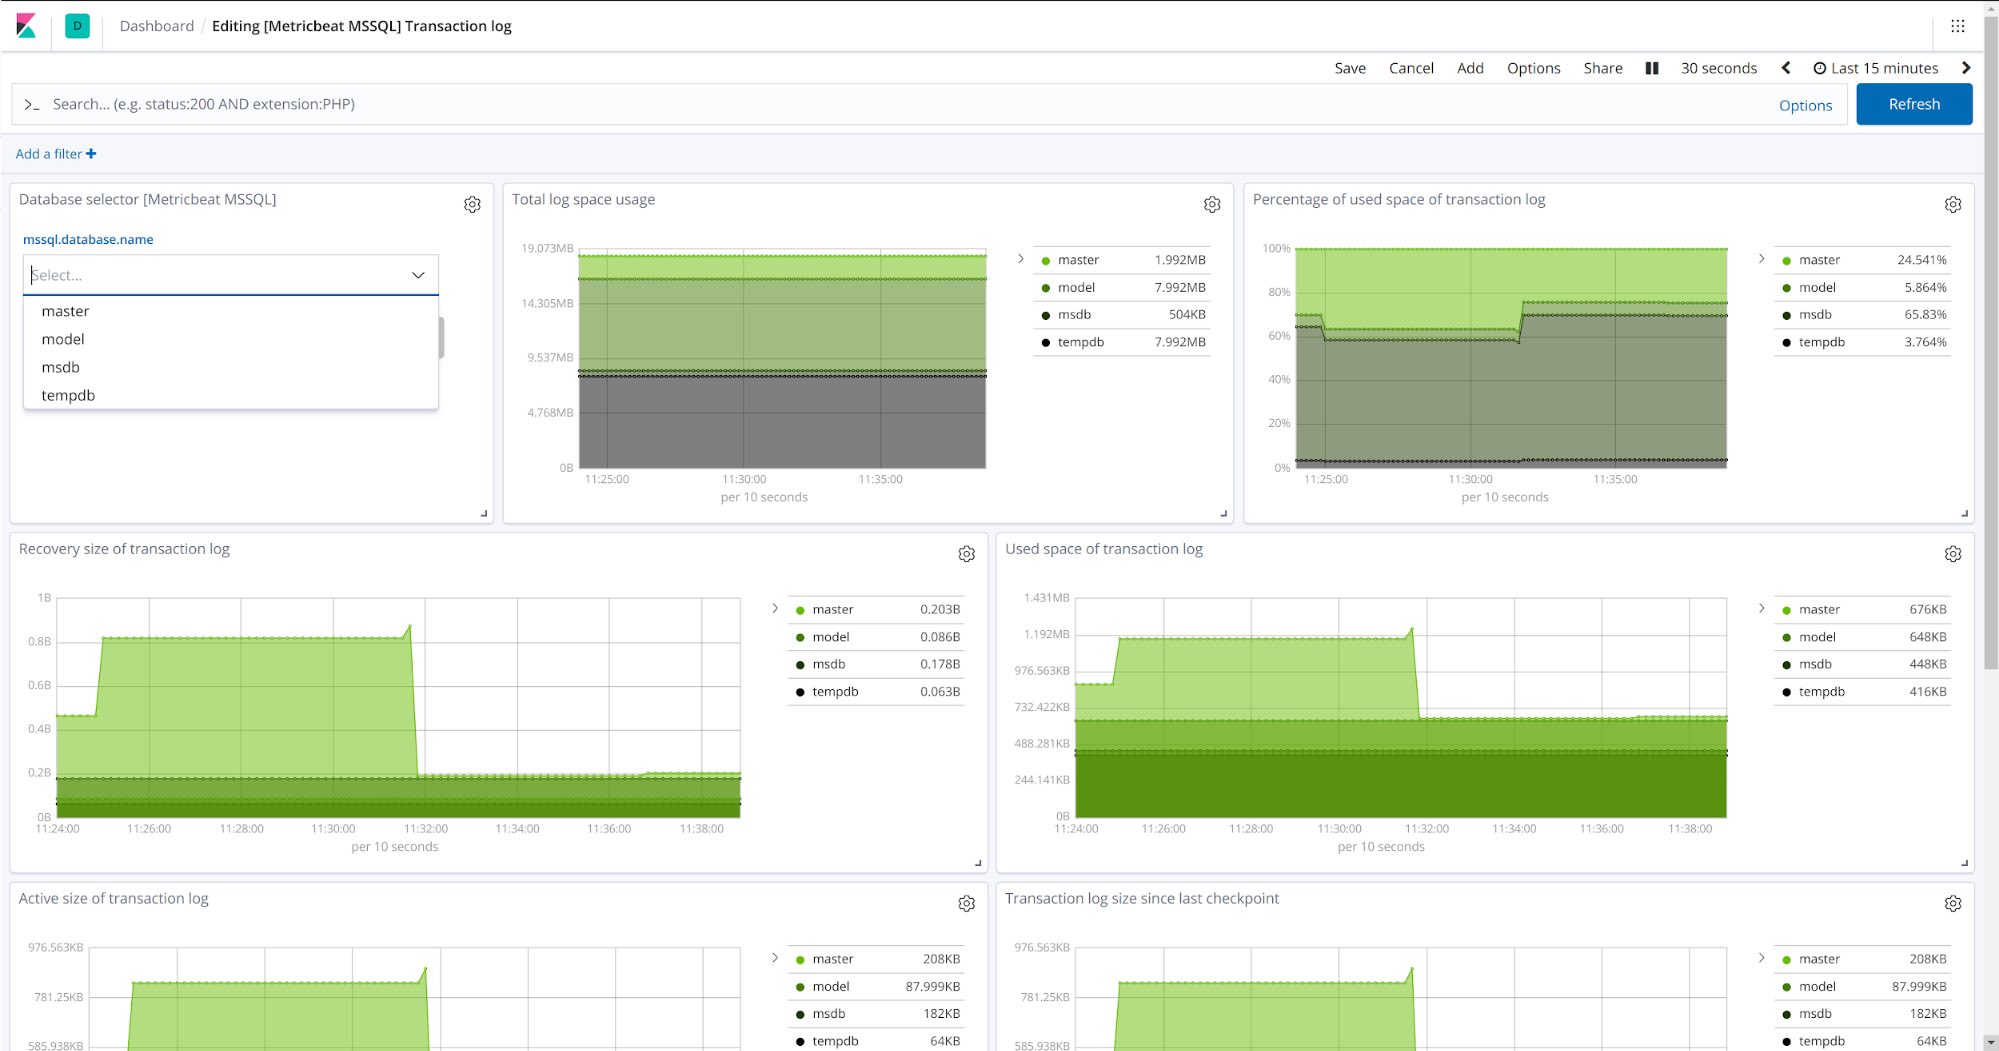
As shown in the screenshot, you can also select a specific database in the server to see a detailed view of it as well as comparing them in a single View.
Try it out today
Deploy a cluster on our Elasticsearch Service or download the stack, spin up the new Metricbeat module (you can also add more modules from the list of supported modules), open the curated dashboards in Kibana and start monitoring your Microsoft SQL Server today!