Challenges of observing Kubernetes: Understanding a complex and dynamic system

 Share on Twitter
Share on Twitter

 Share on LinkedIn
Share on LinkedIn

 Share on Facebook
Share on Facebook

 Share by Email
Share by Email

 Print this page
Print
As technology evolves in the enterprise, oftentimes the processes and tools used to manage it must also evolve. The increased adoption of Kubernetes has become a major inflection point for those of us in the monitoring and management side of the IT operations world. What has worked for decades (traditional infrastructure monitoring) has to be adjusted to the complexity and ephemeral nature of modern distributed systems where Kubernetes has a prime role.
In my first blog, The basics of observing Kubernetes: A bird-watcher’s perspective, we provided an overview of Kubernetes components and the signals you have to pay attention to. But let’s dig in deeper because the strategies of traditional monitoring need to really be adjusted in the world of cloud computing.
Challenges for modern Kubernetes monitoring and management
When you look at traditional IT operations monitoring, tools are built to monitor static entities and infrastructure for known signals commonly referred to as the three pillars (logs, metrics, and traces), collecting these signals regularly from a number of manageable hosts deploying monolithic applications. In today’s cloud-native world, the equivalent applications have been atomized into containerized microservices and distributed across platforms like Kubernetes for very real reasons. With the ability to scale and self-managing resiliency, Kubernetes is a key technology and architectural choice for today’s modern apps.

The strength of running key applications in Kubernetes is that its resource-based modeling is very flexible. It’s a declarative approach and not a list of imperative commands. You define a Kubernetes pod wrapping containers with specific characteristics and create a manifest, and one of the controllers in Kubernetes spins up a pod with those characteristics. Details of what needs to be done to get to the pod in its final form are not left to the user — Kubernetes handles the imperative tasks. Resources are managed through the Kubernetes API, always following a desire-intent versus reality comparison model, where Kubernetes constantly checks to make sure resources available match what is desired.
But those same strengths in running applications on Kubernetes can be a huge hurdle when monitoring these same deployments. Let’s have a look at some of the most prominent challenges.
Dynamic and ephemeral environment
In Kubernetes, infrastructure is defined and immutable. If there is an issue with a pod wrongly configured or something needs to be upgraded, there is no straightforward way to upgrade the existing pod; it is recommended to just deploy a new pod with a new name. The same goes for containers inside the pod. These get restarted as needed, making the performance of the infrastructure supporting your applications challenging to track and even harder to troubleshoot.

A new meaning for scale
The explosion of microservices has given scale a new meaning. While having 20,000 physical servers or virtual machines (VMs) was reserved for the enterprise end of the scale in traditional production environments, 30,000 pods can be easily deployed and orchestrated in the Kubernetes world by one person using a single cluster. Theoretically, the upper limit for Kubernetes clusters would be around 150,000 pods.
A single pod can easily expose 25 different metrics, and each container can add an additional 20 metrics. If you multiply these figures by 30,000, it can give you an idea of the volume of signals that could be generated at a single point in time.
Furthermore, multiply the resulting numbers above by a standard scraping frequency of 10 seconds to understand the magnitude of data sets that need to be handled for ingestion, storage, and analysis of Kubernetes observability data.
Distributed nature of Kubernetes components
Kubernetes is a distributed system composed of different components running across multiple nodes (physical or virtual machines). While many of them are accessible through the Kubernetes api-server, there is no correlation of all the signals that are exposed and this task is left down to the observer.
The metrics and signals provided by the Kubernetes API is raw and does not easily give you insights. Another layer of analysis is needed to transform the data into visualizations with Kubernetes-centric dashboards and log analysis tools that can find patterns and understand trends. One potential solution would be to leverage machine learning for meaningful correlation and easier troubleshooting.

Distributed nature of Kubernetes monitoring data
Having the right context, in the right time and the right place, is key for being able to reduce the time to detect and resolve issues. The challenge is that this information is spread across vertical silos (e.g., GitHub, a logs collection focused tool, a metrics monitoring focused tool, an APM solution), making it difficult and time consuming for SREs to form a picture broad enough to understand what is happening and what needs to be done about it. Once again, given the volume of signals and distributed monitoring data, a platform that is able to consolidate all of this Kubernetes telemetry data is an ideal solution.
Understanding Kubernetes signals
One of the biggest challenges organizations have around Kubernetes is the lack of expertise on how it really works under the hood. Acquiring and showing signals is not enough, and while understanding Kubernetes in detail is an option, one could argue that Kubernetes monitoring solutions need to bear the brunt of correlating seemingly disparate signals, providing users with answers and not just raw data. Kubernetes’ ability to run and resolve many performance issues (self-managing) means that when manual intervention and investigation is needed for more advanced problems, it can be a challenge for administrators.
The rise of managed Kubernetes and different management models
The complexity of operating and maintaining the components that make Kubernetes appealing has paved the way for the rise of managed Kubernetes offerings across the most popular cloud providers (AWS, Azure, GCP) or other on-premises alternatives for self-management (Openshift, Tanzu).
And while at the core, the Kubernetes code used in most of these instances is what you could get directly from the Kubernetes project, the implementation varies across cloud providers — some allow more access to components and configuration of your Kubernetes clusters, while others limit your access to provide a more managed experience.
AWS — most specifically EKS — allows you more access and custom configuration of your clusters, which requires more seasoned Kubernetes teams. Azure and GKE provide a more managed experience with more automation, reducing the need for Kubernetes expertise. This means that where and how you deploy Kubernetes will directly impact how you manage and what you monitor on your deployments for observability.
Kubernetes observability requires a different approach
Generates insights through the noise

In the traditional physical server or virtual machine world, a pet approach is possible, but in Kubernetes, pods are the most granular entities, usually hosting a container. They need to be treated as cattle given they are low-level resources that can die off and be replenished as needed. More attention may be needed if certain deployments of pods are problematic beyond the self-healing capabilities that Kubernetes can provide.
Kubernetes events (structured logs) are often a key signal that tells you when a resource has changed status. Typical events will show up as Normal, Warning, or Errors and depending on the frequency and severity of these Kubernetes events, you’ll then need to dive in and manually troubleshoot further, identifying correlated components that may give you a clue as to what the problem is. So while your application deployed on Kubernetes may still be running, its performance is degraded and requires your attention.
Does not require you to be a Kubernetes expert
The recent rise of tools like ChatGPT have shown us that knowledge can be used in ways that are more aligned with a user’s end goal than with the instructions on how to get there.
Tools built to monitor your Kubernetes ecosystem should not expect you to be someone who knows the following things about a CrashLoopBackOff:
- It is a pod status error, meaning that a container keeps crashing when restarted
- Requesting the pod logs via kubectl log POD can help you understand what happened before
- Checking the exit code for crashed container kubectl describe POD
- If the exit code is 1, the container crashed because the application crashed.
- If the exit code is 0, verify for how long your app was running.
Even if you did know the above, just having to perform the actions yourself over having the solution serve that context is probably a better way. Solutions that are built on a repository of knowledge of Kubernetes infrastructure common issues, offer Kubernetes expertise within the UI, and support root cause analysis would be extremely valuable for less experienced Kubernetes administrators. Any issues that required human attention could present users with potential solutions (known context we have for their situation) to reduce MTTD and MTTR.
Elastic Observability and our approach to Kubernetes monitoring
As you can see, Kubernetes observability poses some interesting challenges to users and operators. Let’s take a look at how Elastic Observability can help you with your Kubernetes monitoring in real life.
In the examples below, we ran a variant of the popular Hipster Shop demo app on GKE and deployed Elastic Agents with Kubernetes integration as a DaemonSet on the same GKE cluster. Upon deployment of Elastic agent, Elastic starts ingesting metrics from the Kubernetes cluster (specifically from kube-state-metrics) and additionally, Elastic will pull container and audit logs from the cluster.
Kubernetes logs on Elastic Observability
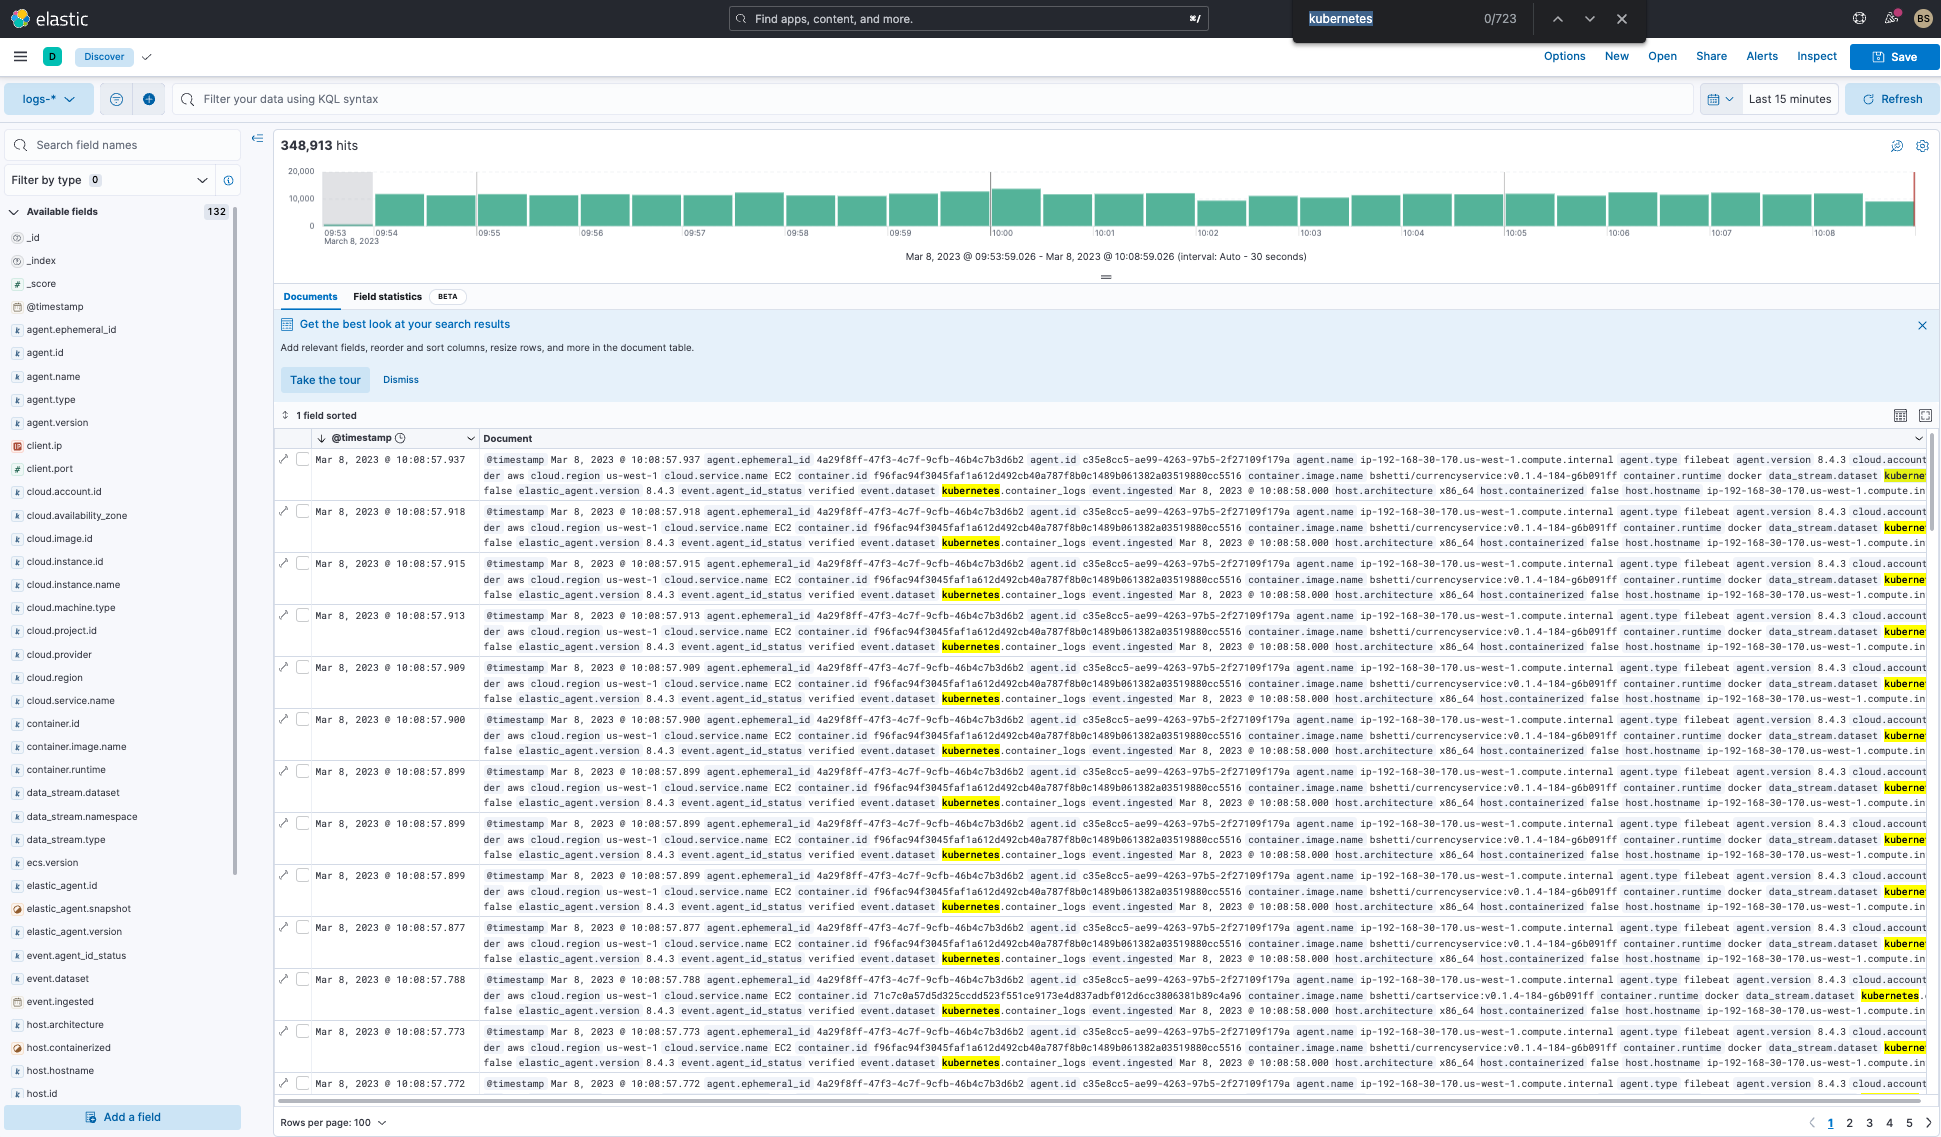
Kubernetes logs can be searched and analyzed in Elastic’s Discover capability. Here we see how Kubernetes logs can be searched, reviewed, and analyzed. You can run more specific searches with filters if you are familiar with the specific data stream and fields that are being ingested into Elasticsearch from your Kubernetes cluster. Or you can just do a plain-text search.
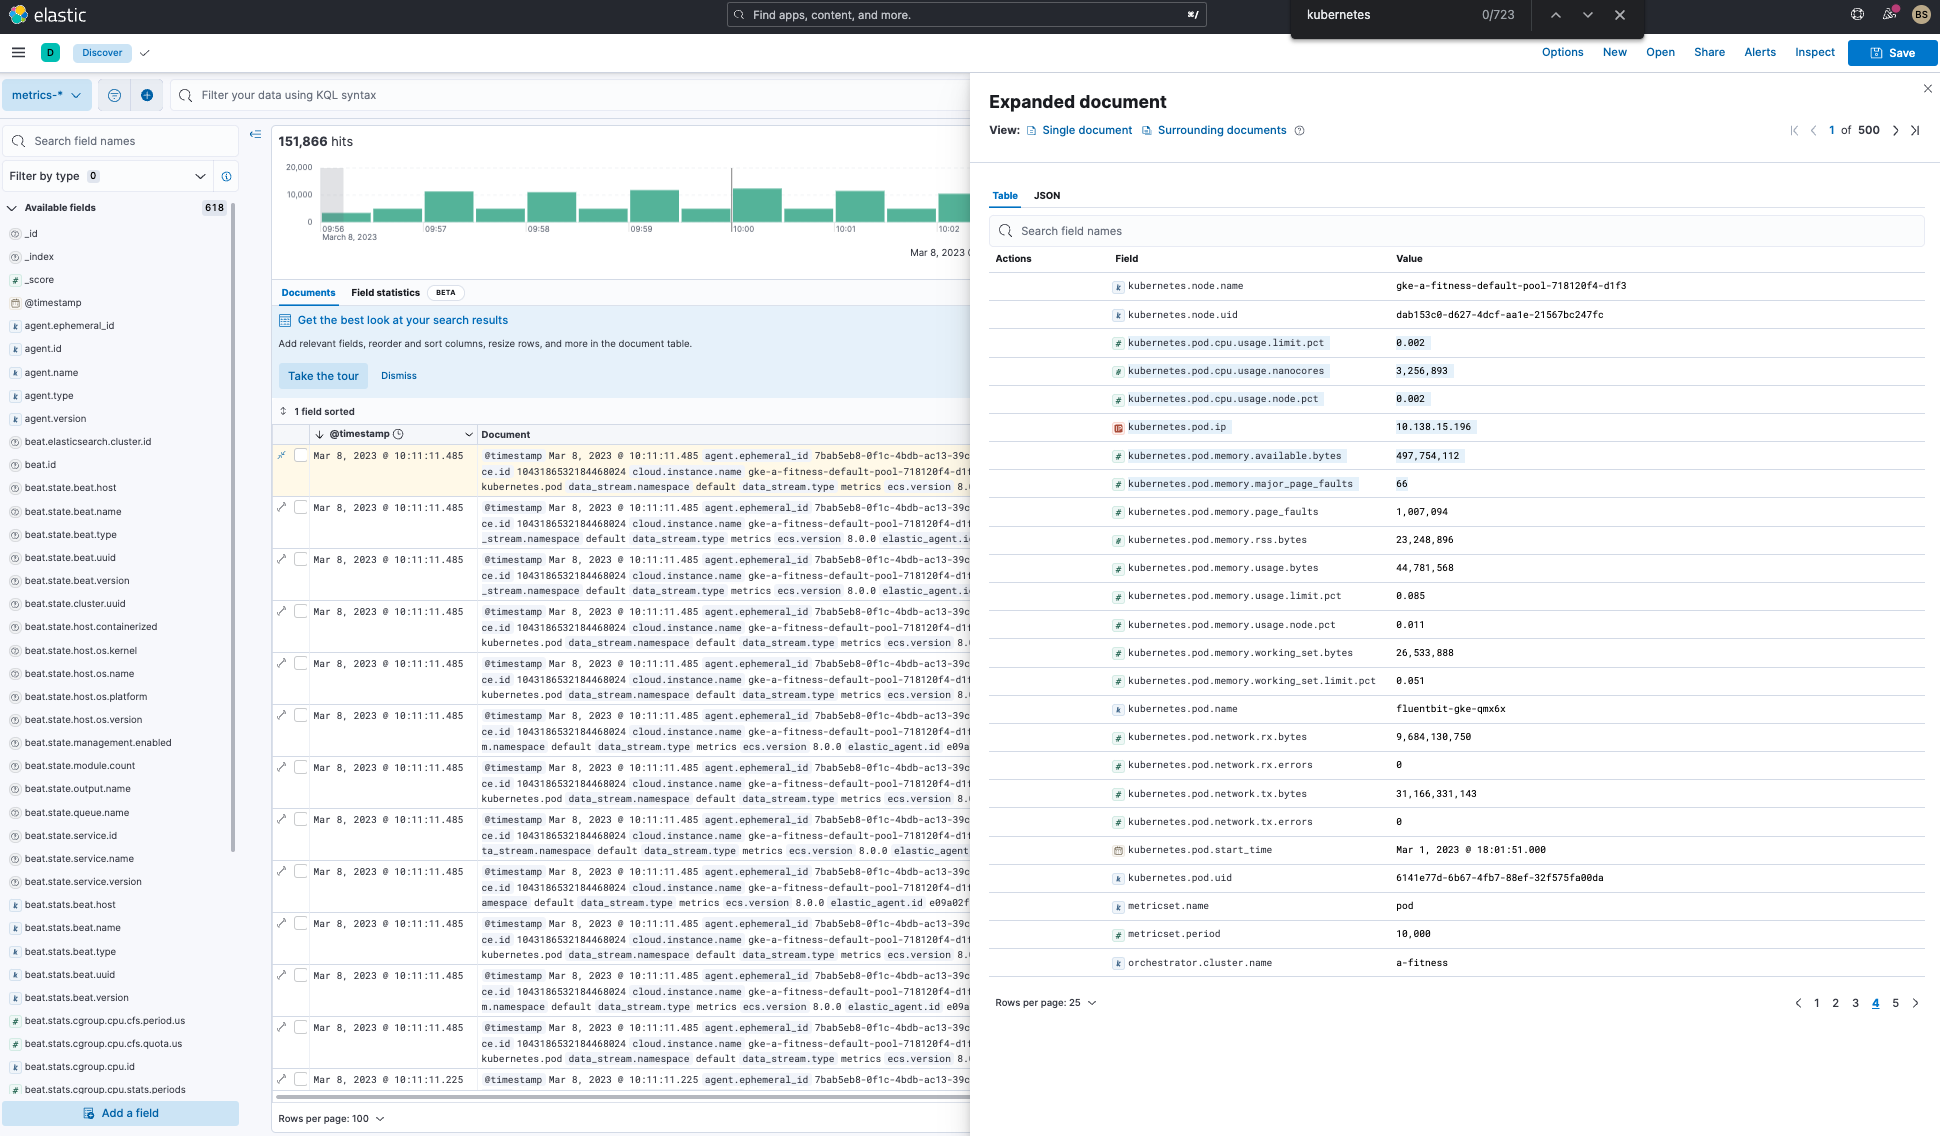
Additionally, you have the same search capabilities with metrics in Discover:
Kubernetes visualizations and dashboards on Elastic Observability
Here are a few Kubernetes dashboards that are available out of the box (OOTB) on Elastic Observability. You can customize them or create your own.
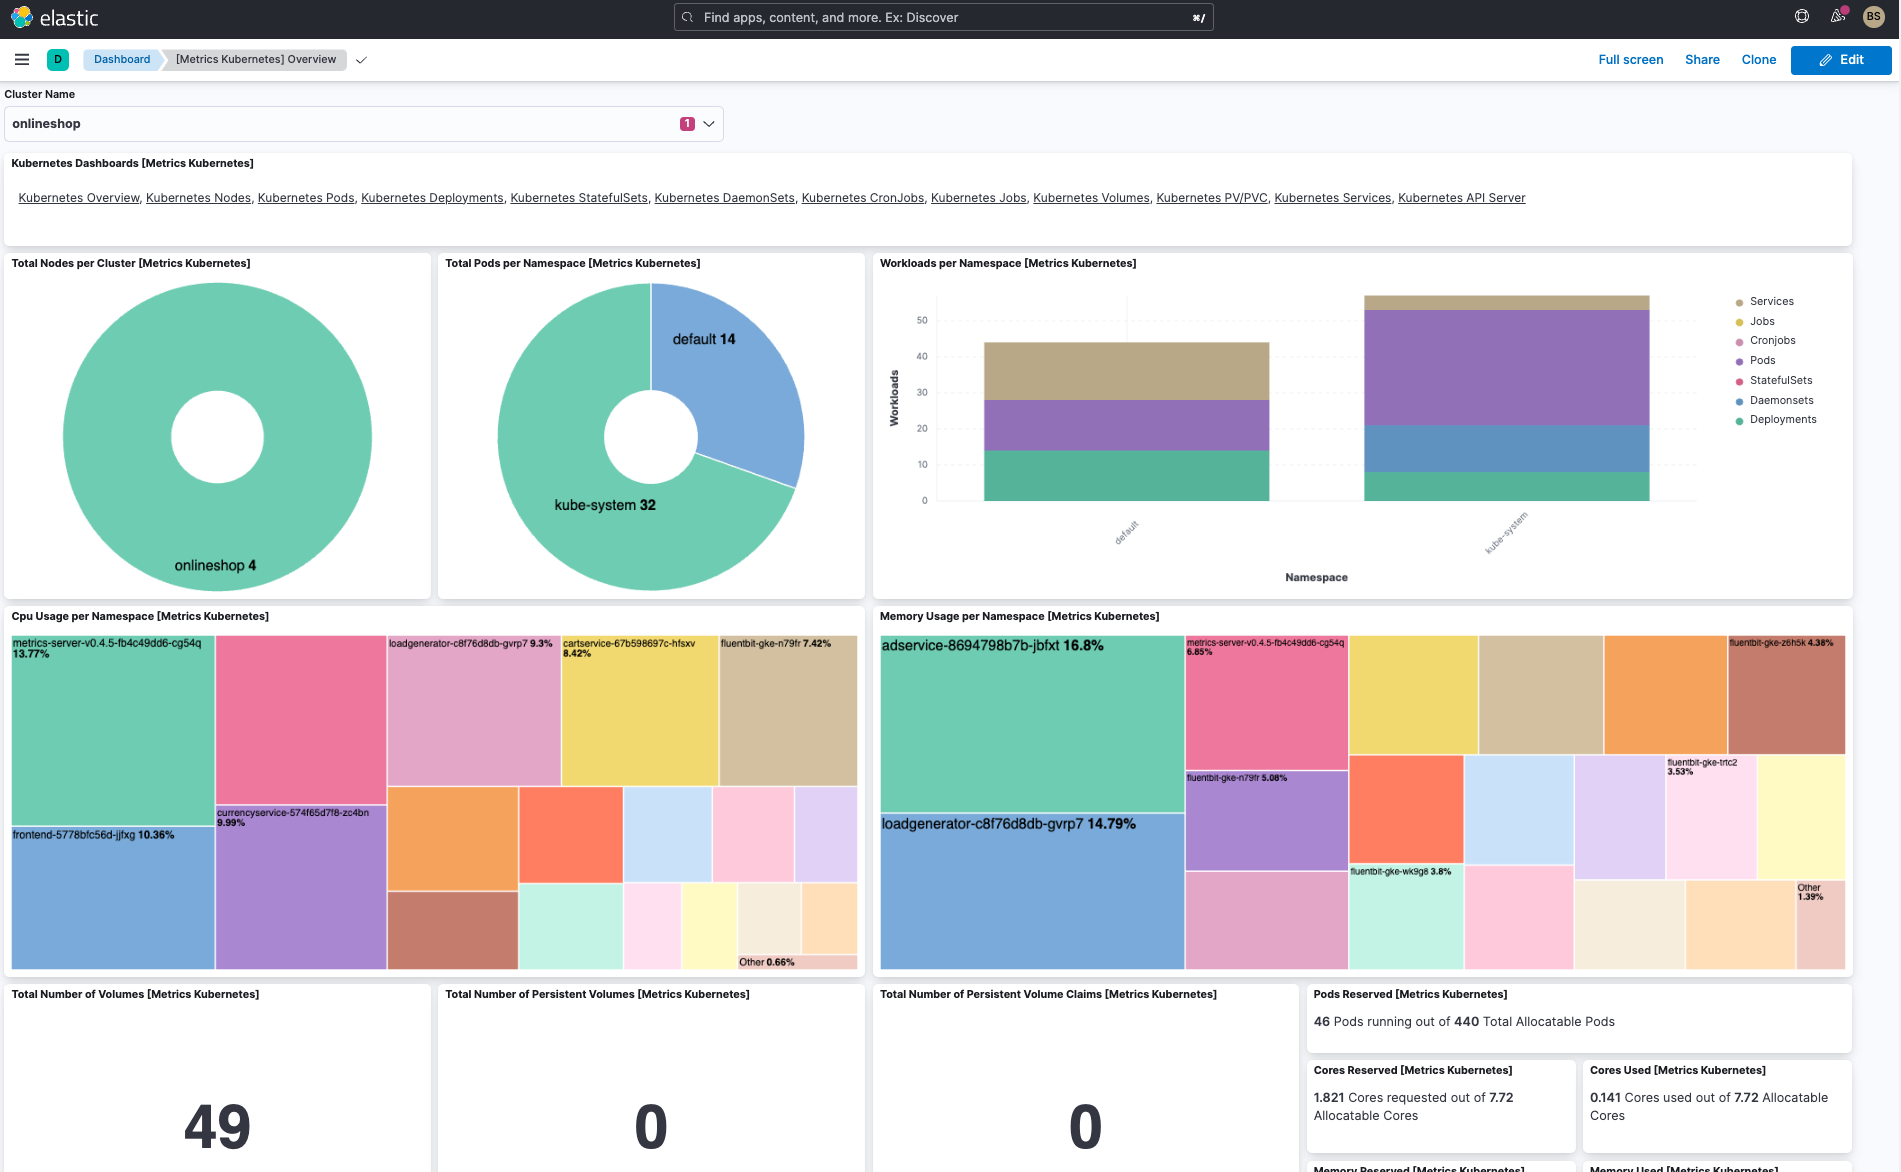
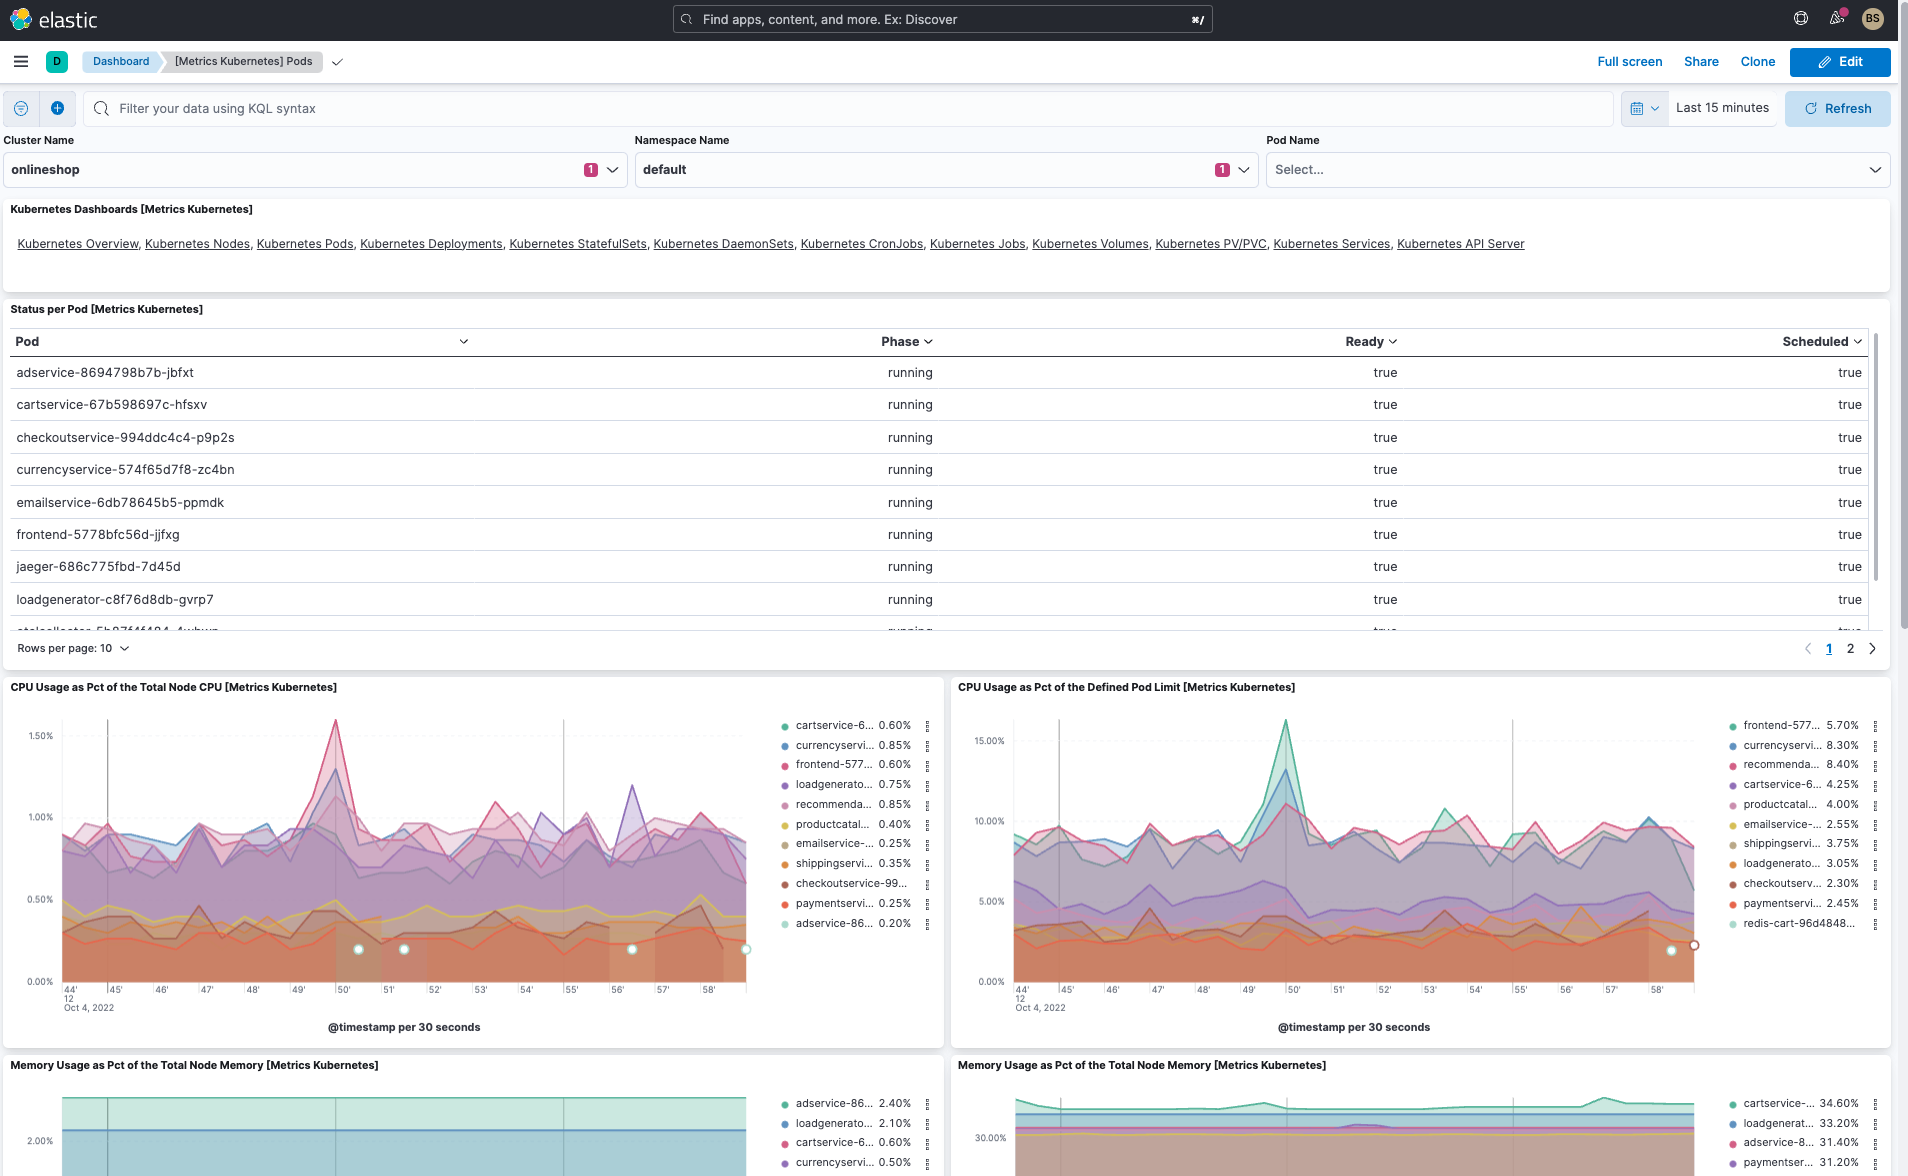
In addition to the cluster overview dashboard and pod dashboard, Elastic has several useful OOTB dashboards:
- Kubernetes overview dashboard (see above)
- Kubernetes pod dashboard (see above)
- Kubernetes nodes dashboard
- Kubernetes deployments dashboard
- Kubernetes DaemonSets dashboard
- Kubernetes StatefulSets dashboards
- Kubernetes CronJob & Jobs dashboards
- Kubernetes services dashboards
- More being added regularly
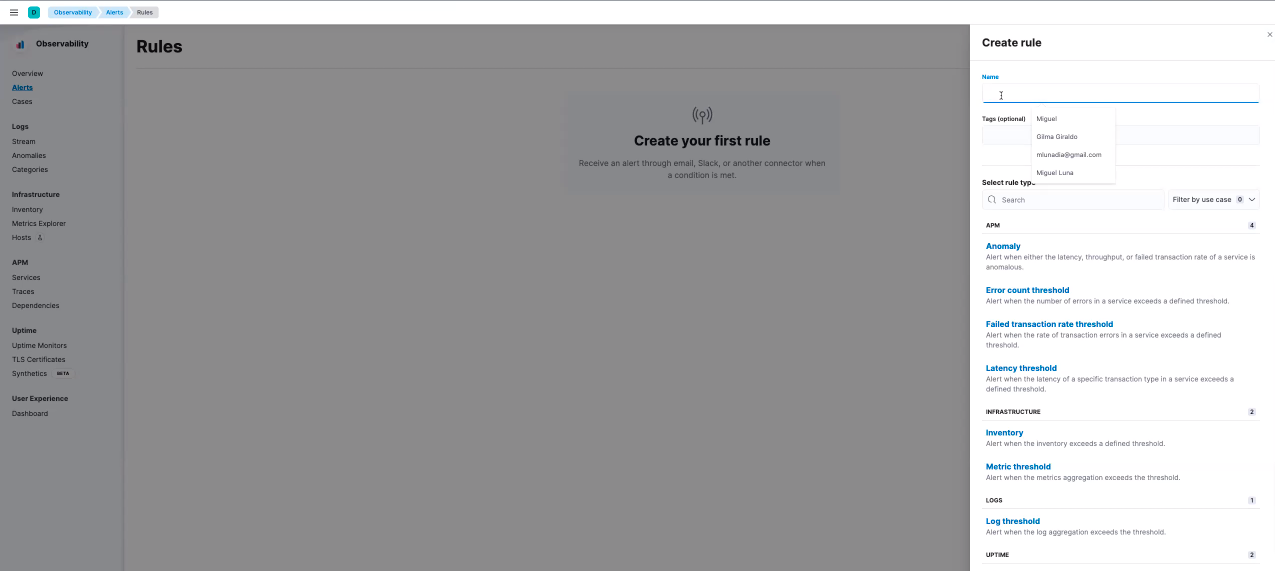
Kubernetes alerts on Elastic Observability
For observability practitioners whose goal is to keep Kubernetes up and running at all times, such as an SRE or a CloudOps professional, being stuck to a dashboard with the hope of looking at the right thing at the right time is not a feasible option. Many common use cases can be covered by implementing rules that will trigger informative alerts.
For example, set up an automated rule that will send a Slack message whenever a container is restarted or a pod goes into CrashLoopBackOff mode.
Get the full details on how to set up Kubernetes monitoring on Elastic Observability in our recent blog: Managing your Kubernetes cluster with Elastic Observability.
Conclusion
Cloud-native technologies are evolving quickly, and Kubernetes continues to be adopted at a furious pace by organizations. Nevertheless, most folks are just getting started, some are in the middle of the journey, and very few are experts.
This requires observability tools that allow for knowledge to be passed on throughout the organization by those few experts — or better yet, the solution itself would have it baked in, enabling a wider group to perform at the level of the best Kubernetes SREs without having the same level of knowledge.
This crucially important knowledge sharing is something that traditional monitoring tools with limited flexibility cannot cater for with the siloed and niched approach to signals where logs, metrics, and traces are tended for as isolated signals hidden behind proprietary UIs and APIs.
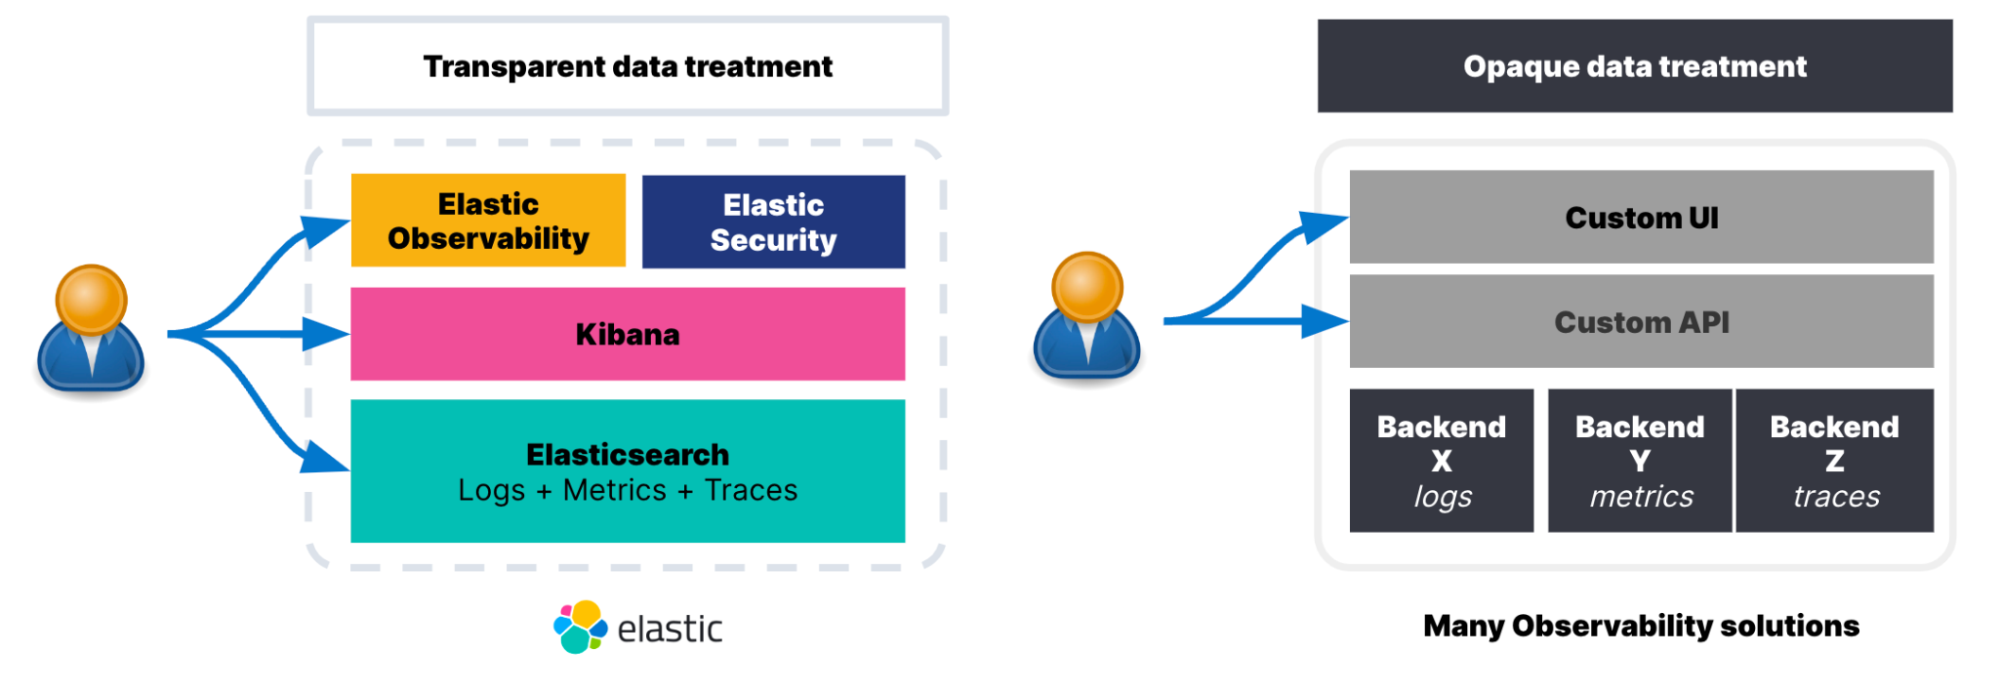
The transparent treatment Elastic Observability gives to data is your best ally, as it will enable you to address a variety of needs from different teams that use Elastic and abstract complexity as needed by setting up simple monitoring alerts or more advanced analysis using our powerful machine learning. Learn more about what Elastic Observability can do for you or take a test drive.
*Source: https://www.pexels.com/
Share
- Share on Twitter
Share on Twitter
- Share on LinkedIn
Share on LinkedIn
- Share on Facebook
Share on Facebook
- Share by Email
Share by Email
- Print this page
Print