How to manage Elasticsearch data across multiple indices with Filebeat, ILM, and data streams
Indices are an important part of Elasticsearch. Each index keeps your data sets separated and organized, giving you the flexibility to treat each set differently, as well as make it simple to manage data through its lifecycle. And Elastic makes it easy to take full advantage of indices by offering ingest methods and management tools to simplify the process.
In this post, we'll use Filebeat to ingest data from multiple sources into multiple indices, and then we'll use index lifecycle management (ILM) and data streams to further control that data.
What is Filebeat?
Filebeat is a lightweight shipper for logs that comes with many built-in modules for collecting, parsing, and managing data from multiple data sources to Elasticsearch seamlessly. These modules — which come with prebuilt Kibana dashboards — are available for a wide variety of systems, services, and applications.
A single Filebeat instance is versatile and can collect data from multiple data sources. It helps users save hours (if not days) of parsing, index template configuration, and data management. By default, data from all different sources is shipped to the same Elasticsearch index, letting users filter data sources with the event.module field. While this behavior makes getting started with Filebeat easier, there are multiple use cases that would benefit from storing similar data in multiple indices, like:
- Applying different data retention policies to different data sources. For example, VPC and firewall data may need to be kept for a year, while IIS data only needs to be stored in the cluster for a month.
- Making only a subset of data available to an application or dashboard. For example, security analysts may care about firewall and network data, but probably not about Redis or Kafka data.
- Easily assigning data access to users who need to access a subset of data. For example, members of the support team may only need to access IIS but not Tomcat data sets. To achieve this, the Elastic admin could look at document-level security, but this approach is more complex and has more room for human error.
Separating data with index lifecycle management and data streams
All of the use cases above suggest that one solution is to separate the data based on the data sources or Filebeat data module. Separating is easy to do, but avoiding sharding issues is a little bit more complex. Sharding issues can be either oversharding (too many small shards) or undersharding (your shards are too big). Each of those comes with its own issues, as oversharding means every operation has to hit more shards, and undersharding can lead to availability issues.
This blog will help you separate data from Filebeat into smaller indices that are dedicated for each module, but with data streams/ILM policies set up to help you avoid sharding issues. We are also going to leverage the new Elasticsearch index template and Elasticsearch component template to help ensure that all of the new indices will inherit the proper template mappings from the default Filebeat mapping. We are also going to use data streams to ensure that our data rolls over properly.
That seems like a lot, but once it's configured, management becomes a breeze. A little work now and a lot less worry later.
Practical example: Managing multiple cloud data sources
In this example, we are going to have three types of data including Google Cloud, Microsoft Azure, and Amazon Web Services (AWS). The data sets will fall under two different data retention policies:
- Google Cloud will be kept for 30 days
- Azure and AWS will be kept for 365 days
If you don't have a cluster to follow along with, you can spin up a free trial of Elastic Cloud before starting step 1.
Step 1: Create an index lifecycle policy
First, we're going to create index lifecycle policy for each subset of data. This will create different retention policies so each index can have its own rules:
#create a policy that deletes data after days from rollover
PUT _ilm/policy/filebeat-30days
{
    "policy" : {
      "phases" : {
        "hot" : {
          "min_age" : "0ms",
          "actions" : {
            "rollover" : {
              "max_size" : "50gb",
              "max_age" : "1d"
            },
            "set_priority" : {
              "priority" : 100
            }
          }
        },
        "delete" : {
          "min_age" : "30d",
          "actions" : {
            "delete" : {
              "delete_searchable_snapshot" : true
            }
          }
        }
      }
    }
}
#create a policy that deletes data after days from rollover
PUT _ilm/policy/filebeat-365days
{
    "policy" : {
      "phases" : {
        "hot" : {
          "min_age" : "0ms",
          "actions" : {
            "rollover" : {
              "max_size" : "50gb",
              "max_age" : "1d"
            },
            "set_priority" : {
              "priority" : 100
            }
          }
        },
        "delete" : {
          "min_age" : "365d",
          "actions" : {
            "delete" : {
              "delete_searchable_snapshot" : true
            }
          }
        }
      }
    }
}
Step 2: Create a component template
Now we need to create a component template, which is a building block for constructing index templates that specify index mappings, settings, and aliases. We'll save time by creating it from the legacy template filebeat-%{agent.version}.
- Create a component template based on filebeat-7.10.1 by going to: Kibana > Stack Management > Index Management > Component templates > Create a component template.
- Copy the settings from filebeat-7.10.1 (GET _template/filebeat-7.10.1).
# need to remove  "rollover_alias": "filebeat-7.10.1" from the output
curl -XGET "https://<Elasticsearch>:<port>/_template/filebeat-7.10.1" -u elastic | jq .[].settings
- Copy the mapping from the filebeat-7.10.1 legacy template.
# need to remove  "rollover_alias": "filebeat-7.10.1" from the output
curl -XGET "https://<Elasticsearch>:<port>/_template/filebeat-7.10.1" -u elastic | jq .[].mappings
Step 3: Create index templates
Now we can use that component template to create a new index template for each data source. Let's start with the Google Cloud template.
- Go to Kibana > Stack Management > Index Management > Index Templates > Create template
- Make sure Data stream is enabled.
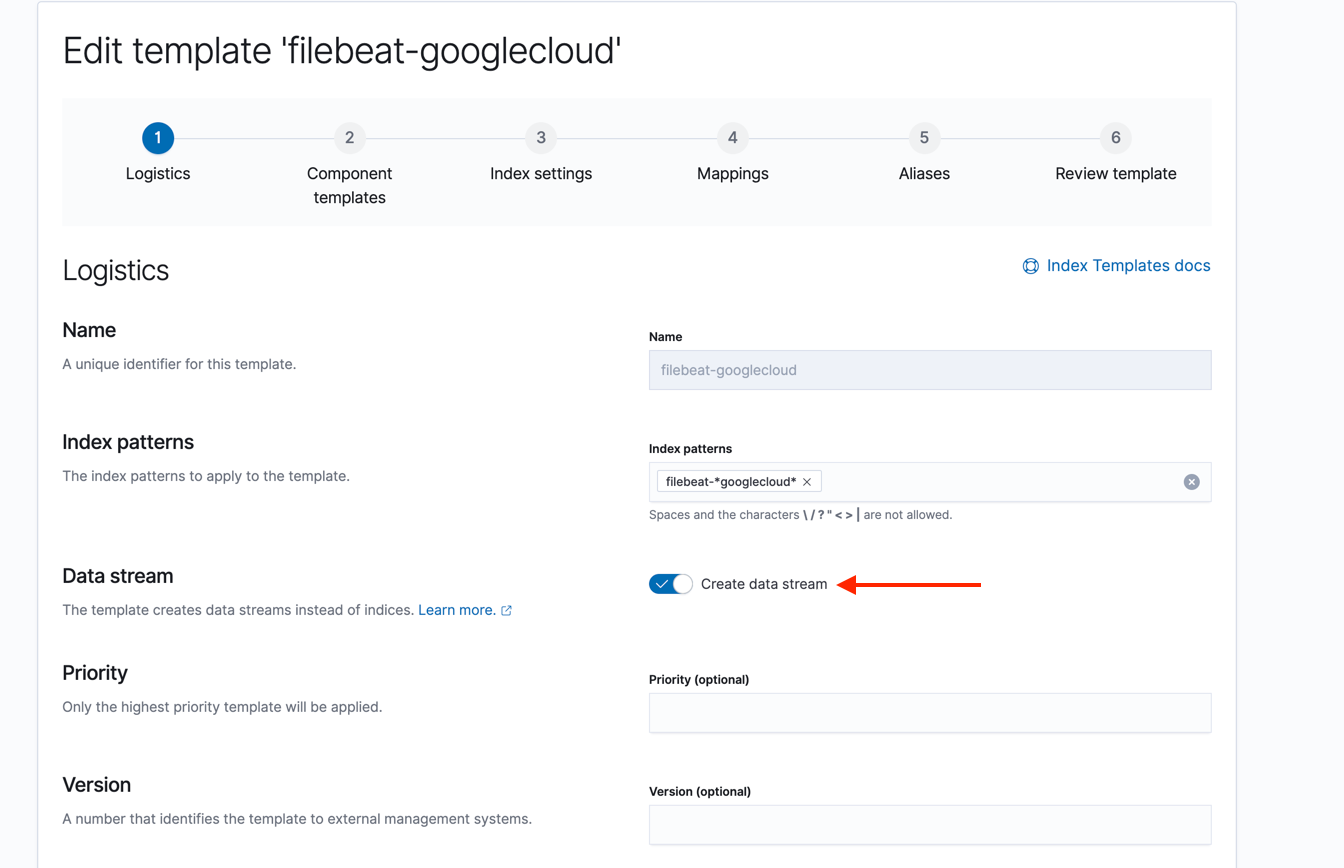
- Add the component template you created to in step 2 to this new template
- Override the default setting from the component template to use the custom index life cycle policy
{
  "index": {
    "lifecycle": {
      "name": "filebeat-30days"
    }
  }
}
- Leave Mappings blank as the mappings are inherited from the component template.
- Leave Aliases blank.
- Save the template. Repeat these steps for all of the custom data sets with the correct ILM policies, either
filebeat-30daysorfilebeat-365days.
Step 4: Configure output to multiple indices
Filebeat allows you to break the data based on event.module value to smaller indices. There are two typical logs flow setups, one with Logstash and one without:
Filebeat > Logstash > Elasticsearch
Data makes a stop at Logstash before being ingested into Elasticsearch. In this setup, we will require minimal data parsing to be done in Logstash given you have done the filebeat setup command.
input {
  beats {
    port => 5044
  }
}

filter {
  mutate {
    add_tag => [ "coming_from_logstash"]
  }
}

output {
    elasticsearch {
    index => "filebeat-%{[agent][version]}-%{[event][module]}"
    user => "elastic"
    password => "password"
    pipeline => "%{[@metadata][pipeline]}"
    hosts => [ "https://<elasticsearch_URL>:<port>" ]
    action => "create"
    }
}
Filebeat > Elasticsearch
In this setup, Filebeat sends data straight to Elasticsearch without using Logstash.
filebeat.inputs:
- type: log
  enabled: false
filebeat.config.modules:
  path: ${path.config}/modules.d/*.yml
  reload.enabled: true
setup.template.settings:
  index.number_of_shards: 1
# Set up Kibana
setup.kibana.host: "https://Kibana_URL:443"
setup.kibana.protocol: https
# Set up Elasticsearch
output.elasticsearch:
  hosts : ["https://Elasticsearch_URL:443"]
  username: "elastic"
  password: "${elastic_user_pd}"
  indices:
    - index: "filebeat-%{[agent.version]}-%{[event.module]}"
      when.has_fields: ['event.module']
processors:
  - add_host_metadata:
      when.not.contains.tags: forwarded
  - add_cloud_metadata: ~
  - add_docker_metadata: ~
  - add_kubernetes_metadata: ~
logging.level: debug
logging.to_files: true
logging.files:
  path: /var/log/filebeat
  name: filebeat
  keepfiles: 7
  permissions: 0644
Step 5: Start ingesting
If everything works correctly, you should see something similar to this:
GET _cat/indices/filebeat*?v
health status index                                                           uuid                   pri rep docs.count docs.deleted store.size pri.store.size
green  open   .ds-filebeat-7.10.1-azure-2020.12.26-000001                     4xvOnCt2Sx6iVSy3WnUaKQ   3   1         24            0      1.7mb        876.1kb
green  open   .ds-filebeat-7.10.1-aws-2020.12.26-000001                     4xvOnCt2Sx6iVSy3WnUaKQ   3   1         24            0      1.7mb        876.1kb
green  open   .ds-filebeat-7.10.1-googlecloud-2020.12.26-000001               PYxA7WHwQf6dVzEJ07X2yQ   3   1     443538            0    294.2mb        146.8mb
green  open   .ds-filebeat-7.10.1-system-2020.12.26-000001                    sZdFR68wSWCr_XOQasEkWA   3   1         72            0      1.1mb        607.2kb
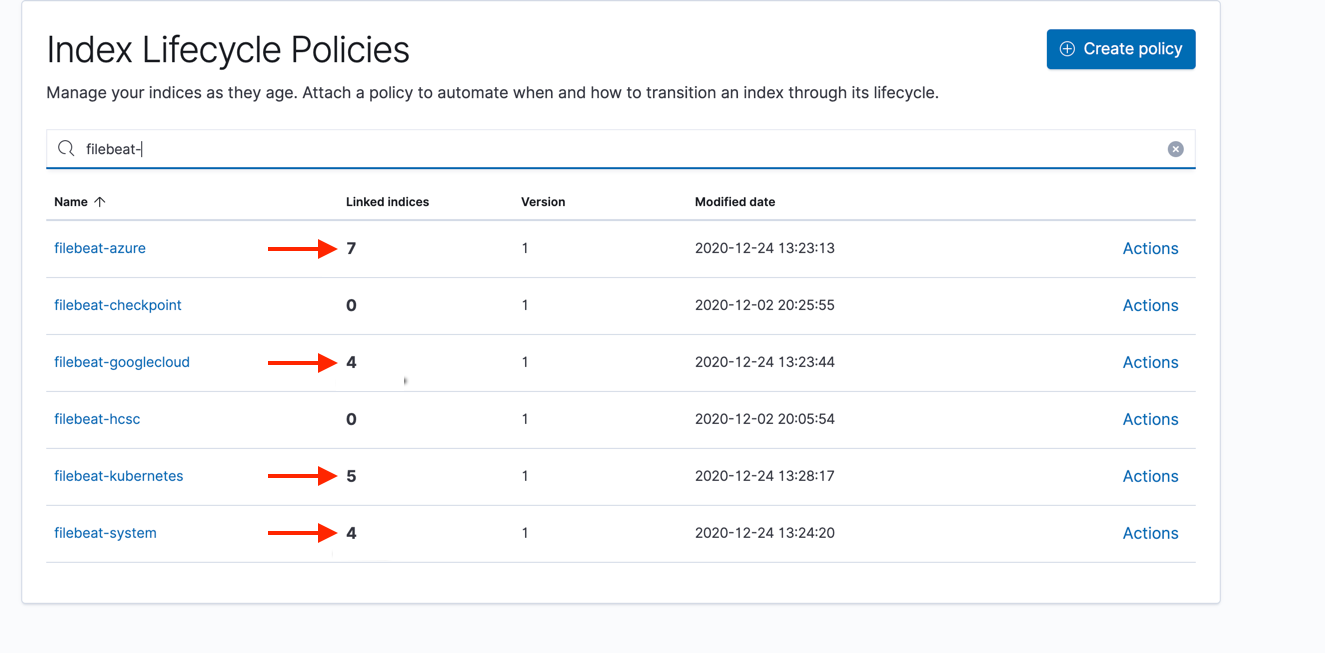
And your ILM policy should show that it is being applied to x number of indices.
Start streaming today
It's that simple, and now you have fewer management tasks to worry about! If you've just been reading along and haven't tried it yet, I'd encourage you to try it yourself and start using Filebeat to start streaming in and analyzing logs from multiple data sources.
Want to see the health of your entire ecosystem beyond just log files? Check out Elastic Observability and bring your logs, metrics, and APM traces together into a single stack. Learn more about ILM in this webinar, and please reach out on the Discuss forums if you have any questions.