Enhanced monitoring of Amazon EKS with Elastic add-on capabilities
Easily enable Elastic add-on within the Amazon EKS Console for streamlined monitoring and quick data onboarding.
.jpeg)

 Share on Twitter
Share on Twitter

 Share on LinkedIn
Share on LinkedIn

 Share on Facebook
Share on Facebook

 Share by Email
Share by Email

 Print this page
Print
Amazon Elastic Kubernetes Service (EKS) makes running Kubernetes on AWS simple and scalable. But as your workloads grow, so does the need for robust monitoring and observability. Enter Elastic Agent, a powerful, unified way to collect logs, metrics, and security data from your EKS clusters, all managed through Elastic Fleet. In this blog, we’ll walk through how to set up Elastic Agent on EKS, highlight key considerations, and share some tips for getting the most out of your monitoring stack.
Why monitor EKS with an Elastic Agent add-on?
Modern cloud-native applications are dynamic and distributed. Traditional monitoring tools often struggle to keep up. Elastic Agent, managed by Fleet, provides:
Unified data collection: Logs, metrics, and security events in one place
Scalability: Runs as a DaemonSet, so every EKS node is covered
Centralized management: Configure and update agents from a single UI in Kibana
- Powerful visualizations: Use Kibana to explore and analyze your Kubernetes data
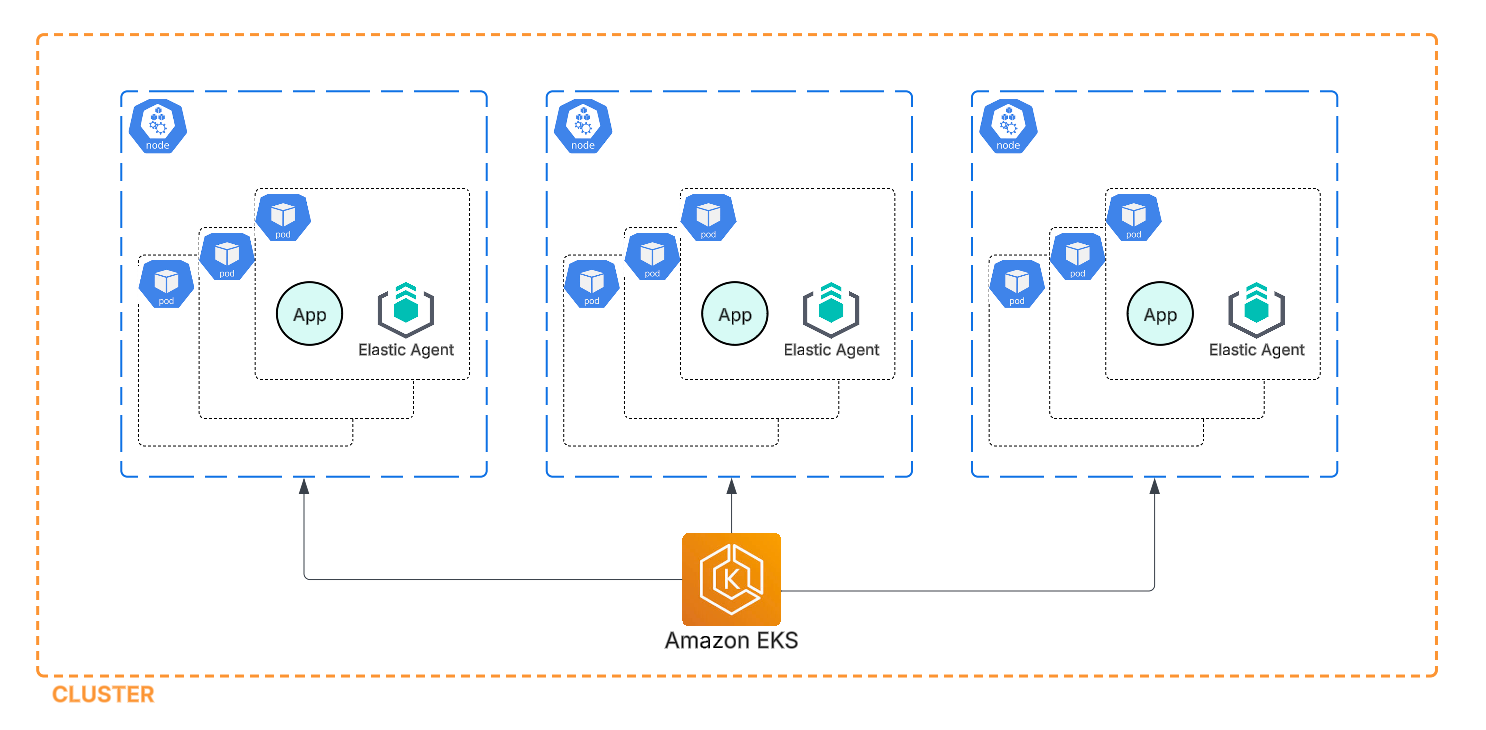
Solution overview
The Elastic Agent EKS add-on is deployed as a DaemonSet, ensuring that each Kubernetes node in the EKS cluster runs a pod with the Elastic Agent. Since DaemonSets are managed by the Kubernetes control plane, EKS automatically ensures that an instance of the pod is running on every node. The Elastic Agent EKS add-on can be further customized based on configuration parameters equivalent to those provided in the Elastic Agent Helm chart, allowing users to tailor the deployment to their specific observability and security requirements.
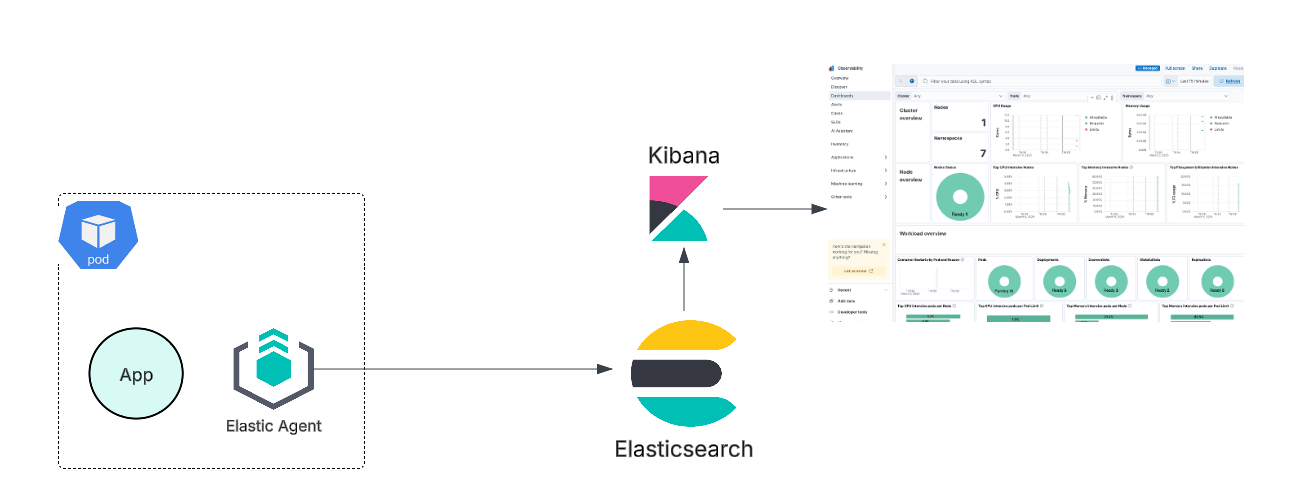
Once the Elastic Agent is deployed in a pod, it automatically enrolls with Fleet, Elastic’s centralized management system, using the specified configuration values. After enrollment, Fleet provides full control over the agent, including its health status, configuration of integrations, and data ingestion. This setup enables centralized observability and security by ingesting and analyzing data in Elasticsearch, with visualization and management provided through Kibana.
Step-by-Step: Deploying Elastic Agent on Amazon EKS
Let’s break down the process, based on Elastic’s official documentation:
1. Prerequisites
An existing Amazon EKS cluster (Need help? AWS docs have you covered.)
- Elasticsearch and Kibana for storing and visualizing your data (The fastest way is to use Elastic Cloud, which runs on AWS, GCP, or Azure.)
2. Add the Elastic Agent add-on
You can add the Elastic Agent as an EKS add-on using the AWS Console, eksctl, or AWS CLI. Here’s a high-level overview:
Choose the Elastic Agent version you want.
Get the Fleet URL and Enrollment Token from your Elastic Cloud deployment (or self-managed Elastic Stack).
- Configure the add-on with these values:
agent:
   fleet:
      enabled: true
      url: <insert url from onboarding>
token: <insert enrollment token from onboarding>Apply the configuration and deploy the add-on to your EKS cluster.
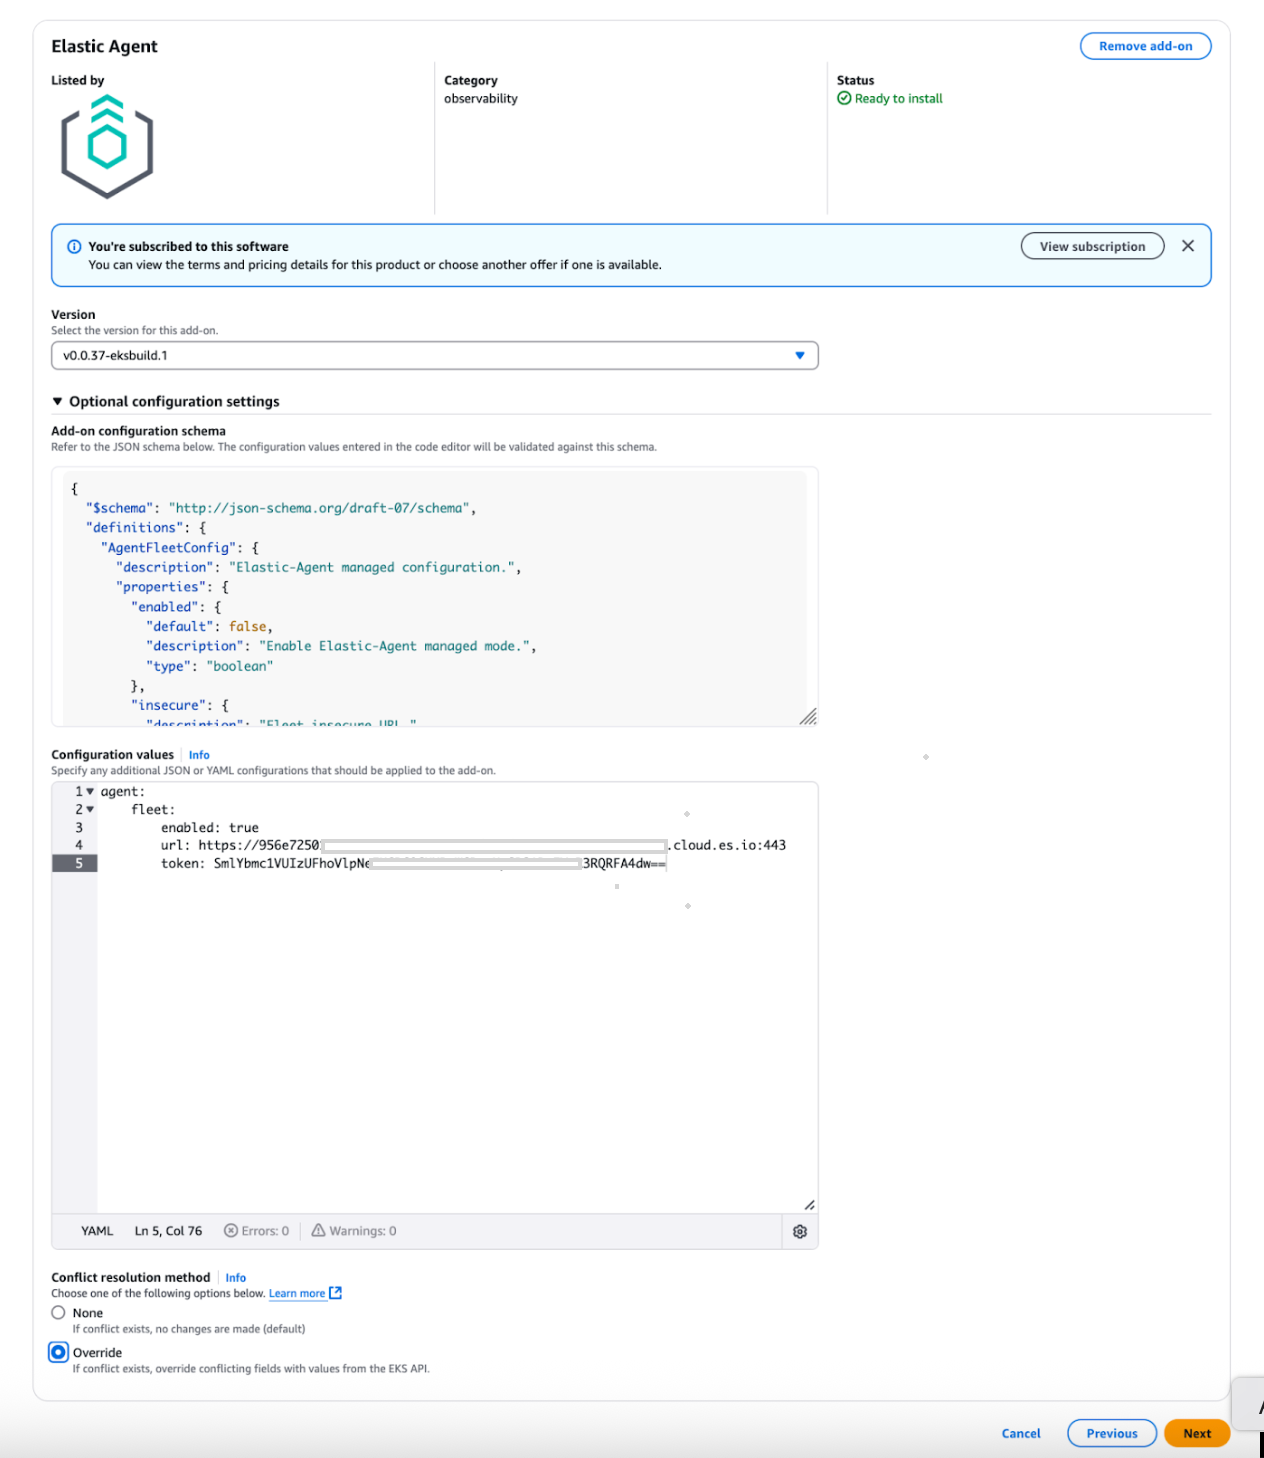
Note: We recommend selecting configuration Override.
3. Verify the deployment
In the AWS EKS Console, the Elastic Agent add-on should show as Active.
- In Kibana, go to Management > Fleet > Agents. Your EKS nodes should appear as enrolled agents.
4. Launch Kibana and explore data
Log in to your Elastic Cloud account.
Open the Kibana endpoint for your deployment.
Use prebuilt dashboards or build custom visualizations to monitor cluster health, pod metrics, and more.
Final thoughts
The Elastic Agent offers a robust observability solution for Amazon EKS, enabling confident workload monitoring. Despite certain limitations inherent to the managed EKS environment, its unified data collection and advanced analytics capabilities position it as a leading option for contemporary DevOps practices.
The release and timing of any features or functionality described in this post remain at Elastic's sole discretion. Any features or functionality not currently available may not be delivered on time or at all.
In this blog post, we may have used or referred to third party generative AI tools, which are owned and operated by their respective owners. Elastic does not have any control over the third party tools and we have no responsibility or liability for their content, operation or use, nor for any loss or damage that may arise from your use of such tools. Please exercise caution when using AI tools with personal, sensitive or confidential information. Any data you submit may be used for AI training or other purposes. There is no guarantee that information you provide will be kept secure or confidential. You should familiarize yourself with the privacy practices and terms of use of any generative AI tools prior to use.
Elastic, Elasticsearch, and associated marks are trademarks, logos, or registered trademarks of Elasticsearch N.V. in the United States and other countries. All other company and product names are trademarks, logos, or registered trademarks of their respective owners.
Share
- Share on Twitter
Share on Twitter
- Share on LinkedIn
Share on LinkedIn
- Share on Facebook
Share on Facebook
- Share by Email
Share by Email
- Print this page
Print