Elasticsearch Observability: Embracing Prometheus and OpenMetrics Standards for Metrics
In this blog we will cover the following:
- Why open standards are important
- The Prometheus exposition format
- How Elastic views observability
- Three ways Elasticsearch can consume Prometheus metrics
- An example of how to collect and visualize metrics exposed by the Prometheus Redis exporter
Open Standards
At opensource.com, there's an informative resource entitled: "What are Open Standards?". There are many great points in that document, but to me, coming from many years in ops, these are the ones that resonate:
- Availability: Open standards are available for all to read and implement.
- Maximize end-user choice
- No discrimination (vendor neutrality): Open standards and the organizations that administer them do not favor one implementor over another.
- No Intentional Secrets: The standard must not withhold any detail necessary for interoperable implementation.
Those compelling reasons why open standards are good, now let's talk about why the Prometheus exposition format is the basis for OpenMetrics. In his talks at PromCon 2018 and KubeCon + CloudNativeCon North America 2018, Richard Hartmann summed up the reasons for creating an open standard influenced by the Prometheus exposition format:
- Most data formats are proprietary, hard to implement, or both
- Prometheus has become a de-facto standard in cloud-native metric monitoring
- Ease of exposition data has lead to an explosion in compatible metrics endpoints
- Prometheus' exposition format is based on a lot of operational experience, but has been designed between few people
- Some other projects and vendors are torn about adopting something from a "competing" product
Prometheus exposition format
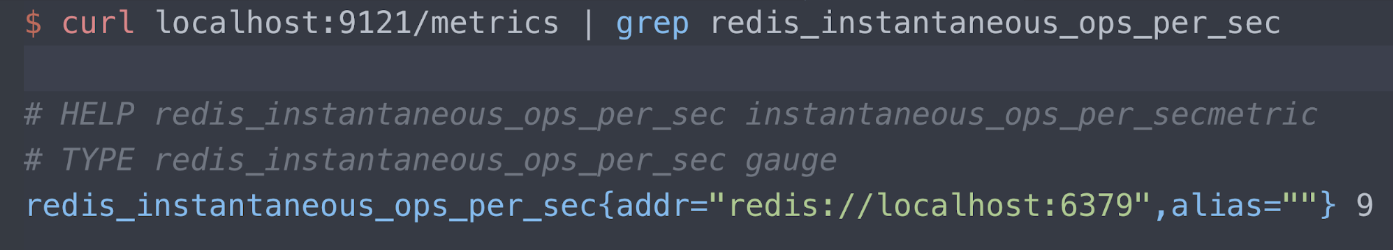
You can read about the exposition format in the Prometheus Github repo. For now, let's just look at an example. I have an exporter, Oliver006's Redis exporter, publishing metrics at port 9121 at the /metrics endpoint. I am only showing information about the Redis "instantaneous ops per second" metric here. There are three lines for the reading:
- Help text
- The type of metric (gauge in this case)
- The Redis server being measured (localhost port 6379), and its current reading (9 ops per sec)
Observability at Elastic
I encourage you to read about how Elastic views observability, but here is my favorite line from the post:
The goal of designing and building an 'observable' system is to make sure that when it is run in production, operators responsible for it can detect undesirable behaviors (e.g., service downtime, errors, slow responses) and have actionable information to pin down root cause in an effective manner (e.g., detailed event logs, granular resource usage information, and application traces).
That statement, which I wholeheartedly support, tells me that we need all of the logs, metrics, and trace information to run, repair, and manage the services we provide. Prometheus is a very important part of observability because of its widespread adoption and active community. The OpenMetrics standard will only increase the value by removing barriers, whether they are real or perceived, to adoption of a common sense "born in ops" metrics format.
Most people I speak with are very familiar with the Elastic Stack, or ELK, for logging. If you did not know that the Elastic Stack is also great for metrics and APM check us out for metrics and APM / distributed tracing.
The main reasons we see interest in deep integration between Elastic Stack and Prometheus way of exporting metrics are:
- Combining metrics with logs and APM in Elasticsearch and correlating them in Kibana. Check out a user story from NS1 about combining logs and metrics in Elastic Stack.
- Using Elasticsearch as long term storage for metrics collected by Prometheus Server, which does not currently support clustering natively.
- Achieving a global view of your metrics across geographically dispersed Prometheus instances.
The rest of the blog describes in detail how we approach these integrations.
A sample exporter
My demo environment is running in Google Kubernetes Engine (GKE), so I am running my application, Metricbeat, and the Prometheus exporter, all in Kubernetes. This is a bit of Oliver006's manifest for deploying a Redis exporter as a sidecar alongside the Redis image. As you can see, the exporter is publishing at port 9121, which is the default assigned port number for the Prometheus Redis exporter.
...
  - name: redis-exporter
    image: oliver006/redis_exporter:v0.17.2
    resources:
      requests:
        cpu: 100m
        memory: 100Mi
    ports:
    - containerPort: 9121
...
Scraping metrics with the Metricbeat Prometheus module
Metricbeat is Elastic's lightweight shipper for metrics. The Prometheus module that ships with Metricbeat can gather metrics in three ways:
- Connect to the Prometheus server at port 9090 and pull already collected metrics using the Prometheus Federation API (to get the metrics that Prometheus is collecting)
- Connect to the Prometheus server on port 9090 using the /metrics endpoint (Prometheus self monitoring)
- Connect to Prometheus exporters individually and parse the exposition format
Why would you choose one approach over another? It depends on your level of comfort with Prometheus Server.
- If you already have Prometheus Server set up to scrape metrics and would like to directly query these metrics for integration purposes, you may start with options (1) and (2).
- If, on the other hand, you don't already have Prometheus Server or don't mind scraping your exporters in parallel by multiple tools, you may choose option (3).
Note: Some of the above Metricbeat functionality is beta in Metricbeat version 7.0. We would encourage you to download the 7.0 beta or copy the container links from https://www.docker.elastic.co/ and run the beta in a non-production environment.
Prometheus Federation API
In general, federation is used to enable scaling, bring datasets together, or make a copy of the data available in a different location (for disaster recovery). Prometheus server provides a /federation endpoint, and Elastic connects to this endpoint to copy the metrics collected by Prometheus for all of the above reasons.
...
  - module: prometheus
    period: 10s
    hosts: ["prometheus-service.monitoring.svc.cluster.local:9090"]
    metrics_path: '/federate'
    query:
      'match[]': '{__name__!=""}'
...
In the example above, the query is set to "anything that has a non-blank name". You may not want to grab everything, and the Prometheus docs have information on how to write a more restrictive match condition. The example also is connecting to the Prometheus server every ten seconds, my demo server is only collecting from a few pods and kube-state-metrics, but you may want to change the interval.
Prometheus self monitoring
Prometheus provides a /metrics endpoint, just like the exporters. This is so that you can collect metrics about the Prometheus server. This is configured like so:
...
  - module: prometheus
    period: 10s
    hosts: ["prometheus-service.monitoring.svc.cluster.local:9090"]
    metrics_path: /metrics
...
Prometheus exporter scraping
This bit of YAML from a manifest to deploy a Metricbeat
DaemonSet tells Metricbeat to autodiscover things
with
kubernetes.labels.app == redis and read metrics in from port
9121 of that pod. Recall that the containerPort set for the Redis
exporter container is 9121.
...
- condition.equals:
    kubernetes.annotations.prometheus.io/scrape: "true"
  config:
    - module: prometheus
      period: 10s
      # Redis pods
      hosts: ["${data.host}:9121"]
      metrics_path: /metrics
...
Once Metricbeat is deployed, any pods that satisfy the condition kubernetes.labels.app == redis have the Prometheus module applied to them and the metrics are collected from the exporter sidecar at port 9121.
But, metadata makes the k8s world go round, right? Let's do more with metadata and the Beats autodiscover feature. Look at this replacement for the above bit of YAML:
...
- condition.equals:
    kubernetes.annotations.prometheus.io/scrape: "true"
  config:
    - module: prometheus
      period: 10s
      hosts: ["${data.host}:${data.kubernetes.annotations.prometheus.io/port}"]
      metrics_path: /metrics
...
Now instead of looking for exporters for Redis pods, we are
looking for exporters for any pod with an annotation of
kubernetes.annotations.prometheus.io/scrape set to true. This is
also how Prometheus autodiscovery is set up. Generally, Metricbeat
autodiscover is driven by an annotation in the elastic.co
namespace, but since we are talking about reading from Prometheus
exporters we should honor the standard k8s annotations associated
with Prometheus. If you look at the hosts list from above:
hosts: ["${data.host}:${data.kubernetes.annotations.prometheus.io/port}"]
You can see that we are no longer hard coding port 9121, as that
is the port for the Redis exporter. The annotation
prometheus.io/port is set to the port number for the exporter. For completeness, here
is a bit of the guestbook.yaml where these annotations were
set:
...
kind: Deployment
metadata:
  name: redis-master
spec:
  replicas: 1
  template:
    metadata:
      annotations:
        prometheus.io/scrape: "true"
        prometheus.io/port: "9121"
      labels:
        app: redis
...
Did I mention that metadata makes the k8s world go round? Wasn't that a song in the late 70's?
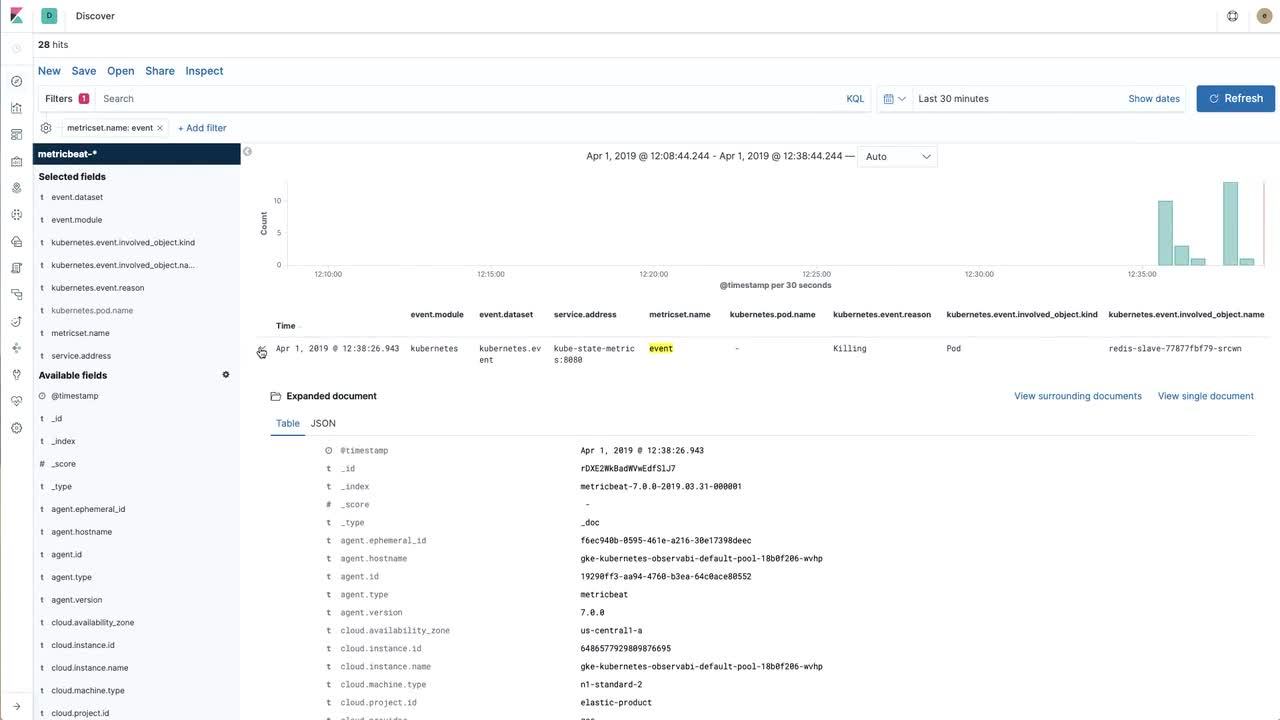
Visualizing to gain insight
Bringing the data into the Elastic Stack is great, but you have to be able to interact with the data. In the video below we will see how to approach building a useful visualization using Redis metrics scraped by Prometheus (and then imported into the Elastic Stack) and Kubernetes events collected from kube-state-metrics with Metricbeat directly.
If you would like to follow along with the video and have detailed instructions, see the example repo.
Back to Observability
In the last section we created a Kibana visualization for a key Redis metric (instantaneous ops per second) exposed by the Oliver006's Redis exporter. Our next step would be to collect logs and then create a dashboard and combine logs and metrics together across our applications.
To learn about collecting logs in a Kubernetes environment I would suggest that you follow the instructions in the elastic/examples GitHub repo. In just a few minutes you can have Filebeat, Metricbeat, and Packetbeat collecting data and publishing to Elasticsearch. There are sample dashboards that ship with the different Beats, and you should feel free to create your own visualizations for Prometheus data and mix the visualizations together to create your own dashboards for the way you work. And if you run into any issues or want to talk observability, reach out on the Discuss forums.