Easy JavaScript error investigation with source maps

 Share on Twitter
Share on Twitter

 Share on LinkedIn
Share on LinkedIn

 Share on Facebook
Share on Facebook

 Share by Email
Share by Email

 Print this page
Print
Hopefully by now you’ve taken your first sip of Elastic RUM, or real user monitoring, and see the power of searching through traces and the User Experience metrics to gain insights into how users actually use and experience your application. One issue you may have experienced is the challenge of finding the source of errors for minified JavaScript files.
Minification is the process of modifying code and markup using techniques such as whitespace and comment removal and variable renaming to reduce the overall filesize. This is intended to improve the user experience by speeding up the page loading time in the browser. Sadly, this can make diagnosing the cause of issues in production applications rather tricky. As you can see from the below stack trace, files are often minified to a single line making it almost impossible to interpret and diagnose the offending code causing the error.
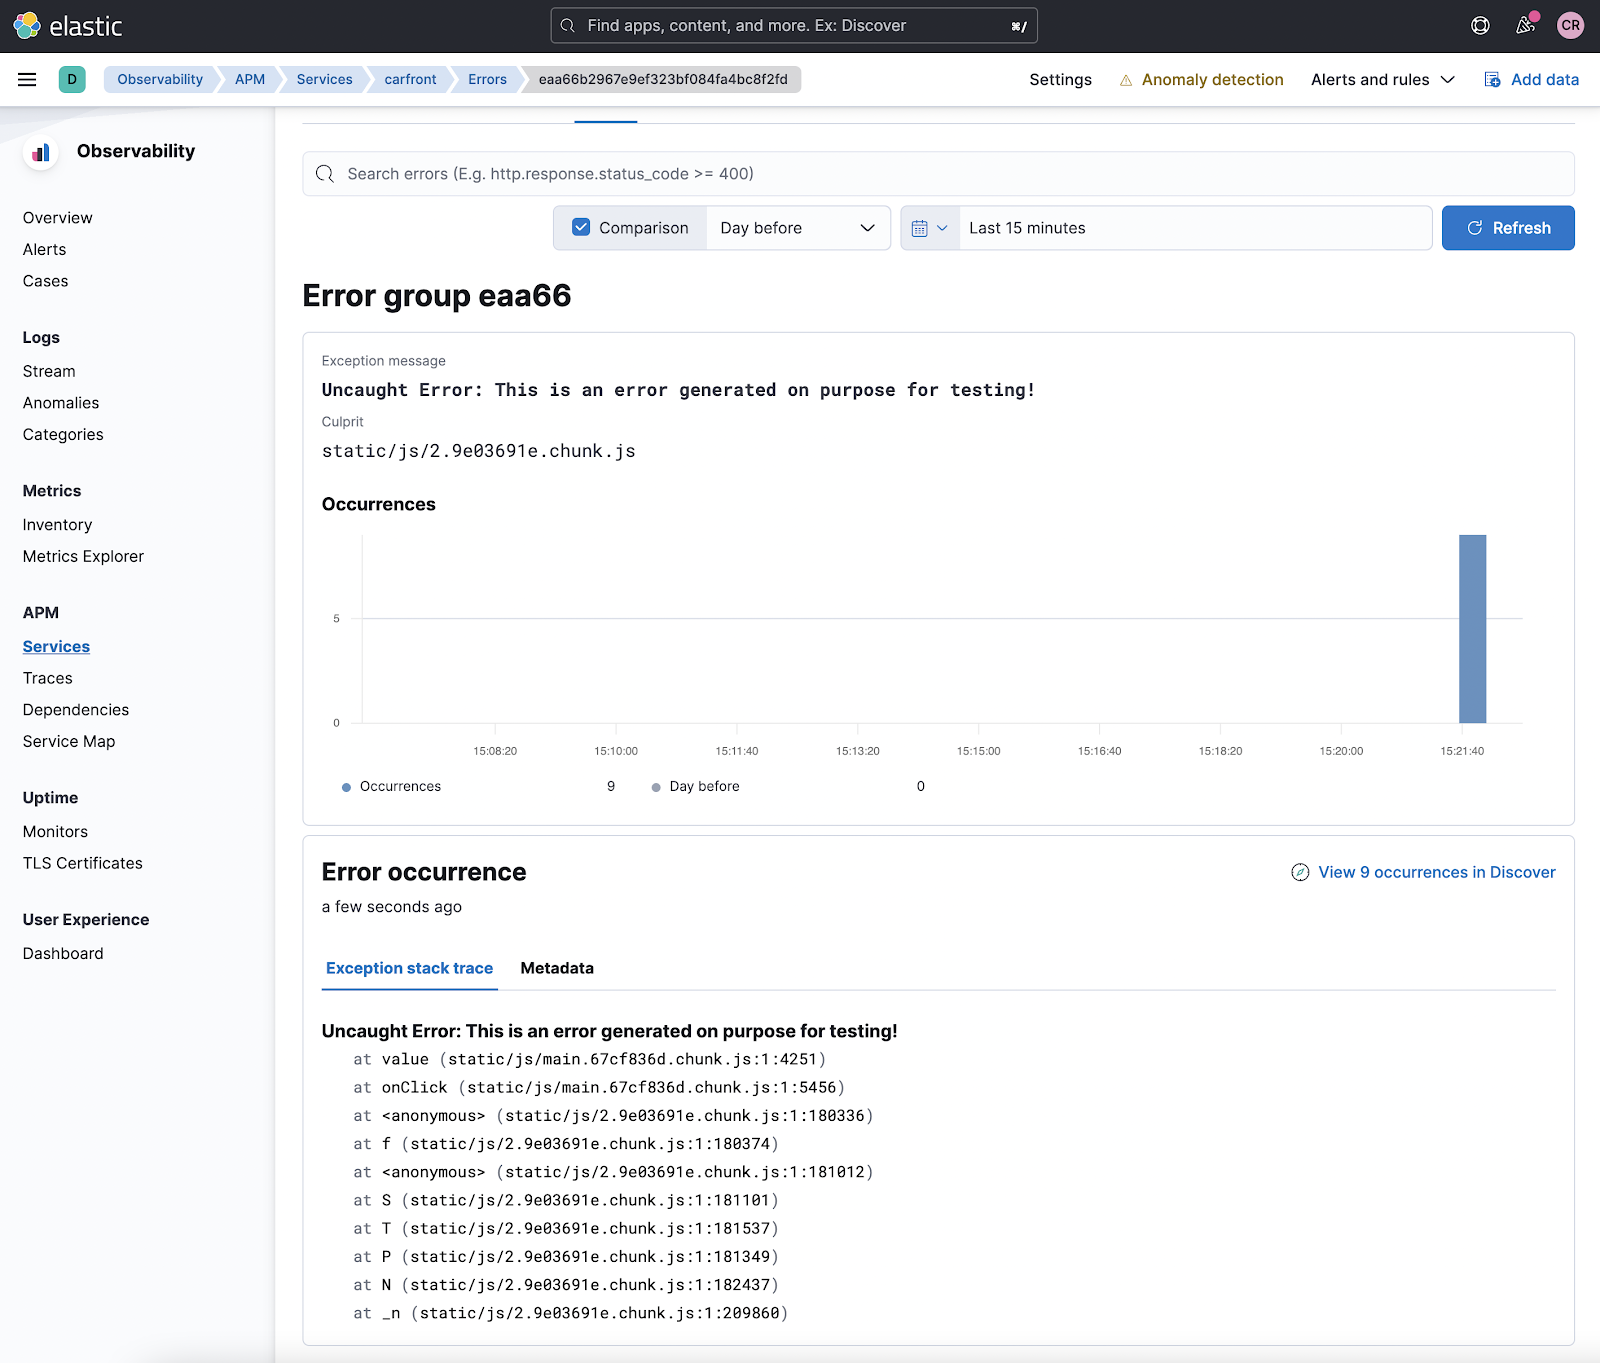
Rather than scanning and searching for position 1:4251 on line one of main.67cf836d.js, as we would in the above example, there is another way to obtain developer-readable code by using source maps. Source maps provide a mapping between the minified and original code, allowing for the browser, or in this case Elastic APM, to show the source in a prettified format. This makes debugging errors with your application much easier by telling you exactly where the error happened in your original source code, instead of the cryptic minified code.
Easy debugging with source maps
Source maps are here to help. You can generate source maps for your bundles and upload them to the APM server. Then the APM server will be able to translate the errors from minified code to your original source code and give you a more comprehensible error message.
As per the latest documentation, there are two possible ways to upload your JavaScript source maps:
Uploading via a custom application, such as the Node.js example provided here. This option is better suited for uploading application changes as part of a continuous integration, or CI process to ensure the latest source map is available in Elastic APM for your application.
Let’s see how we can do this for our frontend React application that we instrumented previously using the cURL approach. We will build a production build for our application and upload the source maps. You can create a production build using the following command:
npm run build –productionYou should see the following message at the end of the build:
The build folder is ready to be deployed.
You may serve it with a static server:

  serve -s build
You can read more details about the production build here: https://facebook.github.io/create-react-app/docs/production-build
If you are receiving errors, it may be that you don’t have serve installed. This can be fixed by installing serve globally if you have not:
npm install -g serveServe your React application in production mode with this command to ensure you have minified files:
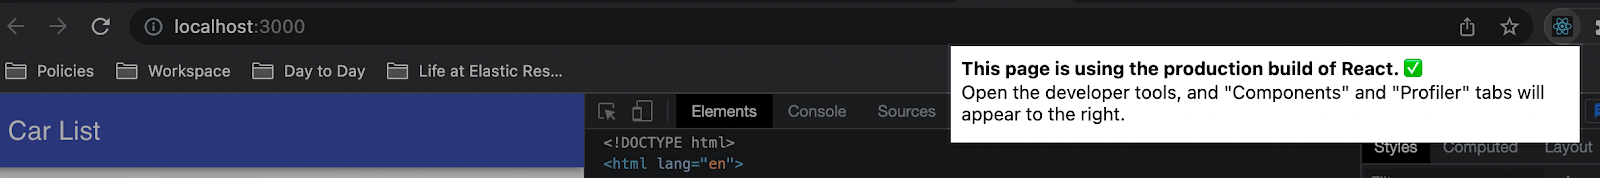
serve -s buildWhen your React application is in production mode, the icon of React Developer Tools for Chrome will have a dark background, and you should see a notification similar to the below screenshot. When your React application is in development mode, the icon will have a red background. Make sure you are running the production build.
Now, if you click on the error button to generate an error and check it out from the Kibana APM UI, you will see the minified error stack as per the previous screenshot.
Let's load our source maps and see the magic! The source maps are generated under the directory $APP-PATH/carfront/build/static/js. Go in there, and you will see three source map files for the three JavaScript files. Run the following commands against the Kibana endpoint of your cluster to upload them to Kibana, ensuring to upload the files with the js.map extension only. Be careful to hit the Kibana endpoint and not the APM endpoint used previously to configure your RUM and APM agents.
Make sure you change the URL, the file name, and other parameters to match your application version, build, and environment. It is also advisable to generate an API Key for authentication if you do not have one already via the API keys screen in Kibana.
curl -X POST "<KIBANA URL>/api/apm/sourcemaps" \
-H 'Content-Type: multipart/form-data' \
-H 'kbn-xsrf: true' \
-H 'Authorization: ApiKey <YOUR API KEY>' \
-F 'service_name="carfront"' \
-F 'service_version="0.90"' \
-F 'bundle_filepath="http://localhost:3000/static/js/2.9e03691e.chunk.js"' \
-F 'sourcemap=@./2.9e03691e.chunk.js.map'

curl -X POST "<KIBANA URL>/api/apm/sourcemaps" \
-H 'Content-Type: multipart/form-data' \
-H 'kbn-xsrf: true' \
-H 'Authorization: ApiKey <YOUR API KEY>' \
-F 'service_name="carfront"' \
-F 'service_version="0.90"' \
-F 'bundle_filepath="http://localhost:3000/static/js/main.5879e442.chunk.js"' \
-F 'sourcemap=@./main.5879e442.chunk.js.map'

curl -X POST "<KIBANA URL>/api/apm/sourcemaps" \
-H 'Content-Type: multipart/form-data' \
-H 'kbn-xsrf: true' \
-H 'Authorization: ApiKey <YOUR API KEY>' \
-F 'service_name="carfront"' \
-F 'service_version="0.90"' \
-F 'bundle_filepath="http://localhost:3000/static/js/runtime~main.fdfcfda2.js"' \
-F 'sourcemap=@./runtime~main.fdfcfda2.js.map'
Pay special attention that the service version is a string and matches exactly with the service version you configured in your React application. In this case, we are uploading with service_version=‘0.90’, and the service version is set to ‘0.90’ in the application. If you load the source maps with service_version=‘0.9’, it will not work!
Kibana loads the service maps to the Fleet policy. Generate another error and check the stack trace again from the APM UI error tab. You will see the stacktrace like the following screenshot, beautifully reflecting your original source code! So much easier to debug and identify issues now!
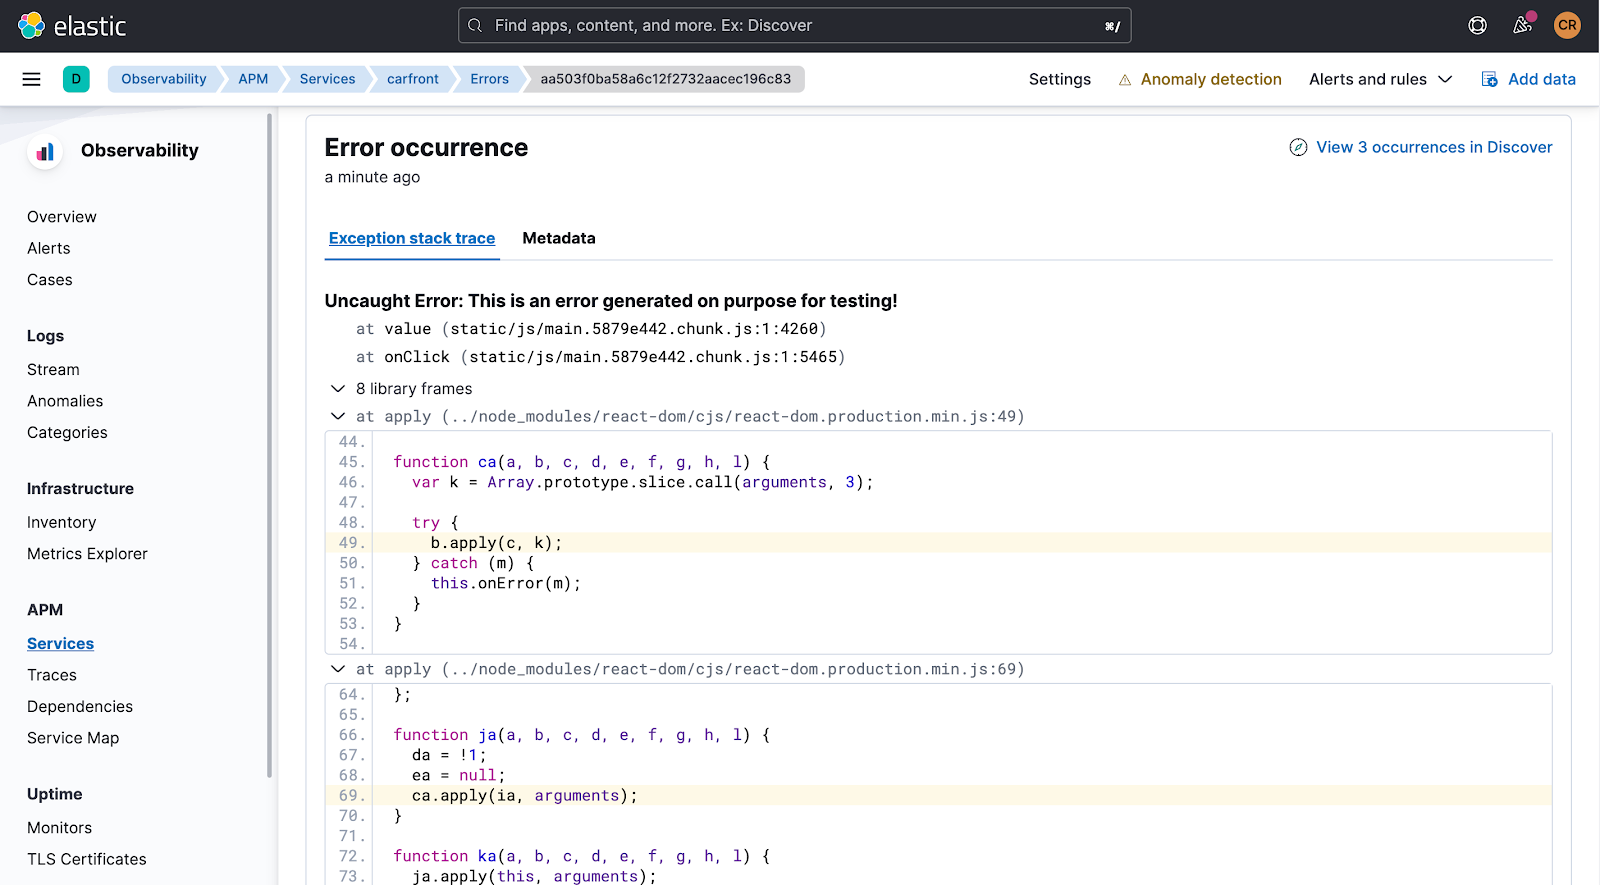
Note that traces are shown that match the service name, service version and absolute path. Further details and examples can be found here.
Summary
Hopefully, this blog made it clear the power of uploading source maps to Kibana to allow for better error diagnostic capabilities. Together with the RUM and APM agents for frontend and backend services, RUM gives you a holistic view of application performance from a user perspective through distributed tracing.
To get started with Elastic APM, you can download the Elastic APM server to run it locally, or create an Elastic Cloud trial account and have a cluster ready in a few minutes.
As always, reach out on the Elastic APM forum if you want to open up a discussion or have any questions. Happy source mapping!
Share
- Share on Twitter
Share on Twitter
- Share on LinkedIn
Share on LinkedIn
- Share on Facebook
Share on Facebook
- Share by Email
Share by Email
- Print this page
Print