A comprehensive guide on threat hunting for persistence with osquery


 Share on Twitter
Share on Twitter

 Share on LinkedIn
Share on LinkedIn

 Share on Facebook
Share on Facebook

 Share by Email
Share by Email

 Print this page
Print
As of the Elastic 7.16 release, Osquery Manager is generally available for Elastic Agent, providing every user the ability to easily deploy and run osquery across their environments. With the collection of osquery data combined with the power of Elastic Stack, you can greatly expand your endpoint telemetry, enabling enhanced detection and investigation and improving hunting for vulnerabilities and anomalous activities.
This blog post covers a brief introduction to osquery and the Osquery Manager integration for Elastic Agent, and provides a comprehensive configuration guide for the Agent and its usage for threat hunting for persistence on Windows endpoints.
What is osquery?
Osquery is an open source tool to monitor IT infrastructure. It lets you query your operating systems — supported systems are Windows, OS X (macOS), Linux, and FreeBSD — as if they were a relational database, in that you can explore your system data with SQL-like statements. It relies on an extensive schema to collect system operational information.
Furthermore, osquery provides osqueryd to manage multiple hosts, run scheduled queries, and aggregate results and generate logs.
Deploying and scaling osquery in a multi-machine environment can easily become a struggle for many IT professionals. The following figure shows that many steps are involved in the process:
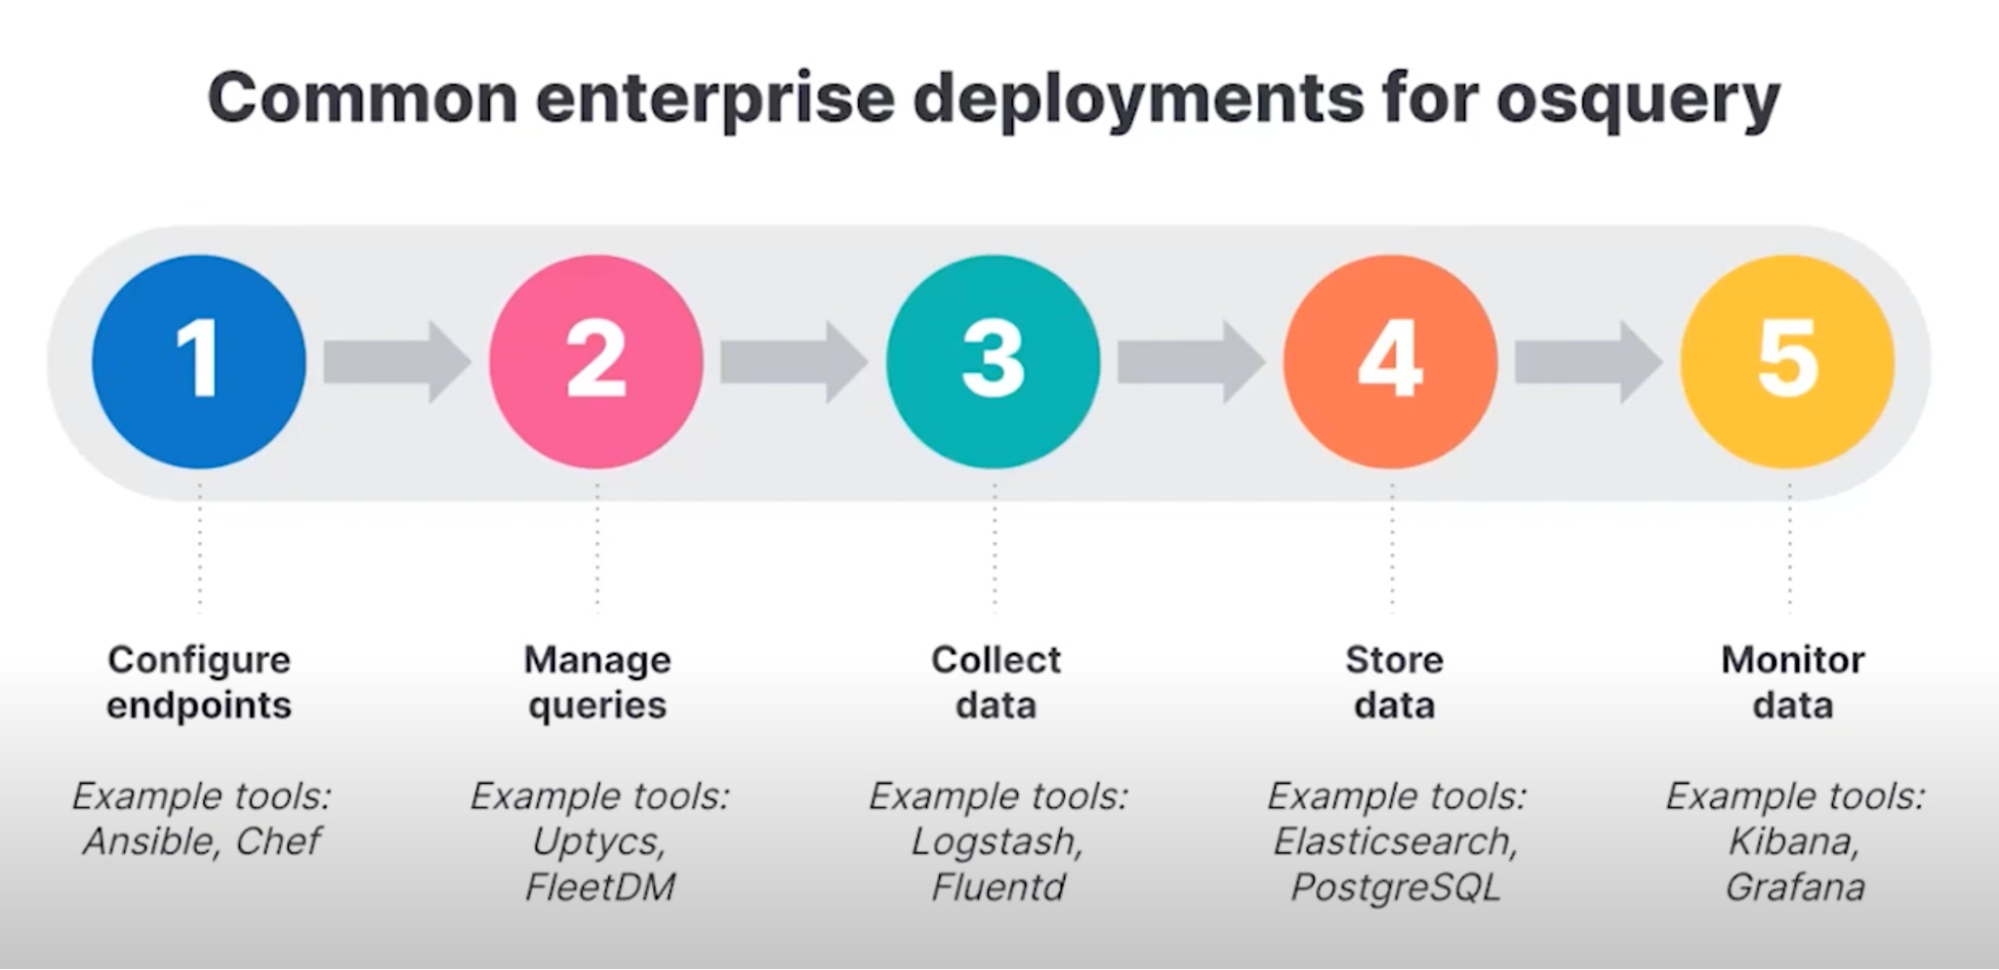
While this might seem complex, the Elastic Osquery Manager integration supports an easy deployment across multiple endpoints and simplifies the collection of data and aggregation of data.
It’s never been easier to implement osquery at scale
The Osquery Manager integration simplifies the deployment shown in Figure 1 by adding it to the policy assigned to the agents running on your endpoints. Once deployed, it lets you run live queries and schedule recurring queries for those agents to gather data from hundreds of tables across your entire enterprise — all within a dedicated page in Kibana. The extensive schema provided by osquery helps with a variety of use cases, including security vulnerability detection, compliance monitoring, incident investigations, and more.
Let’s see now how to use this integration for threat hunting.
Windows advanced persistence techniques
Persistence is a tactic used by adversaries to maintain their access on a compromised machine. Several techniques exist to achieve this tactic – an exhaustive list of those techniques are describe within the MITRE ATT&CK Matrix.
Some of the most common techniques exploited by the attackers are:
1. Scheduled Task technique (MITRE T1053.005): Adversaries may abuse the Windows Task Scheduler to perform task scheduling for initial or recurring execution of malicious code. Attackers often invent very convincing names for their scheduled tasks and this might pass unobserved by a less scrutinous eye.
2. Services Creation technique (MITRE T1543.003): Adversaries may create or modify Windows services to repeatedly execute malicious payloads as part of persistence. When Windows boots up, it starts programs or applications called services that perform background system functions. We should investigate services whose executables are located in an unusual folder. AppData and its subfolders are a notorious example.
3. Startup Items technique (MITRE T1547.001): Adversaries may achieve persistence by adding a program to a startup folder or referencing it with a Registry Run key. Adding an entry to the "Run keys" in the Registry or startup folder will cause the program referenced to be executed when a user logs in. Placing a program within a startup folder will also cause that program to execute when a user logs in.
The most common Run keys created by default on Windows systems are:
HKCU\Software\Microsoft\Windows\CurrentVersion\Run
HKCU\Software\Microsoft\Windows\CurrentVersion\RunOnce
HKLM\Software\Microsoft\Windows\CurrentVersion\Run
HKLM\Software\Microsoft\Windows\CurrentVersion\RunOnce
But Run keys may exist under multiple Windows registry hives, and if you want a comprehensive understanding on this subject, visit the official microsoft documentation.
With this brief introduction to some known persistence techniques, let's focus on the configuration of the Elastic Agent with the Osquery Manager integration.
Elastic Agent: A quick refresh
The Elastic Agent provides a single, unified way to add monitoring for logs, metrics, and other types of data to a host. It can also protect hosts from security threats, query data from operating systems, and more. A single agent makes it easier and faster to deploy monitoring across your infrastructure. Each agent has a single policy that you can update to add integrations for new data sources, security protections, and more.
Elastic Agent can be deployed in Fleet or standalone mode. With the former, you install Elastic Agent on each host you want to monitor and use Fleet in Kibana to define, configure, and manage your agents in a central location. It makes the management and upgrade of your agents considerably easier. Standalone mode lets you install Elastic Agent on each host you want to monitor and manually configure the agent locally on the system where it’s installed. You are responsible for managing and upgrading the agents. This approach is recommended for advanced users only.
Every Agent policy may contain multiple integrations depending on the type of data you want to collect from the endpoint where it is deployed.
Configuring Osquery Manager with Elastic Agent
Let’s see the full configuration cycle from deployment to installation of the Elastic Agent focusing on the Osquery Manager integration.
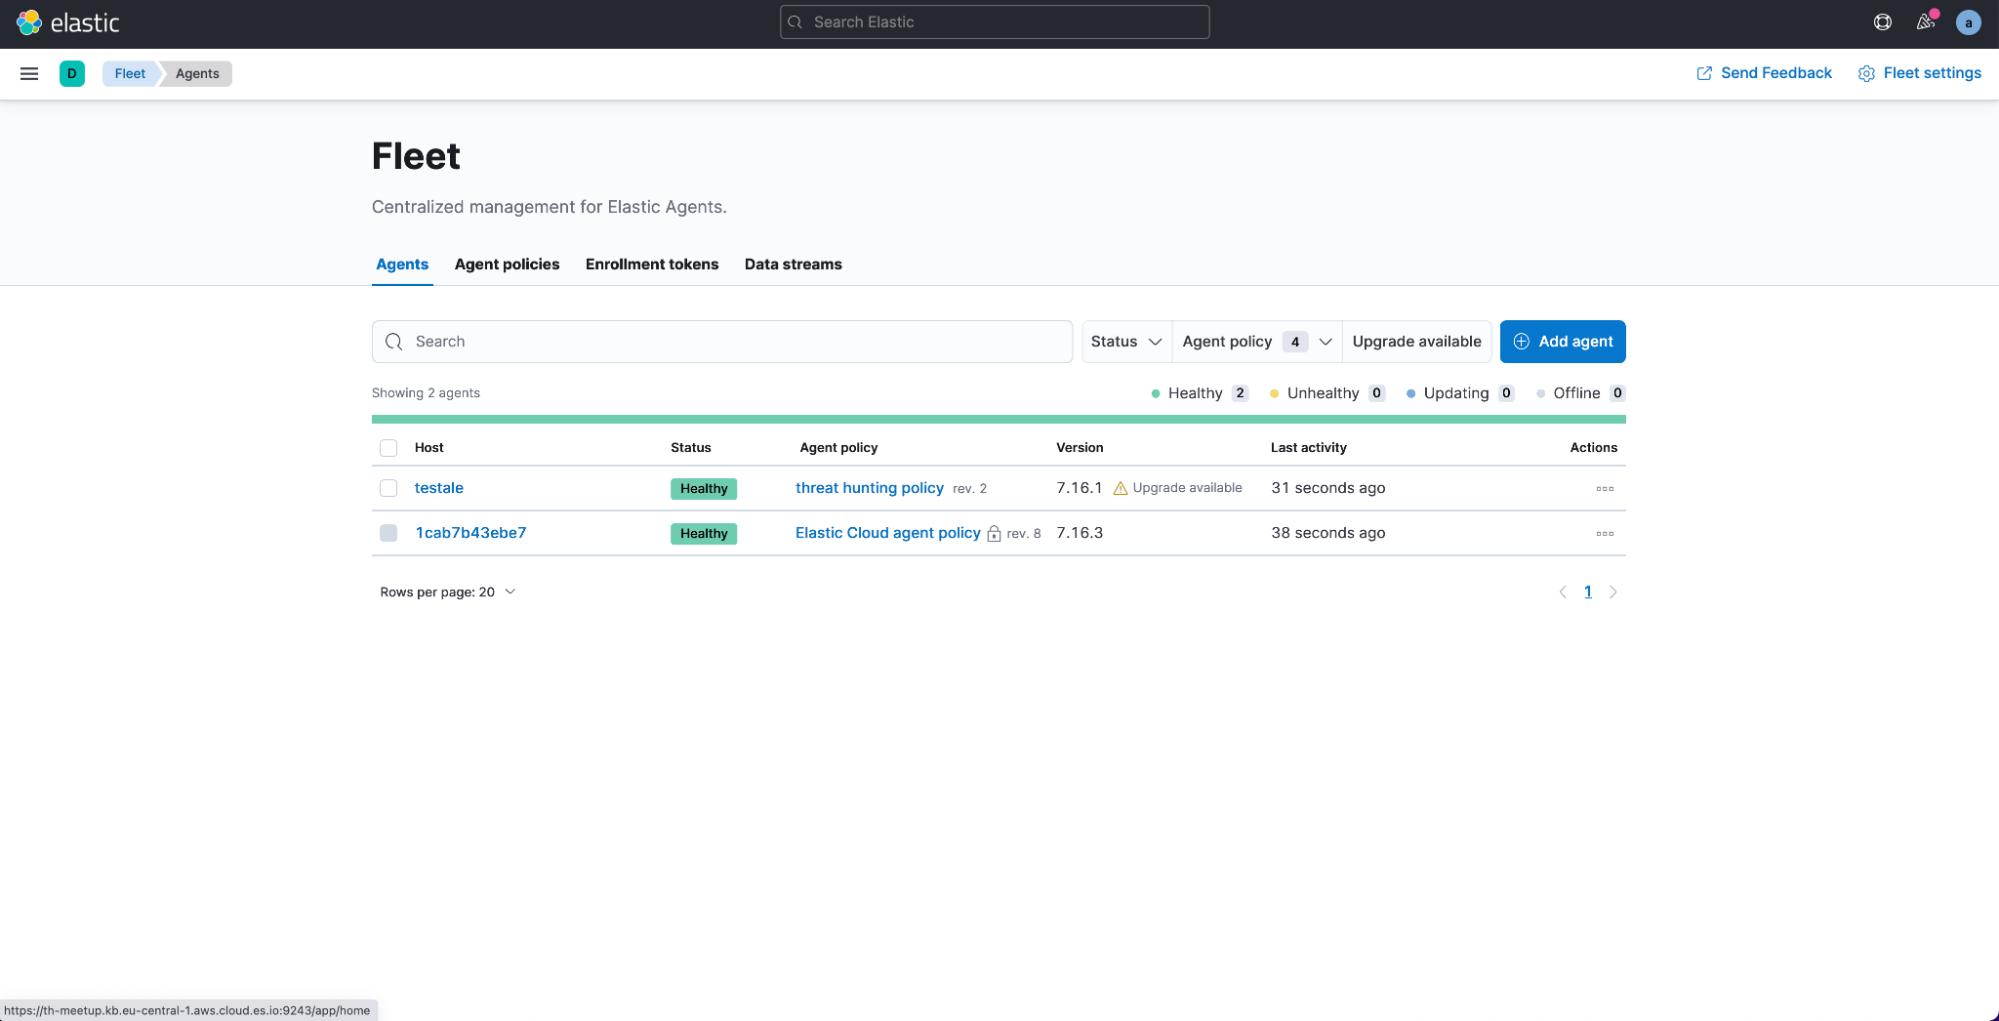
Once your deployment is up and running, open the Kibana menu and browse to Fleet:
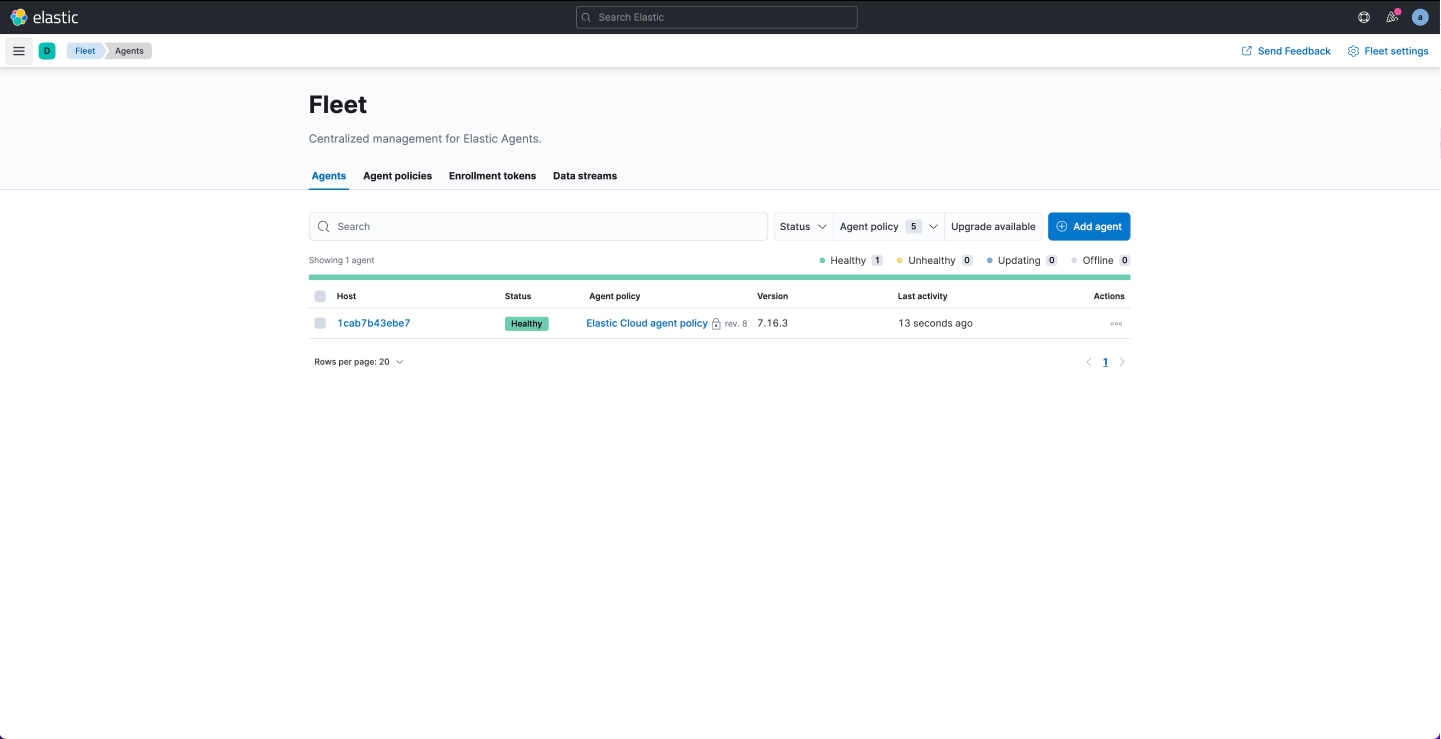
The Agents section shows the running agents in your deployment along with their status and policy information. If you spin up a cloud instance, you will see that a preconfigured agent running the Elastic Cloud agent policy already includes a fleet server integration.
Before adding your own agent, it's time to create a policy. You can rely on the available default policy, which comes with a prebuilt system integration. In this demo, however, we are going to create a new one. The creation wizard allows you to specify the policy name as well as enable the collection of monitoring data for troubleshooting purposes if needed.
Once the policy is created, you can start adding integrations to it. Every policy already contains the System integration that allows you to monitor your servers and collect system data like Windows event logs, Linux /var/log files, cpu, load, memory, network, process, and process_summary.
We can leave it to collect metrics from our host and then add new ones by clicking on the button Add Integrations. From the integration catalog, search for the Osquery Manager integration and select it to add to your existing policy.
Once your policy is saved, it is time to assign it to the Agent — but it hasn’t yet been created. Let's follow the Agent installation wizard for downloading and installing the Agent files on the target system.
If the installation process is successful, you will see your agent listed as healthy in the Agents tab. Data is now being collected from your Endpoints.
Repeat this installation step for every endpoint you want to monitor. The same policy can be applied to multiple endpoints at the same time.
How does Osquery Manager work?
With Osquery in Kibana, you can:
- Run live queries for one or more agents
- Schedule query packs to capture changes to OS state over time
- View a history of past queries and their results
- Save queries and build a library of queries for specific use cases
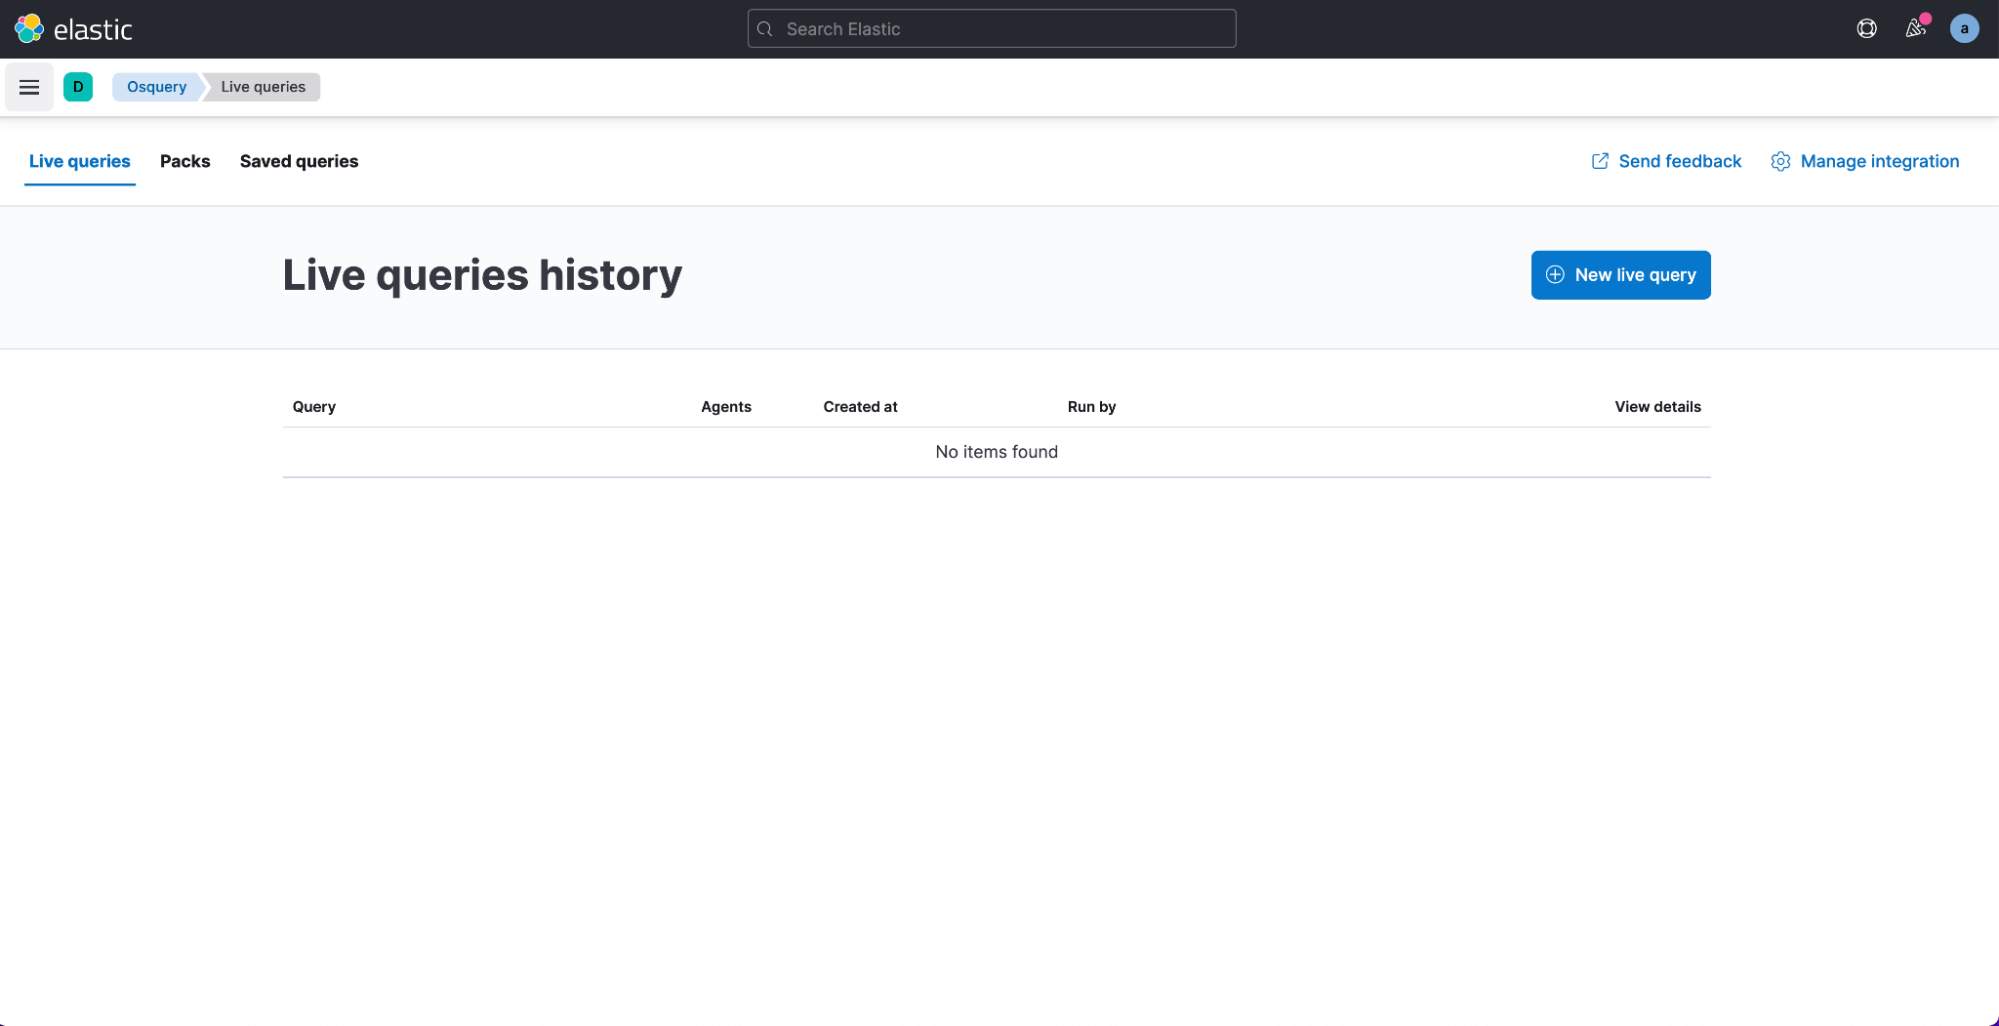
The osquery page contains three sections:
- Live queries: To run live osqueries on the deployed agents running the osquery manager integration, you can select one or multiple agents at the same time on which you want to run the intended query. Or group them by Policy or running Platform.
- Packs: You can create packs to organize sets of queries. This allows you to define multiple queries at the same time and schedule them to run at periodic intervals on one or more agents. For example, you might create one pack that checks for IT compliance-type issues, and another pack that monitors for evidence of malware.Saved queries: Contains a list of queries that have been saved previously and can be reused for live queries or also within packs.
It's finally time to see how to use the Osquery Manager integration to threat hunt for persistence on Windows. For this demo I have deployed a local Windows 2019 Server with an Agent running the System and Osquery Manager integration.
We are going to see how to perform threat hunting for the following two techniques:- Persistence with Task Scheduler (MITRE T1053.005)
- Persistence with Registry Run Keys (MITRE T1547.001)
Threat hunting for persistence with Task Scheduler
One possible persistence technique relies on the creation of scheduled tasks on Windows via task scheduler that would persist on system reboots. The presence of tasks that contain ambiguous names or a path to ambiguous executable files can represent an indicator of a malicious activity going on at the endpoint.
According to the extended osquery schema, the scheduled_tasks table collects the list of scheduled tasks on the Windows endpoints and includes several useful fields like the name, path, or runtime information on any task. An example query to be run to retrieve these information is as follows:
SELECT name, action, path, state FROM scheduled_tasks;Through this query, we are going to grab the list of scheduled tasks configured on our endpoint with enhanced details such as the path of the executable that is run by the scheduled task or the runtime information.
In the Kibana Osquery section, select the live queries tab to execute the SQL statement on a selected number of Agents. The query returns the content of the scheduled_tasks table. We could look into this data to look for indicators of persistence. For instance, in my endpoint I can see a service named WindowsUpdates where the action references a Powershell script on the ambiguous AppData folder with a very suspicious name.
Query results are automatically stored in an Elasticsearch index and can easily be mapped to the Elastic Common Schema to normalize your data to a common set of fields. This will greatly simplify your workflow within the Elastic Security app, enabling you to easily search, analyze, and visualize data across multiple sources.
Later in this blog we will see how to operationalise this data by creating a detection rule out of these queries.
Threat hunting for persistence with Registry Run Keys
As previously mentioned, adversaries may achieve persistence by referencing a program with a Registry Run key, such that it will cause the program referenced to be executed when a user logs in. Osquery schema provides a table named registry that retrieves information from the Microsoft registry hive like the key, name, path, or type that can be used for threat hunting purposes. The following SQL statement can be used to search for all Run\RunOnce keys values in the Registry Hive that could be exploited for persistence.
select * from registry where key like 'HKEY_USERS\%\SOFTWARE\Microsoft\Windows\CurrentVersion\Run' or key like 'HKEY_USERS\%\SOFTWARE\Microsoft\Windows\CurrentVersion\RunOnce' or key like 'HKEY_LOCAL_MACHINE\SOFTWARE\Microsoft\Windows\CurrentVersion\Run%\%' ;
The retrieved table can be analyzed looking for ambiguous registry values containing suspicious paths or command executions. In my example, I discovered a Run key with data that specifies the establishment of a remote connection to a suspicious IP address.
Scaling your operations with Osquery Manager
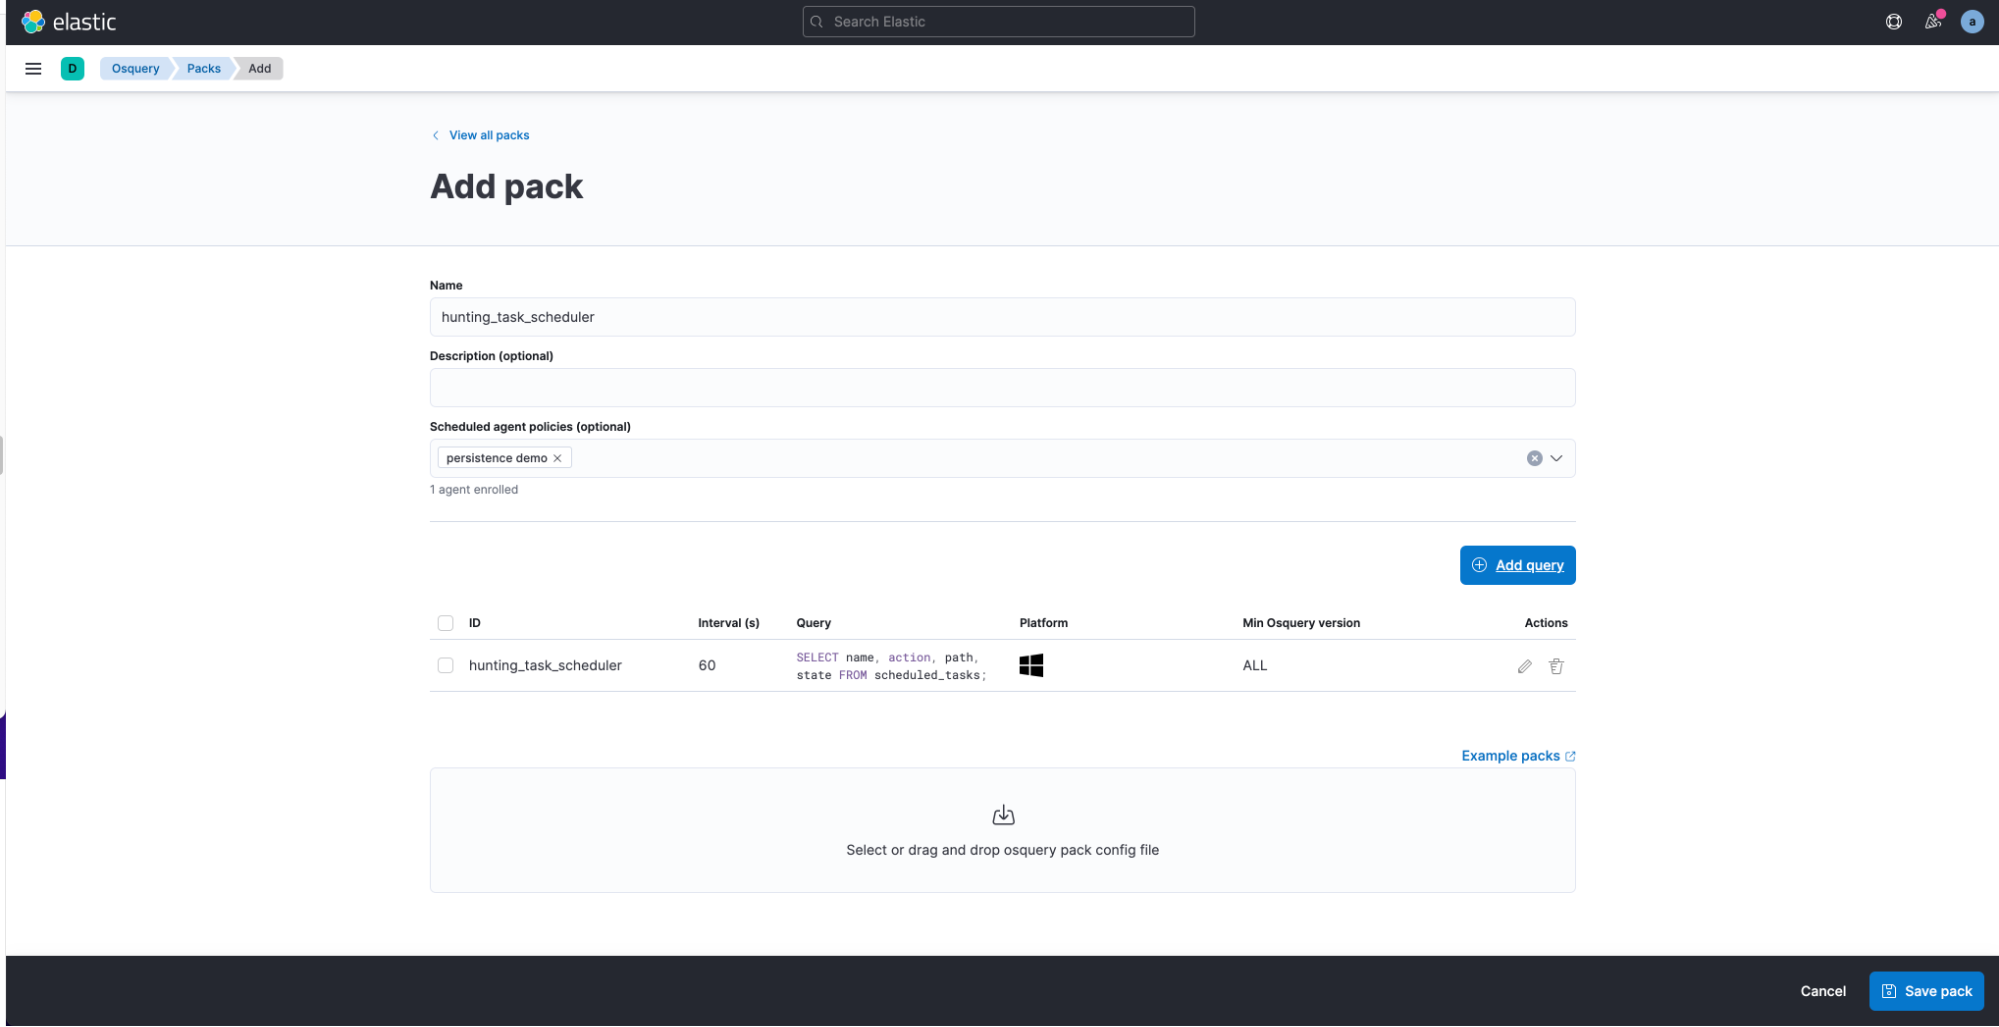
Osquery in Kibana provides a way to schedule queries to be run periodically via Pack. When adding a new Pack configuration, we can specify multiple queries to be executed at a certain interval and optionally map results or static values to fields in the Elastic Common Schema.
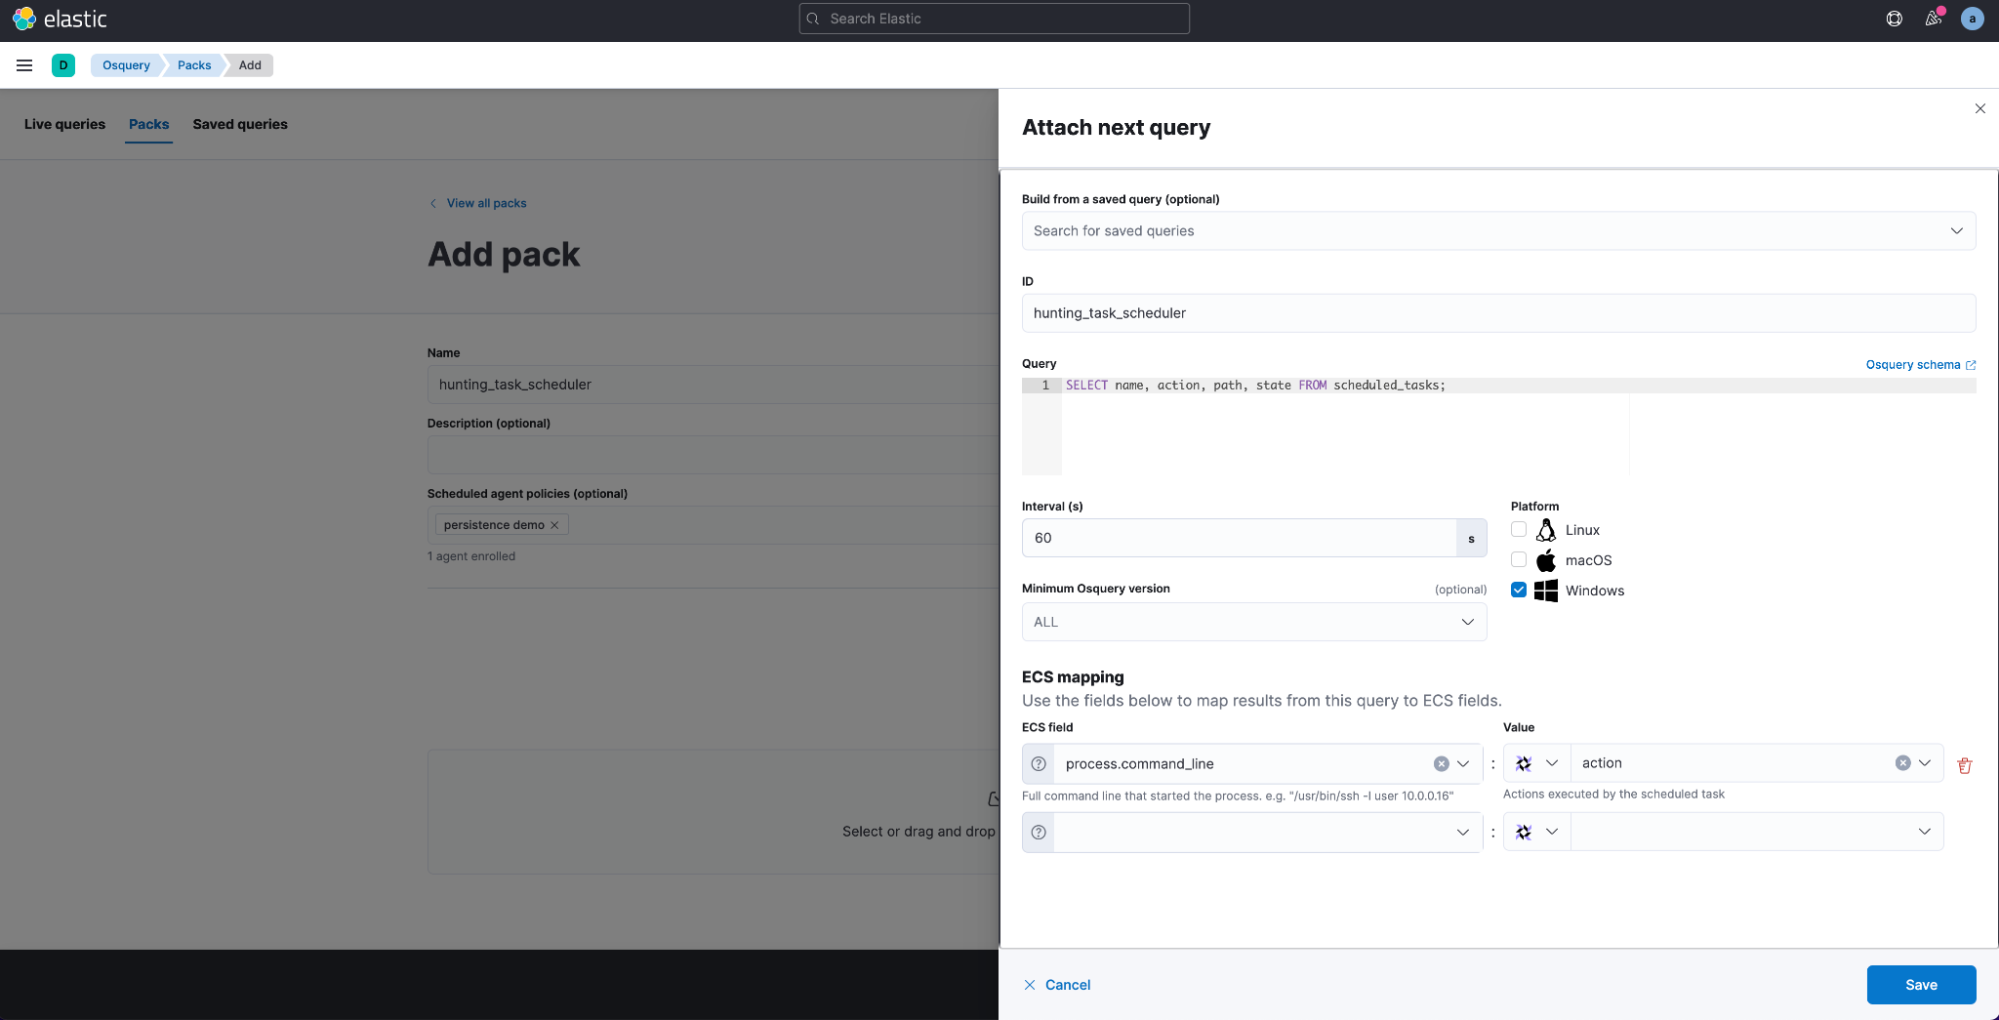
Furthermore, you can import prebuilt configuration Packs. The official osquery GitHub repository contains some very good examples of packs that could be used for security monitoring use cases.
Build security alerts for osquery data
Combining osquery with the Elastic Security solution will let you unleash all the power of the Elastic Stack.
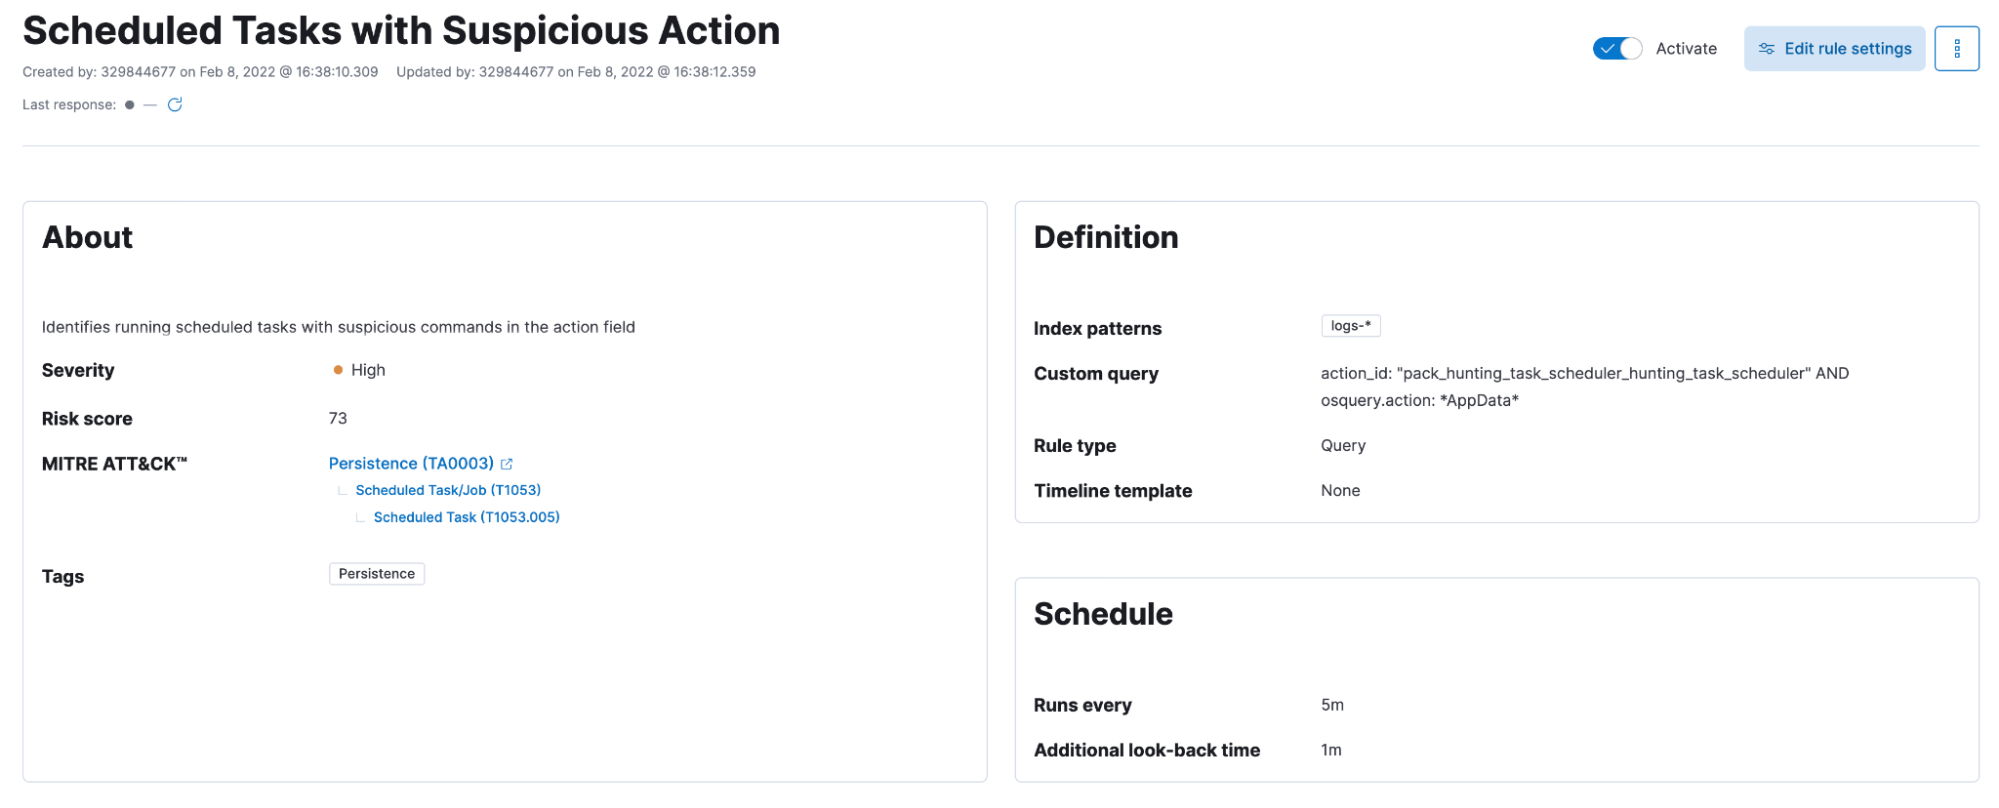
For instance, it is possible to rely on the results of a scheduled osquery with Packs and write a detection to alert when query results match a suspicious pattern. As an example, while hunting for persistence on Scheduled tasks, we could generate an alert whenever the returned results contain a path matching an executable in the AppData folder.
Give Osquery Manager a try
The Osquery Manager integration gives you greater insight into the endpoints you’re monitoring with Elastic Security and helps security teams to better detect, investigate, and hunt for vulnerabilities and anomalous activities.
If you want to give all this a try and see how easy it is to deploy Osquery Manager and start running queries, you can start a free 14-day trial of Elastic. Please share any feedback on the Elastic Discuss forum or the Elastic Stack Community on Slack.
Share
- Share on Twitter
Share on Twitter
- Share on LinkedIn
Share on LinkedIn
- Share on Facebook
Share on Facebook
- Share by Email
Share by Email
- Print this page
Print