How to automate verification of deployments with Argo Rollouts and Elastic Observability


 Share on Twitter
Share on Twitter

 Share on LinkedIn
Share on LinkedIn

 Share on Facebook
Share on Facebook

 Share by Email
Share by Email

 Print this page
Print
This blog post was written by Daniel Hoang, developer advocate from Akuity.
Shipping complex applications at high velocity lead to increased failures. Longer pipelines, scattered microservices, and more code inherently lead to bigger complexity where small mistakes may cost you big time.
We can’t promise that this blog post will help you get rid of failed deployments, however, we can promise that automated verification of deployments using Argo Rollouts and Elastic Observability will minimize damage, and help you feel more confident when shipping complex applications to Kubernetes.
What is Argo?
Argo is a collection of open-source tools for Kubernetes to run workflows, manage clusters, and do GitOps right. It’s also an open-source project that saw an incredible 115% year-on-year increase in in-production use according to the 2021 CNCF Survey.
In this blog post, we will take a glimpse at how to make the best out of combining Argo Rollouts and Elastic Observability and creating a fully controlled release. This guide is intended to help you understand what this type of implementation could look like with Argo CD, Argo Rollouts & Elastic Observability. You can always use other deployment tools or verification tools to achieve this as well.
Before we go into the setup of everything I want to share a bit about the tools we will be using today. Argo CD is a declarative, GitOps Continuous Delivery tool for Kubernetes. Argo Rollouts which is very key to this example is a drop-in replacement for a deployment that opens up complex deployment options like a canary and blue-green deployment. Elastic Observability is a platform available both on-premises and via Elastic Cloud that allows you to consolidate signal types like metrics, logs, and traces into a single unified view. We will be using its support to APM (Application Performance Management) for this setup.
Application setup
For this example, we will be using the rollouts demo application from a GitHub repository.
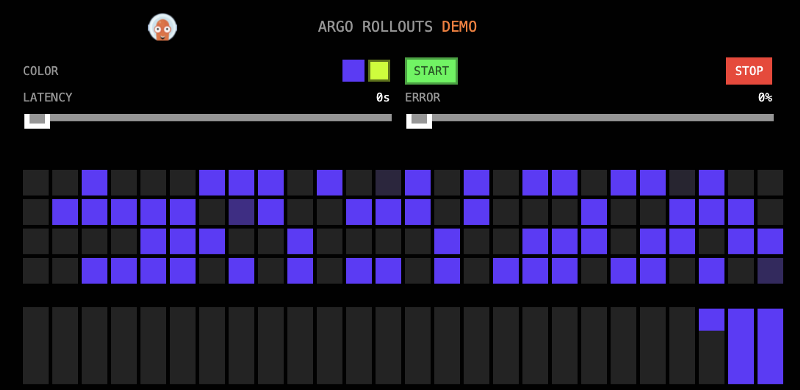
This application has a great visual representation. Each block represents a response. The images we will be using today will be purple and bad-yellow, where purple represents an errorless application and bad-yellow represents an application with a 50% error response rate.
Instrument the application with Elastic Observability
Now, why would you want to instrument your application with Elastic Observability? What we want to do is to provide reliability and insight into the pipeline so that developers can catch errors early and act upon them. Elastic Observability is a great tool to use to achieve this, especially in the context of Argo where your Kubernetes deployments can easily scale to massive proportions. With the added visibility teams can improve customers' experience and better adhere to SLAs and SLOs. The ultimate goal is to build software reliability.
For the purpose of this blog post, we will be using Elastic Cloud which is a SaaS-hosted version of Elastic. A quick start guide is available on the Elastic Documentation website:
Once Elastic Cloud is up, we will need to add the Application Performance Monitoring integration.
Once that is done, you will need to instrument the application.
Install the agent
Install the APM agent packages for Go.
go get go.elastic.co/apm
Configure the agent
Elastic Agents are unified agents that you deploy to hosts or containers to collect data and send it to the Elastic Stack, they can also be libraries that run inside of your application process depending on what programming language is used(In this case we’re using Go which this concept applies to.). APM services are created programmatically based on the executable file name or the ELASTIC_APM_SERVICE_NAME environment variable.
Initialize using environment variables:

Set the service name. Allowed characters: a-z, A-Z, 0-9, -, _, and space.

If ELASTIC_APM_SERVICE_NAME is not specified, the executable name will be used.

export ELASTIC_APM_SERVICE_NAME=

Set custom APM Server URL. Default:[ http://localhost:8200.](http://localhost:8200.)

export ELASTIC_APM_SERVER_URL=

Use if APM Server requires a token

export ELASTIC_APM_SECRET_TOKEN=
Instrument your application
Instrument your Go application by using one of the provided instrumentation modules or by using the tracer API directly.
import (
"net/http"

"go.elastic.co/apm/module/apmhttp"
)
func main() {
mux := http.NewServeMux()

...

http.ListenAndServe(":8080", apmhttp.Wrap(mux))
}
Alternatively, you could also instrument your application using OpenTelemetry. Here is an example in Go that shows you how to do this.
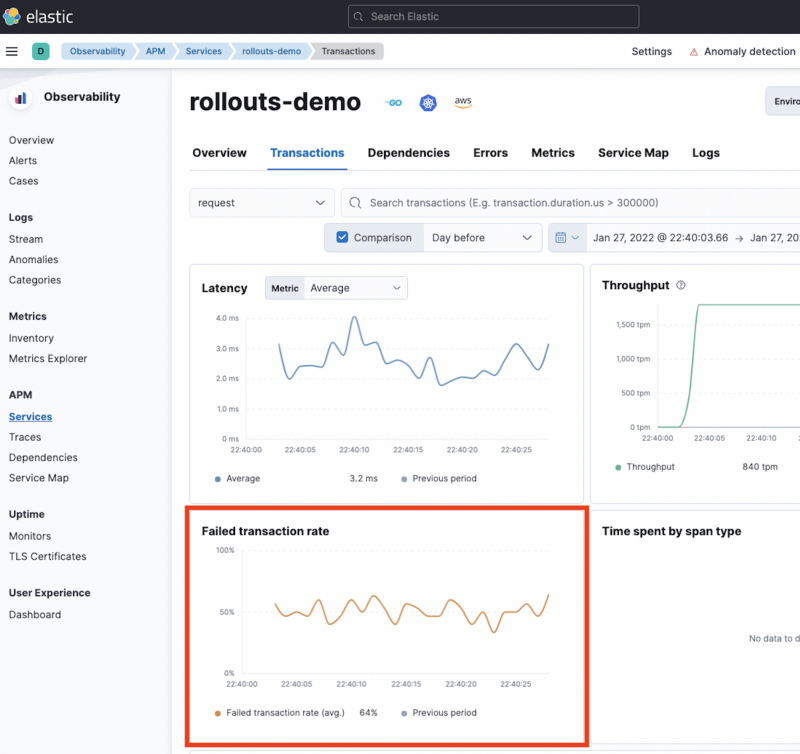
Find the data
Once we have the faulty application running we can start to see what data could be used for verification. In this case, it looks like the failed transaction rates are available so we'll go ahead and use that.
 ![alt_text]
All of the data that you would normally query for in Kibana is actually exposed using the Elastic API.
Build a test
As you’re building a test you will need to determine what metrics would be the best to track based on your application. For this example, we can use a simple query that essentially shows the average of the response codes based on a timeframe.
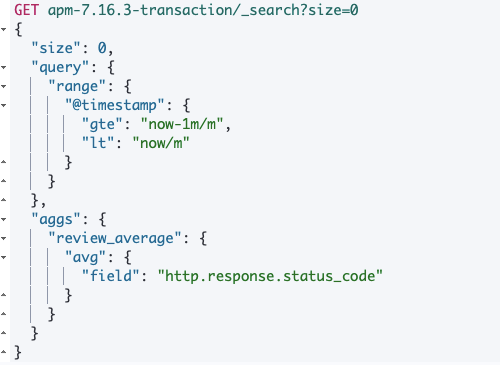 Elastic API Query Example
You will notice in the Argo Rollouts docs Elastic is not listed as an integration, however, we shouldn't worry about that because Argo Rollouts is flexible and there are ways to easily integrate various tools with it.
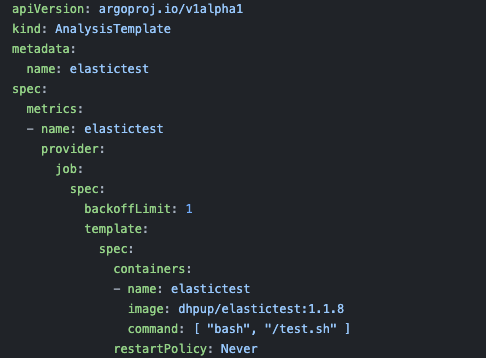
What’s really great is that Argo Rollouts has an analysis method called a **Job **which allows you to use a Kubernetes job as your test.
What I did next was I created a shell script test which queries for that average response code, and if it is greater than my set threshold it returns an exit code. Then I threw that test into a container to later run as part of a Kubernetes job.
Next use Argo Rollouts
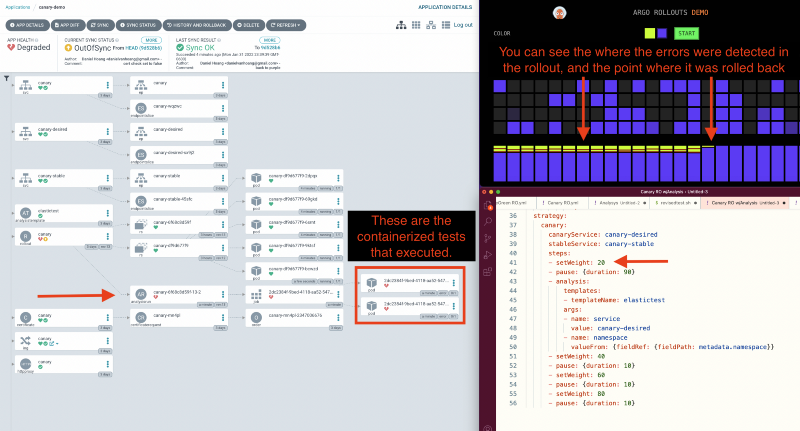
To do this we will be replacing the deployment yaml with an Argo Rollouts yaml, this adds a new section strategy to define the progressive delivery option. You will see that we will be using a canary strategy and pausing for analysis at 20% of the new deployment.
In this example, we’re going to be rolling out this new version to 20% of production customers and based on their experience either rollback or rollout 100% to production. This would be a huge improvement if you’re currently pushing applications from 0-100% in production without any testing at all. However, this model does not work for every company, especially if you have stricter SLA models. If you fall under one of those companies, you may have to consider doing additional testing in other stages, use an atomic switch model like blue/green, or use a service mesh combined with load testing.
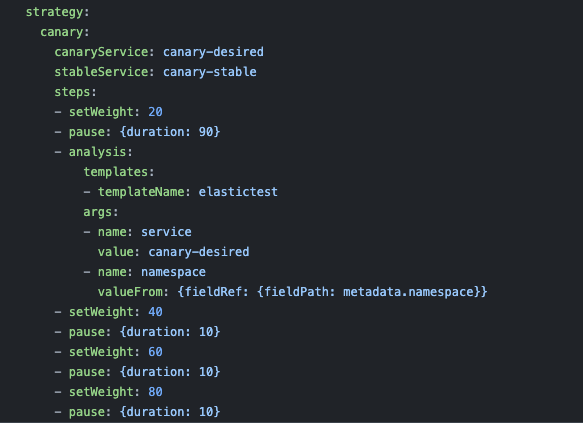
For the analysis step, you will also need to define a YAML.
In this step, I’ve defined the image containing the test, and the commands to execute the test.
Automated deployment verification & rollback
In the picture below you can see it all in action. As the yellow version was slowly rolled out, we ran an analysis. Then, based on the failure of the analysis, we rolled completely back to the color purple. Success!
Combining Argo Project with Elastic Observability is a combo that results in a very strong and capable observability tool. Both Elastic and Argo are extremely flexible in their implementation in terms of API access, and a variety of verification types. I hope this guide helps you in the next part of your CI/CD journey.
If you have any questions feel free to reach out to me on Twitter at @dhpup or check out the Argo Project website.
Share
- Share on Twitter
Share on Twitter
- Share on LinkedIn
Share on LinkedIn
- Share on Facebook
Share on Facebook
- Share by Email
Share by Email
- Print this page
Print