最近、ある顧客のメトリクス・クラスタを「すべてホットティアに格納する」構成からHot/Cold/Frozenアーキテクチャに移行しました。これまでに何十回も実施してきた変更でした。数分のうちに、Logstashはデータの転送を完全に停止しました。
Elasticsearchは、遅れて到着するメトリクスを拒否していました。これらの拒否により、パイプラインが遅延し、結果としてより多くの遅延データが発生し、さらに多くの拒否を引き起こしました。最終的にパイプラインは完全に停止しました。
復旧のためには、スナップショットからの復元、データの再インデックス作成、データ取り込みパイプラインの再設計が必要でした。
根本的な原因はインデックスライフサイクル管理(ILM)自体ではなく、時系列データストリーム(TSDS)と、それらが時間的制約のあるバッキングインデックスを強制する方法にありました。
TSDSは指標のストレージ要件を40〜70%削減できますが、TSDSを効率的にするアーキテクチャの変更により、時間の経過とともにインデックスの動作も変わります。これらの変更は、ILMポリシーを設計する時、またはインジェストパイプラインで遅れて到着するデータが生成される可能性がある場合に重要です。
TL;DR
TSDSを使用する場合:
- バックアップインデックスは、特定の時間枠内でのみ文書を受け付けます。
- 遅延データがインデックスがColdまたはFrozen状態に移行した後に取り込まれた場合、Elasticsearchはそれらのドキュメントを拒否するか、設定されている場合は障害ストアにルーティングします。
デザインルール:
時系列データストリームとは何ですか?
時系列データストリーム(TSDS)は、メトリクスデータに最適化された特殊なデータストリームです。データは関連するドキュメントが同じシャード内に配置されるようにルーティングされ、クエリと検索のための最適化が行われます。Elasticsearchは以下の方法で行います:
各文書には以下が含まれます。
- 1つのタイムスタンプ。
- 時系列を識別するディメンションフィールド。
- 測定値を表すメトリックフィールド。
例:
- ホストあたりのCPU使用率。
- サービスごとのリクエスト遅延。
- センサーごとの温度測定値。
ディメンションは測定したい対象を特定し、メトリクスは時間とともに変化する値を表します。
ディメンション
ディメンションは測定対象を表します。
例:
それらをマッピングで次のように定義します:
メトリクス
メトリクスは数値を表し、以下によって定義されます。
一般的なメトリクスの種類:
- ゲージ:増減する値。
- カウンター:リセットされるまで増加する値。
Elastic Agentは主にメトリクスおよびログデータを収集するため、TSDSのインデックスを手動で有効にしていなくても、クラスター内に存在している場合があります。
_tsidフィールド
Elasticsearchは内部的にディメンションフィールドから _tsid 値を生成します。これにより、同一のディメンションを持つドキュメントを同じシャードにルーティングすることができ、以下が改善されます:
- 圧縮。
- クエリのローカル環境。
- アグリゲーションのパフォーマンス。
主な違い:時間制限付きバッキングインデックス
従来のデータストリームは常に最新のバッキングインデックス(書き込みインデックスと呼ばれる)に書き込みますが、TSDSは異なる動作をします。
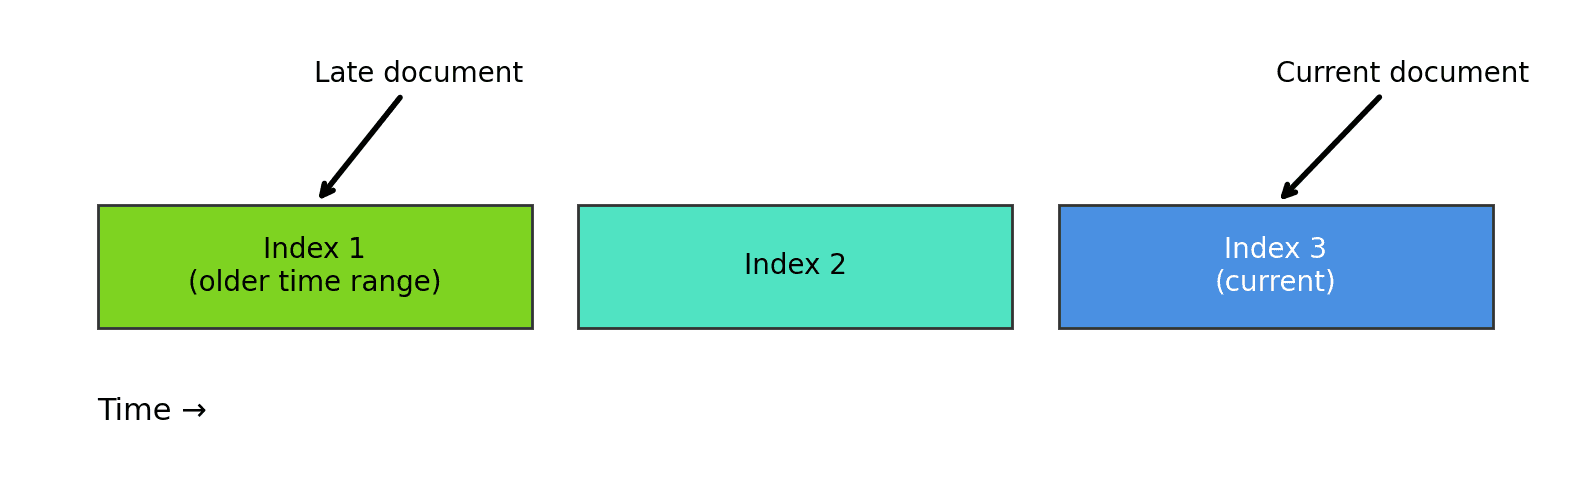
各TSDSバッキングインデックスには定義された時間ウィンドウがあり、そのウィンドウ内に収まる@timestamp値を持つドキュメントのみを受け入れます:
ドキュメントがインデックス化されると、Elasticsearchはそれをタイムスタンプに関わるバッキングインデックスにルーティングします。これは、従来のインデックスとは異なり、TSDSが複数のバッキングインデックスに同時に書き込む可能性があることを意味します。
例:
- リアルタイムデータ → 最新のインデックス。
- 遅延データ → その期間をカバーする以前のインデックス。
遅延データに対応する設計方法
実際のインジェストパイプラインは、ほとんどの場合、完全に期限内に指標を届けるわけではありません。メトリクスは、ネットワークの停止、途中のバックログ、バッチのインジェスト、およびエッジデバイスの損失(これらのデバイスは再接続し、キャッチアップを始めます)によって遅延する可能性があります。
従来のインデックスは、静かにその遅延を吸収しますが、TSDSはしません。
ドキュメントのタイムスタンプが書き込み可能なバッキングインデックスの範囲外にある場合、Elasticsearchはそれを拒否します。これは、ILMポリシーが遅延データを考慮する必要があることを意味します。
重要な制約
バッキングインデックスは遅延データを受け入れられるだけの期間、書き込み可能な状態を維持する必要があります。
実際には、これは次のことを意味します。
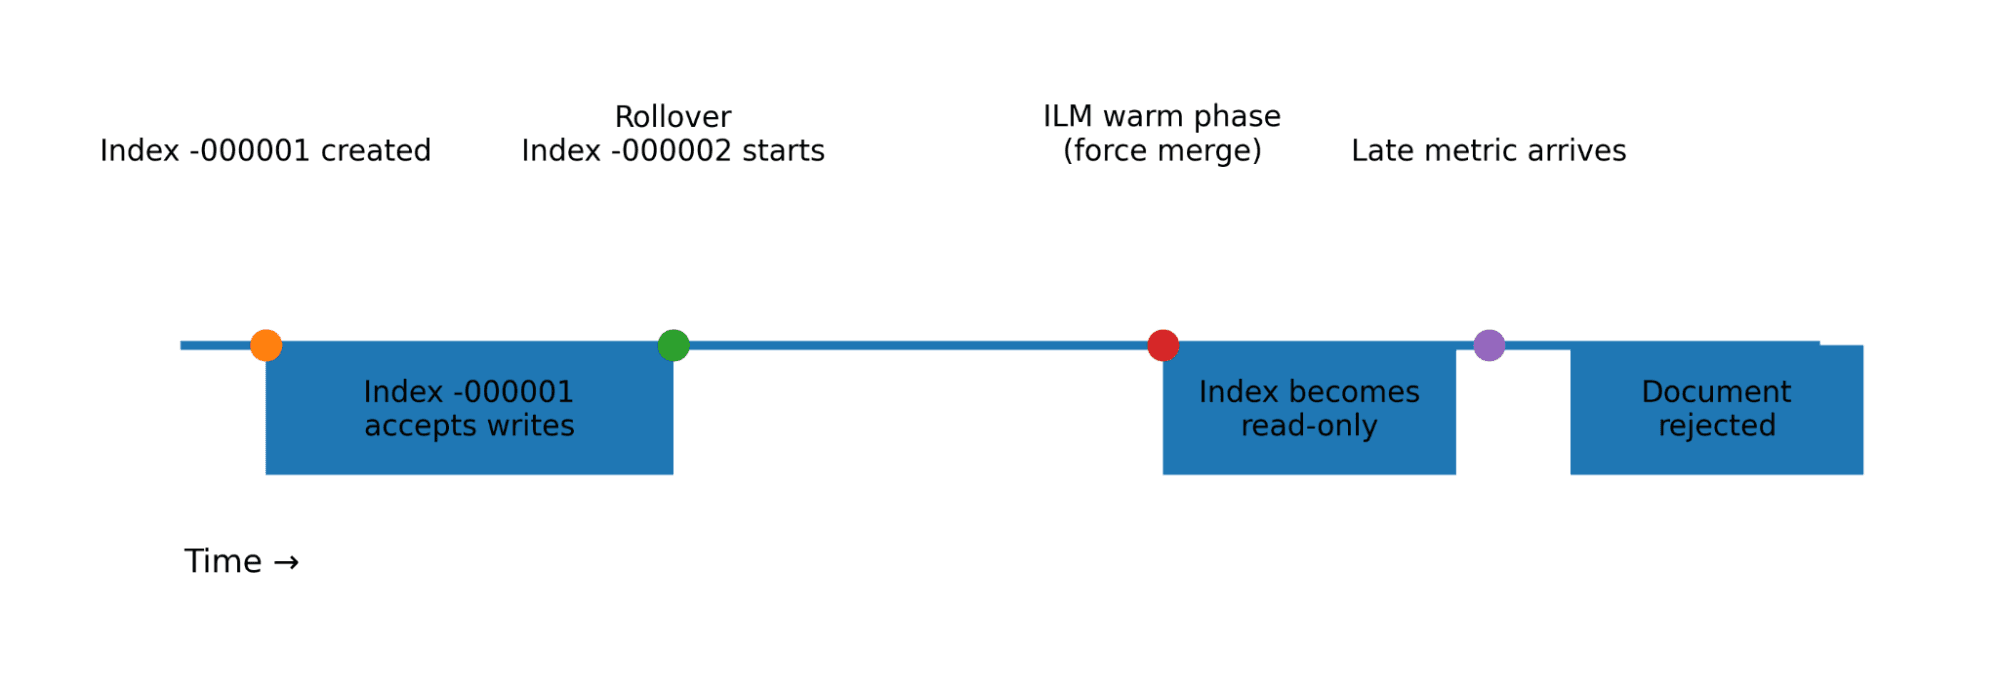
ILMはロールオーバーからの時間経過を測定するため、運用ルールは次のようになります。
たとえば、メトリクスが最大6時間遅延する可能性がある場合、インデックスはロールオーバー後少なくとも6時間は書き込み可能な状態を維持する必要があります。
この制約を考慮しなかったことが、前述のインジェスト障害の正確な原因でした。遅れて到着したデータは、既にColdティアにあり、そのため書き込みがブロックされていた以前のインデックスに向けられていました。
拒否されたドキュメントの処理
TSDS がドキュメントを拒否すると、Elasticsearch は、タイムスタンプが書き込み可能なインデックスの範囲内にないことを示すエラーを返します。インジェストパイプラインがそのエラーをどのように処理するかによって、データを失うか、インジェストが停止するかが決まります。
拒否されたドキュメントを処理する主要なメカニズムは、障害ストアです。
障害ストア(Elasticsearch 9.1以降で推奨)
Elasticsearch 9.1では、拒否されたドキュメントを自動的に格納するfailure storeが導入されました。Elasticsearchは、クライアントにエラーを返す代わりに、失敗したドキュメントをデータストリーム内の専用の障害インデックスに書き込みます。
障害の調査には以下の方法があります。
障害ストアを使用することで、拒否エラーによるインジェストパイプラインの停止を防ぎつつ、障害データを分析または再インデックスのために保存します。
拒否される問題の監視
遅れて到着する問題は通常、最初にインジェスト異常として現れます。最初は、以下によって気付く場合があります:
- インデキシングレートの突然の低下。
- 拒否されたドキュメントの急増。
- 障害ストアエントリ数の増加。
- パイプラインの入力数と出力数の不一致。
これらの兆候に基づいて警告を発することで、オペレーターはパイプラインが停止する前に問題を検知することができます。ワークフロー、機械学習ジョブ、およびその他のメカニズムを使用して、検出と通知を自動化できます。
TSDS + ILMの移行チェックリスト
メトリクスクラスターをTSDSに移行する場合、ILM階層化を導入する場合、またはメトリクスがデフォルトでTSDSであるElasticsearchバージョンにアップグレードする場合は、まずこれらの項目を確認してください。
1. インジェストレイテンシの測定
ILMの方針を変更する前に、以下を決定してください。
- 通常のインジェスト遅延。
- 最悪の場合、インシデント時の遅延。
- バッチパイプラインによる遅延。
ILM設計は、現実的な最大限の遅延に対応する必要があります。
2. インデックス付けの時間ウィンドウを検証する
TSDSのバッキングインデックスを調べます。
以下について探します:
time_series.start_timetime_series.end_time
これらの制限が、どのインデックスがドキュメントを受け入れられるかを決定します。これらのウィンドウを理解することで、データがどのくらい遅れていても拒否されないのかを判断できます。
3. 遅延データを考慮してHotティアのサイズを調整する
遅延データに対しても、バッキングインデックスが書き込める状態を保ちます。
運用ルール:
warm_min_age > rollover_max_age + maximum_expected_lateness
メトリクスが6時間遅れて届く場合、インデックスは少なくとも6時間は書き込める状態を維持する必要があることに留意してください。
4. 拒否されたドキュメントの処理方法を決定する
TSDSを有効にする前に以下のストラテジーを選択します:
- 障害ストア(Elasticsearch 9.1以降で推奨)。
- Logstashのデッドレターキュー。
- 到着が遅れた場合のフォールバックインデックス。
- 限定的なデータ損失を受け入れる。
5. インジェストの正常性を監視する
以下のアラートを追加します:
- インデキシングの速度低下。
- 却下された書類。
- ストアの拡大失敗。
- パイプラインの入力と出力の不一致。
遅延データの問題は、多くの場合、インジェスト時の異常として最初に現れます。
まとめ
時系列データストリームは、メトリックワークロードに対して主要なストレージとパフォーマンスの改善を提供しますが、重要なアーキテクチャ上の変更も導入します。バッキングインデックスには時間的な制約があり、これがILMの動作に影響します。
TSDSを使用する場合:
- インデックスは、遅延データを受け入れられるだけの期間、書き込み可能な状態を維持する必要があります。
- インジェストパイプラインは、拒否されたドキュメントを安全に処理する必要があります。
留意する重要なルールは次の通りです:
その制約に基づいてILMポリシーを設計すると、TSDSはメトリクスのワークロードに非常に適しています。
無視した場合、インジェストパイプラインがその時間的制約によって機能不全に陥る可能性があります。
関連記事
2026年4月23日
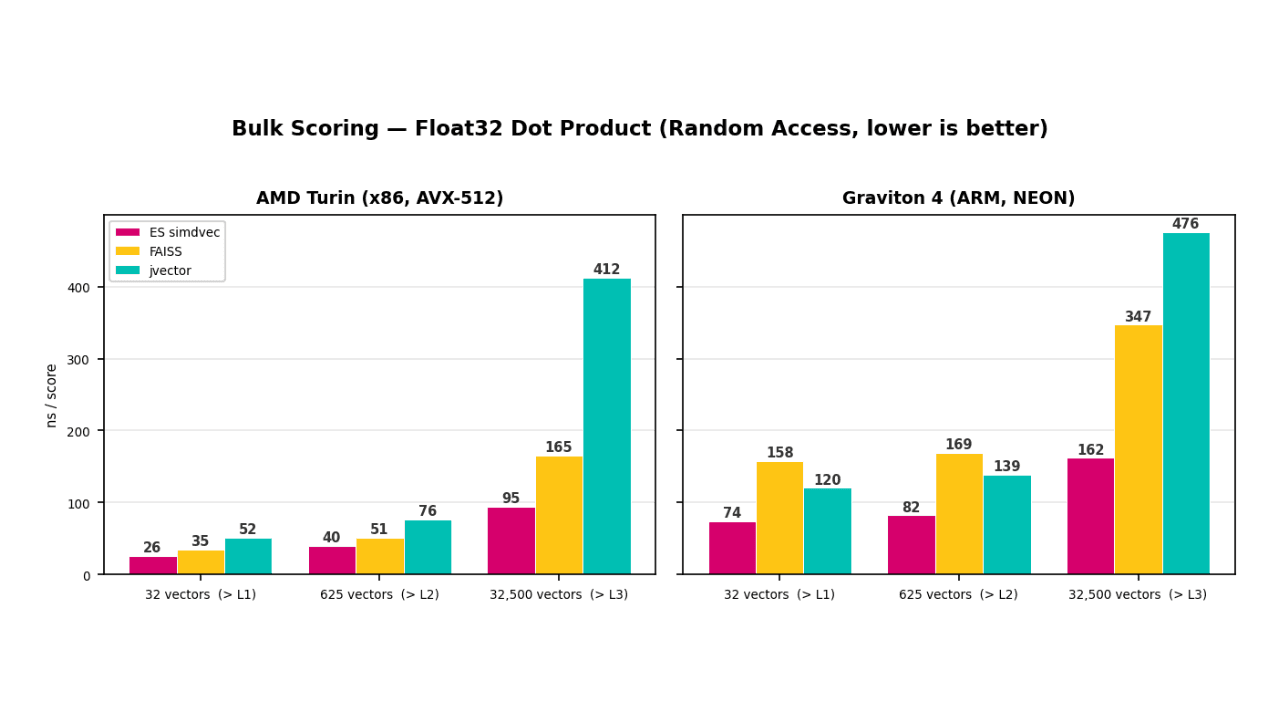
ベクトル検索を世界最速のものにするためにElasticsearch simdvecを構築した方法
Elasticsearchのすべてのベクトル検索クエリの基盤となる、手作業で調整されたSIMDカーネルライブラリElasticsearch simdvecの構築方法。
2026年5月4日
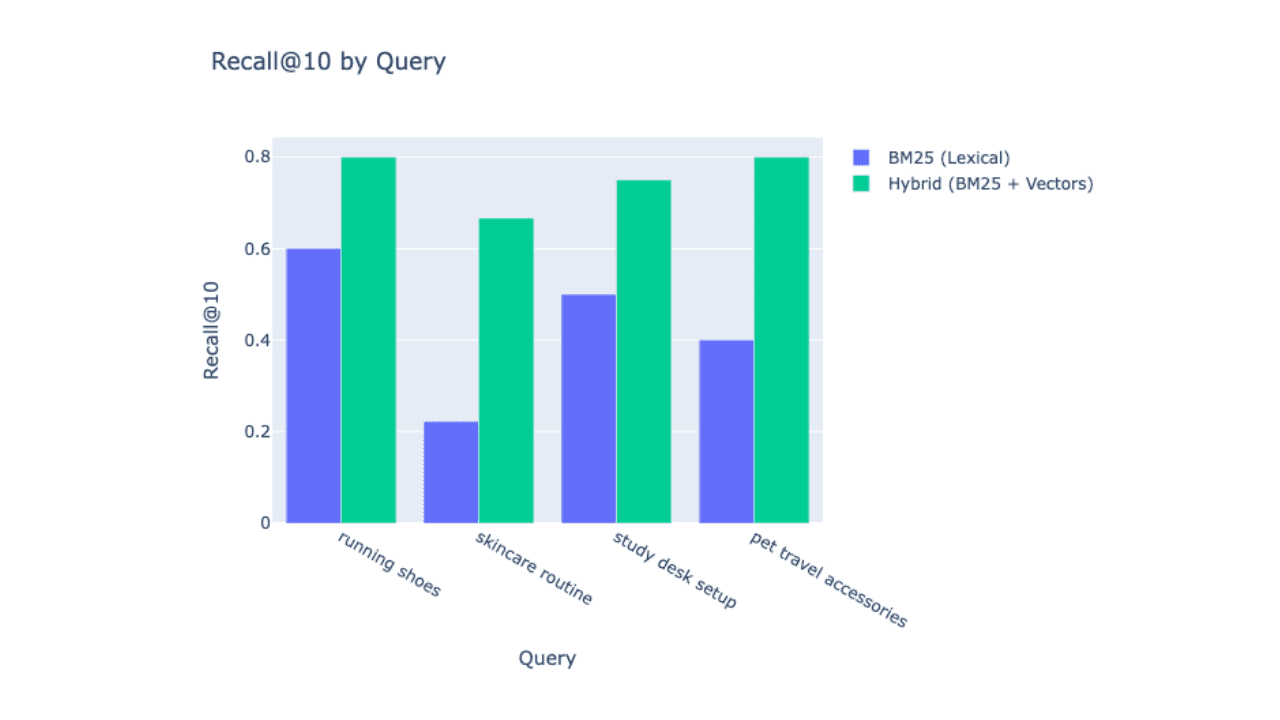
Elasticsearchの検索再現率を測定・改善する方法:ハイブリッド検索で0.43から0.75へ
Elasticsearchにおける検索再現率を測定および改善する方法を学びましょう。BM25の語彙検索とJina AIのベクトル埋め込みを組み合わせ、rank_eval APIを使用して実際の数値で改善効果を検証します。
2026年4月10日
Elasticsearch + Jina埋め込みによる教師なし文書クラスタリング
ElasticsearchとJina埋め込みを使用した教師なし文書クラスタリングへの実用的で再現可能なアプローチ。
2026年4月1日
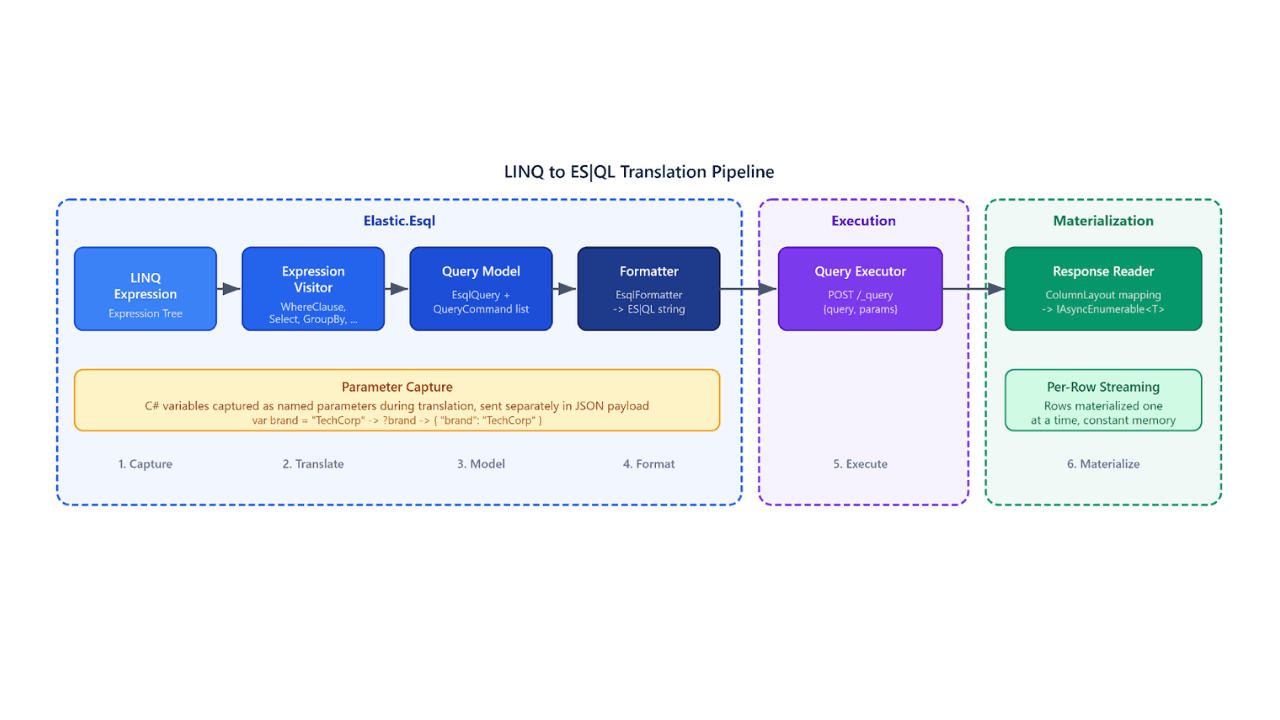
LINQ to Elasticsearch ES|QL:C#を記述してElasticsearchをクエリ
Elasticsearch .NETクライアントに新しく追加されたLINQ to Elasticsearch ES|QLプロバイダをご紹介します。C#コードを自動的にES|QLクエリに変換できます。
