Elastic on Elastic: Securing our endpoints with Elastic Security
Editor's Note: With the release of Elastic Stack 7.11, the new alerting framework is now generally available. In addition to existing connectors to 3rd party platforms like Slack PagerDuty, and Servicenow, 7.11 adds Microsoft Teams to the list of built-in alerting integrations. Read more about this update in our alerting release blog.
This blog post is one in an occasional series about how we at Elastic embrace our own technology.
The Elastic InfoSec team is responsible for securing Elastic and responding to threats. We use our products everywhere we can — and for more than just logs. By harnessing the power and breadth of capabilities of the Elastic Stack, we are working on tracking risk and performance metrics, threat intelligence, our control framework, and control conformance information within Elastic.
Security has been and continues to be a top priority internally as well as in the products we develop and deliver. We’ve doubled down on these efforts when we joined forces with Endgame to craft Elastic Endpoint Security, and with Perched to help create Elastic SIEM. Teaming up with these companies brought a whole new set of security professionals to the Elastic organization. Each professional brings a diverse set of skills and experiences that we can lean on to help protect our organization using our own security products — Elastic Endpoint Security and Elastic SIEM.
Our internal use of the Elastic Security solution has increased the Elastic InfoSec team’s level of visibility and has exponentially expanded its response capabilities to more fully empower the broader organization to protect the Elastic enterprise from the threats of today and tomorrow. For our Elastic community of users and customers, this also translates to us delivering a better, leading security solution.
We are excited to share our story….
“Customer Zero”
We have the expressed goal of being Customer Zero for all of our solutions, and this applies especially to Elastic Security. To ensure that what we deploy to our customers has been tested in a real production environment before it gets distributed more broadly, we’re an early adopter of build candidate (pre-release) versions of the Elastic Stack and each of our solution deployments.
We’re excited about having an industry-leading Endpoint Detection and Response (EDR) tool available to use within our environment. You can read all about the effectiveness of Elastic Endpoint Security solution in third-party reports from NSS Labs, Gartner, and AV Comparatives in this post.
Having leading detection and response capabilities on the endpoint is great on its own, but we’re really thrilled by the possibilities that come with its native integration with the Elastic Stack and Elastic SIEM.
It’s remarkable to have the ability to create automated responses and advanced analytics in addition to having the data and visuals we as analysts need — all in a single platform.
Piloting Elastic Endpoint Security
Replacing an endpoint security agent is not a task that is frequently undertaken, and it often comes with unexpected challenges. So when we announced our intent to bring Endgame into the Elastic fold, we immediately began planning our migration from CrowdStrike to Elastic Endpoint Security (formerly Endgame).
After officially joining forces with Endgame, we began to deploy the Sensor Management Platform (SMP) for our end user pilot. We were easily able to import our whitelist and trusted applications that we had previously configured in CrowdStrike. Then, we created a single detection policy within the SMP and enabled all threat and adversary behavior detections. We also enabled all event collection features and set up event streaming to Elasticsearch.
We ran the pilot on a small percentage of endpoints in a detect-only mode for a little more than a week. With our pilot users streaming endpoint data back to the SMP and to our endpoint monitoring Elasticsearch cluster, we began migrating our existing Auditbeat and Winlogbeat dashboards, queries, and Watcher alerts to use the endpoint index. The data received via the endpoint agent is similar to the data collected by Auditbeat and Winlogbeat without having to manage yaml configurations.
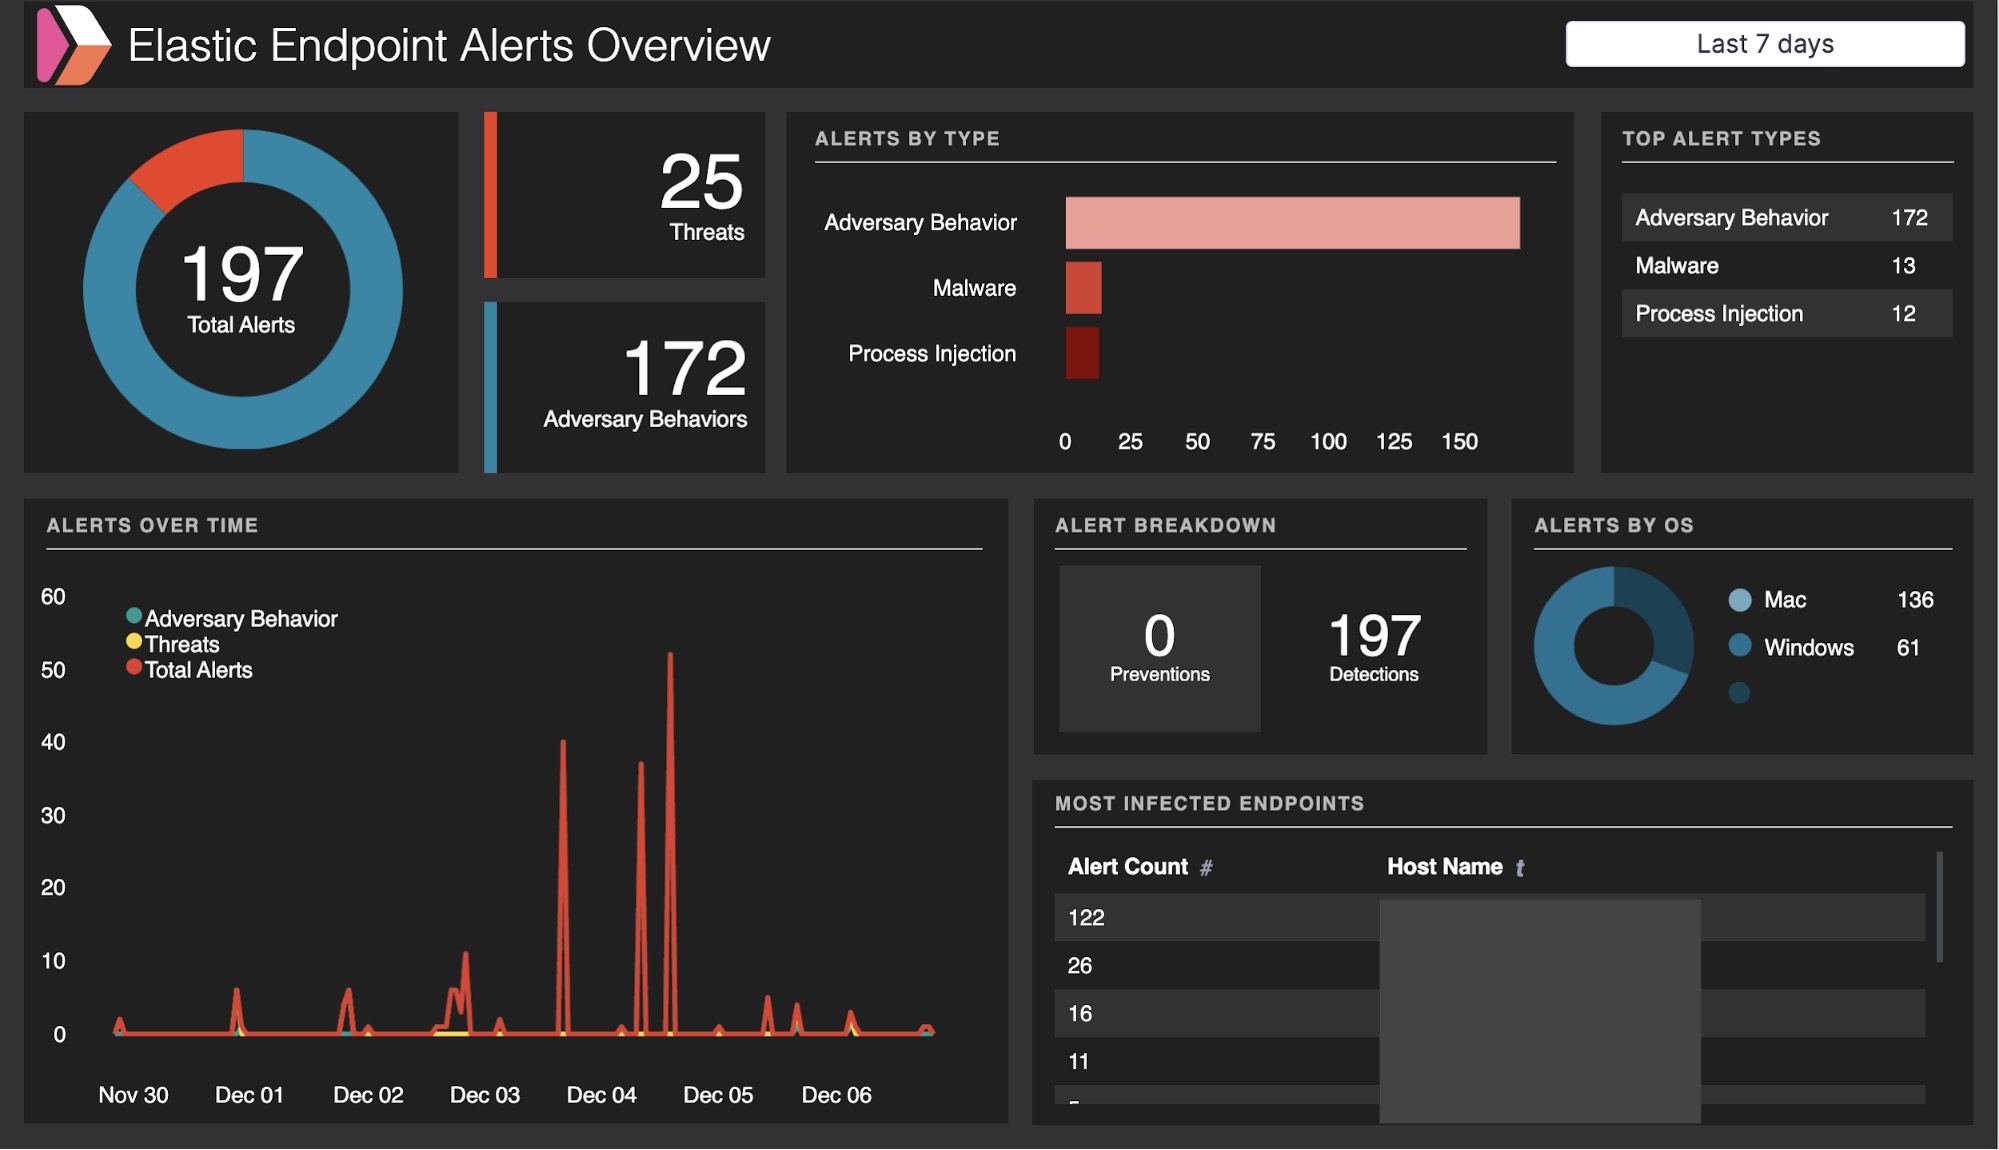
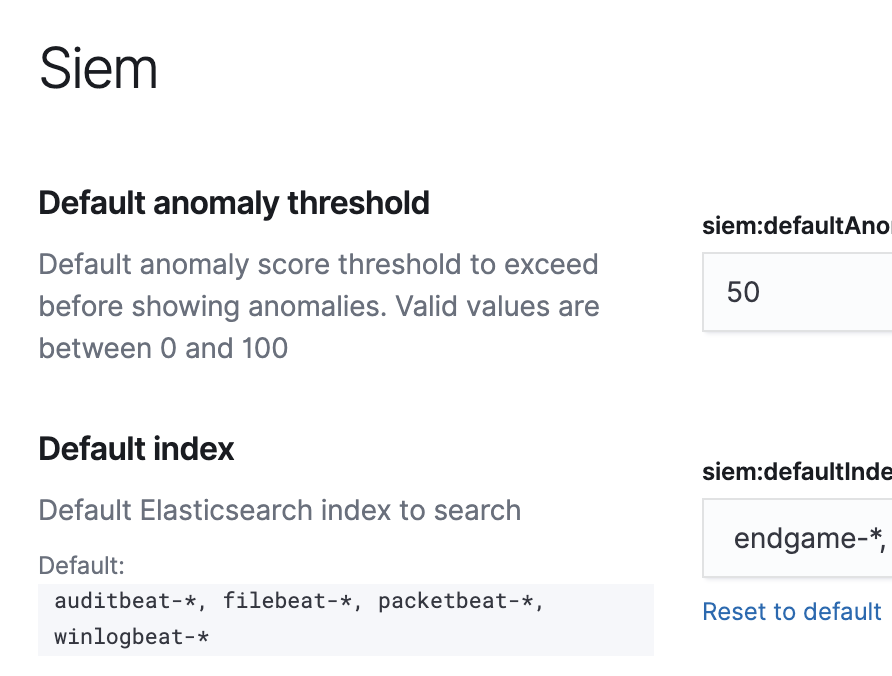
Investigating with Elastic SIEM
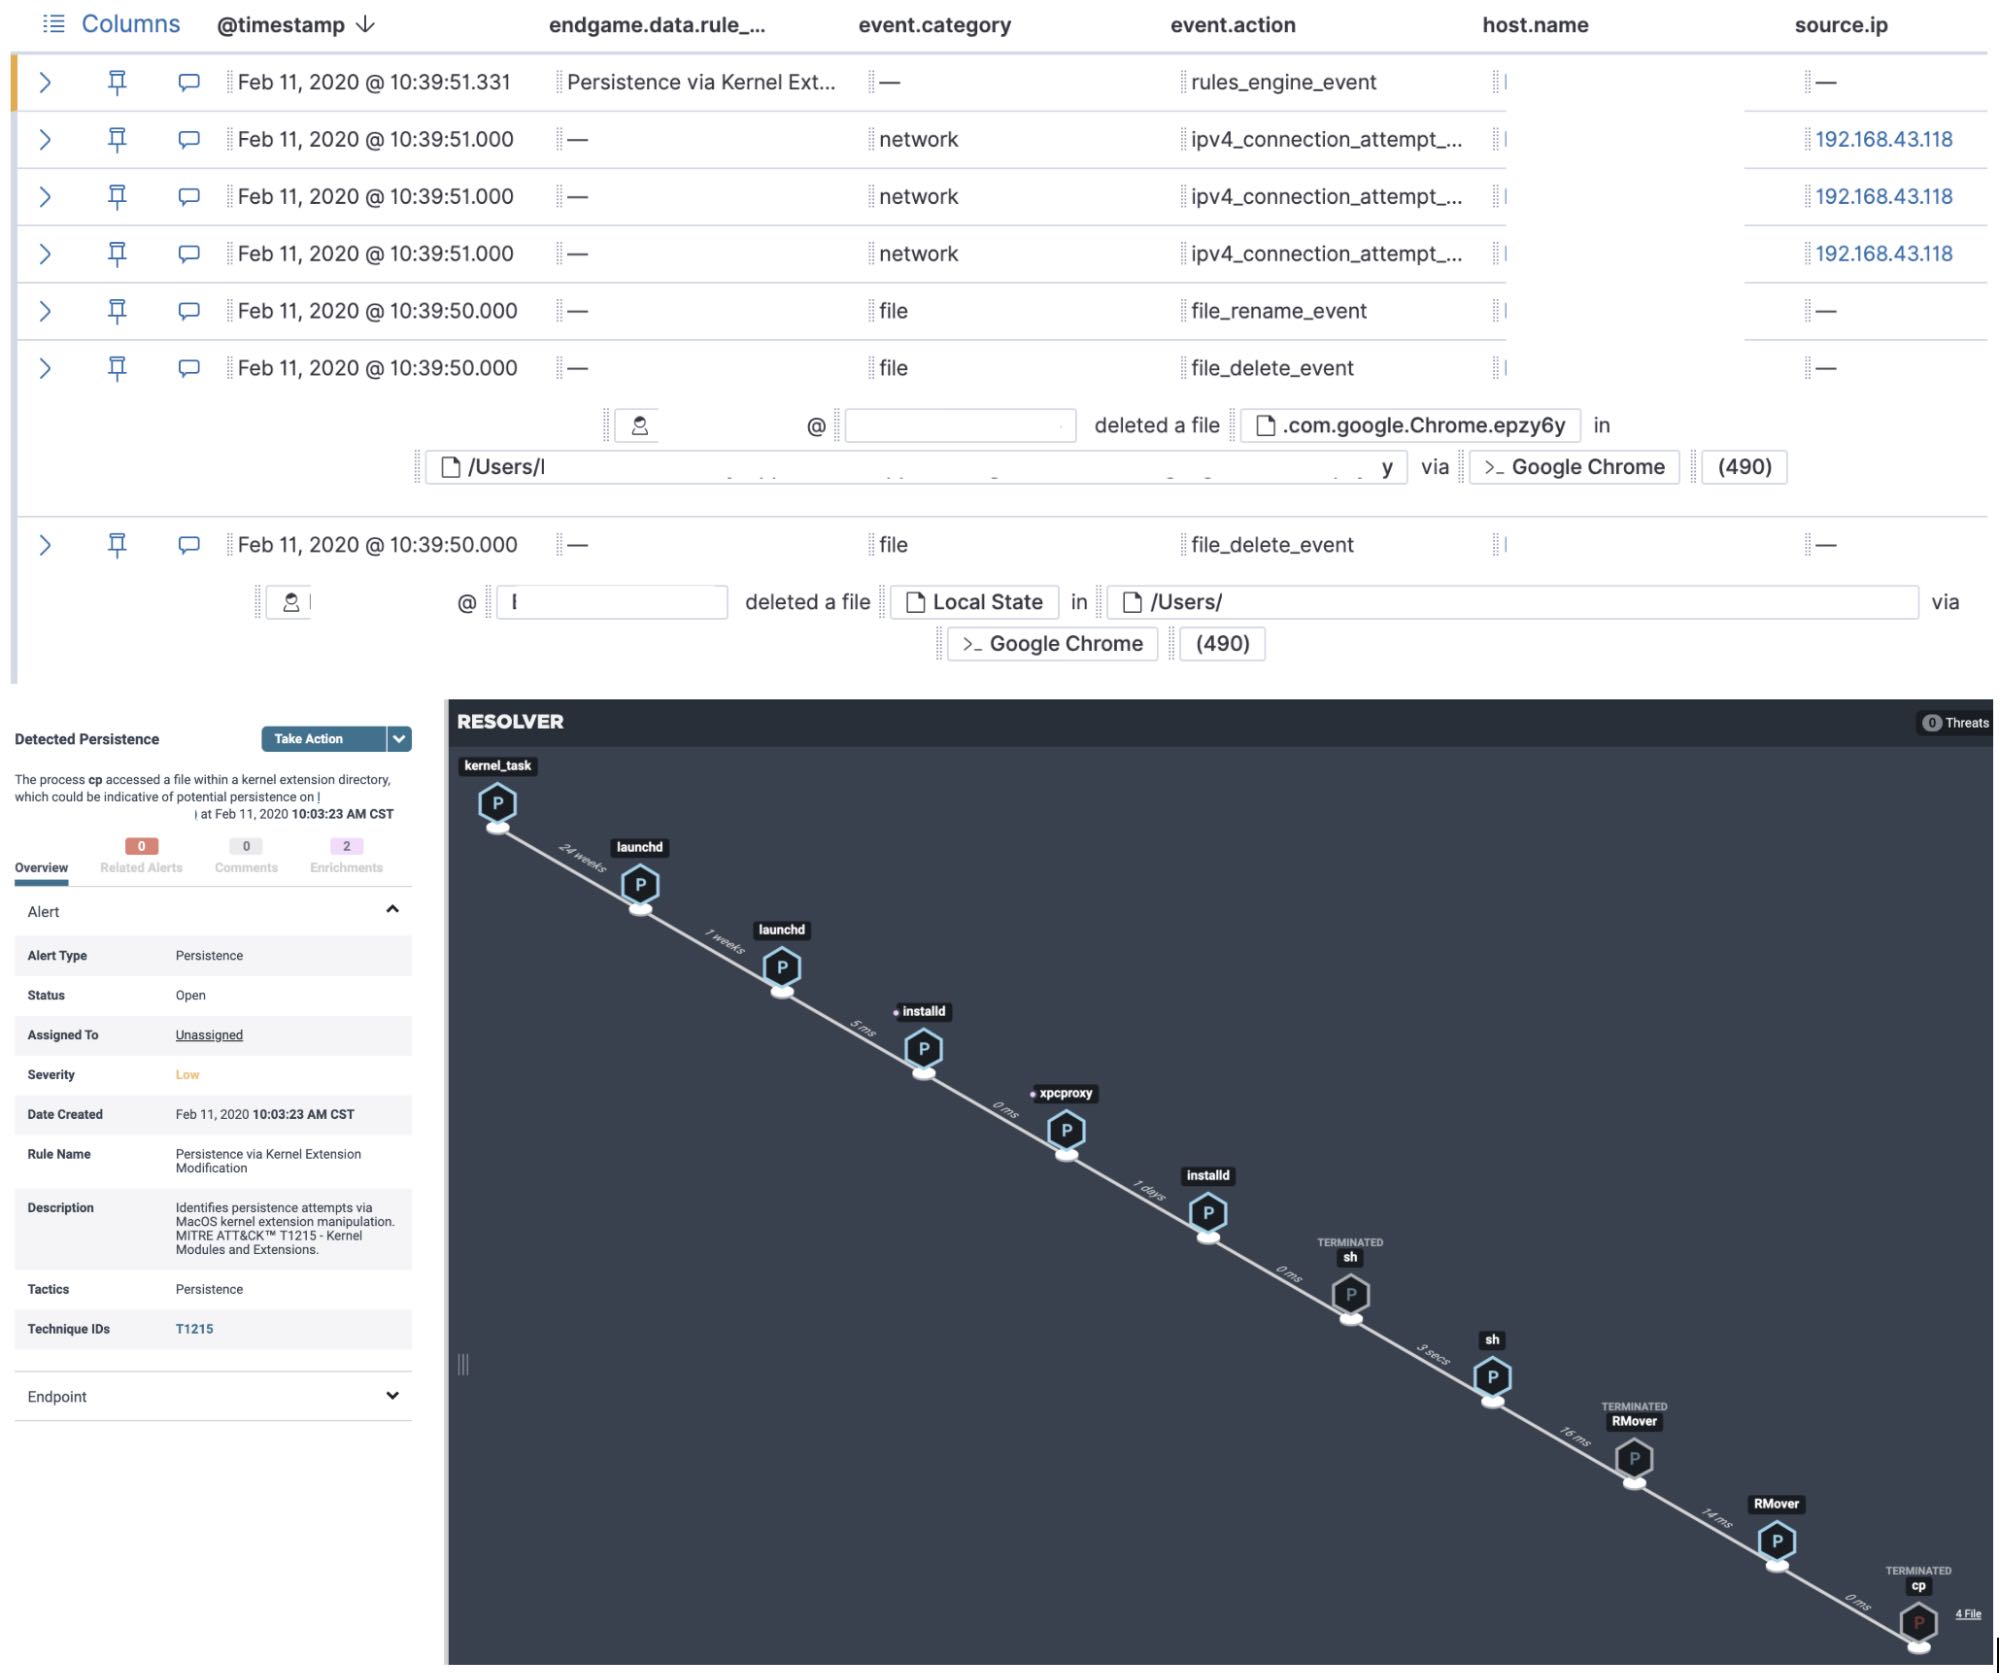
We were then ready to perform investigations in the Elastic SIEM app by simply adding the “endgame-*” index pattern to the default index for SIEM in Kibana. Investigating Elastic Endpoint Security alerts or other anomalous behavior in the SIEM app is easy with Timeline. Timeline allows us to stitch together processes by process ancestry similar to the ResolverTM view within the management console. It also allows us to see a population of events and data (process names, process arguments, etc.) across our entire endpoint fleet with the speed of Elasticsearch.
During the pilot, we had a single malware detection on one of our Mac workstations that had been present on the system with CrowdStrike installed. We were able to use the response capability in Elastic Endpoint Security to remotely remediate the malware with minimal impact and downtime to the impacted user. The user was actually able to continue working; the only interruption experienced was us telling them we were remotely working on their laptop.
We were very happy with how easy it was to remove a fairly complex piece of malware that had several persistence mechanisms.
We’re a distributed organization with currently 1,900+ Elasticians located across 40+ countries, and a lot of our employees rarely, if ever, find themselves in an Elastic office. With this in mind, we were impressed with the Elastic Security solution’s ability to enable an Elastic analyst sitting in their house in Germany to successfully remediate malware on the device of a Tennessee-based employee. This was not a capability we had on Macs before installing Elastic Endpoint Security.
Deploying Elastic Endpoint Security
After the pilot period, we deployed the Endpoint agent to the remainder of the endpoint fleet in detect mode over a period of five days while removing CrowdStrike at the same time. During this period, we deployed to 1800+ endpoints — our fleet of user devices at that point in time — with no reported issues from any of our fellow Elastician users. If you’ve ever deployed an agent to user endpoints (especially security agents), you know it never goes this smoothly. But for us, it did.
Once we rolled out to the fleet at large, we had 23 systems report malicious files that needed to be remediated. The surprising part for us was the extremely low false positive rate on threat detections.
The Adversary Behavior detections, however, were noisier and filled with false positives because of the diverse skill sets, and subsequent behavioral trends, of our Elasticians. We saw things like Elastic security professionals conducting research and exploit proof of concepts, developers creating software, and sales architects running containers and other interesting tools. Our initial pilot users, along with the 23 systems that had true positive threat detections, were moved into prevent mode in less than a month with no reported impact.
Shortly after moving the pilot users to prevent mode, we migrated the entire fleet of user devices to prevent mode with zero reported issues.
The difference in visibility we now have into our endpoints is amazing. We can be using remote response on an endpoint across the globe and see the signals from the endpoint in both the endpoint console and in Kibana — in close to real time. The level of detail in the signals is better than we have typically seen with other endpoint security tools we’ve used in the past.
From Elastic workstation to server fleet protection and beyond
Now that our Elastic workstations are fully protected by Elastic Endpoint Security, we have begun our pilot of placing the Elastic Endpoint Security agent on our server fleet. We’ll be targeting all our server resources that bring you Elastic Cloud and enable us to deliver the Elastic Stack.
This rollout will probably take a bit more time than our endpoint rollout. We have a broader set of operating systems and cloud providers to test on than we did for workstations, but we’ll get there soon enough.
We’re excited to continue using the Elastic Security solution and all the integrations it has with the Elastic Stack. We’ll keep providing feedback directly to the Elastic teams working on the product, workflows, and integrations. We see this as a really great internal partnership.
Best of all, we’ll continue being Customer Zero so that our customers can benefit from well-tested and thoroughly deployed Elastic solutions and products.
Mandy Andress is CISO at Elastic; Darren LaCasse is Principal Analytics and Detection Lead I at Elastic; and Brian Milbier is Principal Security Assurance Analyst I at Elastic.