Elastic Observability: A solution for today’s “always-on” world
.jpg)
Our lives are completely controlled by applications. Whether it's for business or personal use, we expect these applications to be “always-on” with an ability to have immediate responses. These high expectations create an enormous set of demands on developers and operations staff.
Managing these applications requires SREs to analyze enormous amounts of data from not only the application, but also the infrastructure it's running on. Additionally, SREs ensure the proper tools are utilized (or built) in their operational processes. Hence, managing the exponential data growth, resolving daily issues, and constantly grappling with tools and operation processes leaves limited time to understand business performance.
With Elastic Observability, SREs can not only consolidate and analyze all telemetry data but they can also combine business data to help drive operational excellence, increase productivity, and obtain valuable insights.
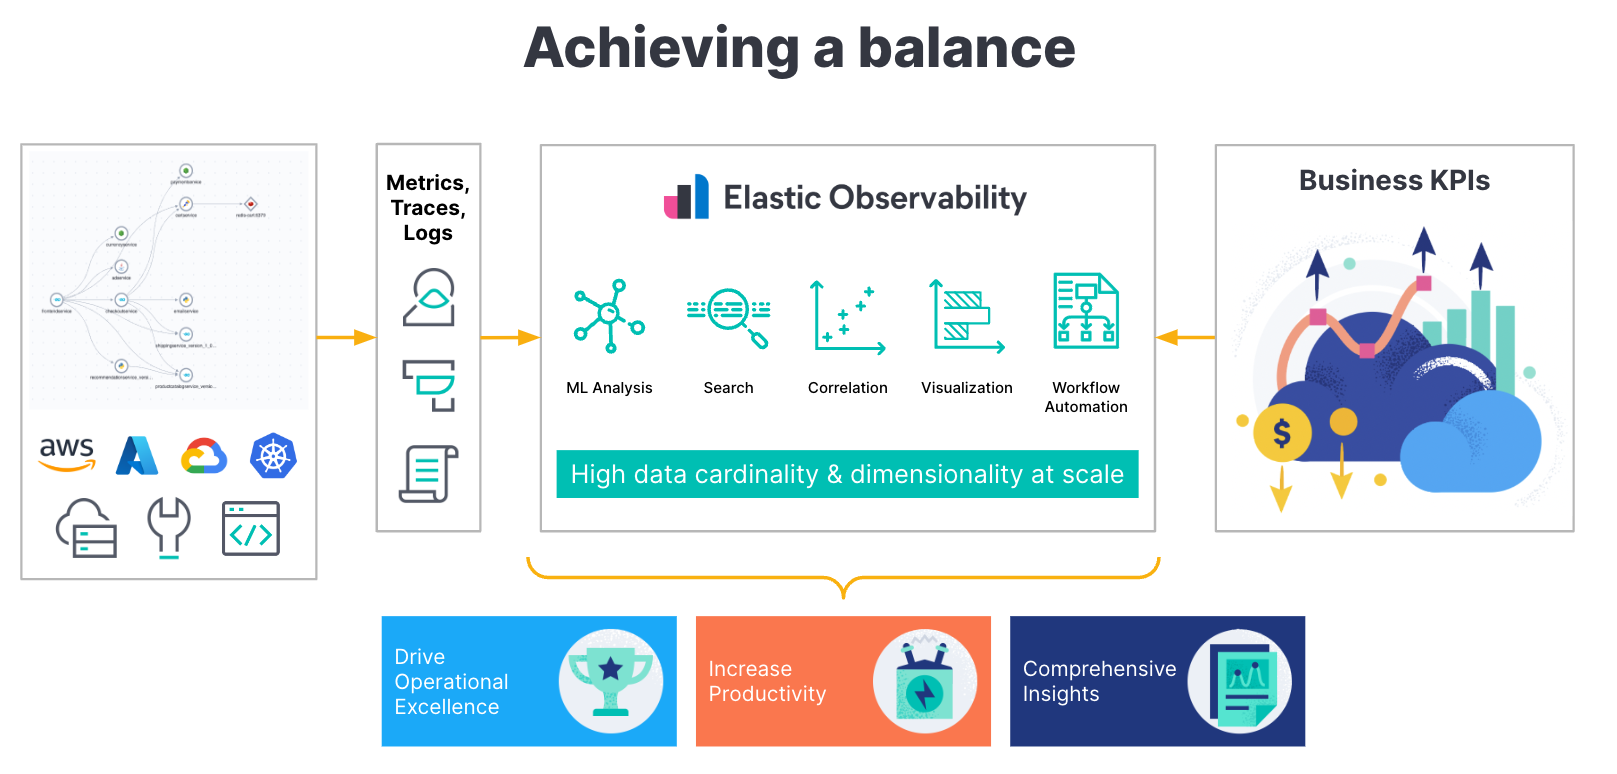
Elastic Observability is built on the Elastic Stack, a proven, search-based solution used by customers all over the world in mission-critical applications. Elastic Observability leverages 10 years of machine learning (ML) development to help SREs monitor, aggregate, and gain insights across cloud-native and distributed systems in one solution. Elastic Observability manages high cardinality and high dimensionality data at scale, to help break silos and bring together application, infrastructure, and user telemetry data for end-to-end observability on a single platform.
As a single platform, Elastic helps SREs correlate limitless telemetry data, including metrics, logs, and traces, using the power of search to break down silos and turn data into insights. As a full-stack observability solution, everything from infrastructure monitoring to log monitoring and application performance monitoring (APM) can be found in a single, unified experience.
Elastic Observability provides visibility into cloud environments like AWS, Microsoft Azure, and Google Cloud, with integrations built for seamless data ingestion. Elastic Observability also supports cloud-native and microservice technologies like Kubernetes and serverless to enable adoption with confidence. With its open source roots, Elastic supports the most recent and popular open source projects like OpenTelemetry, which is standardizing observability ingestion.
The power and flexibility of the Elastic Stack allows SREs to get a complete picture from application to infrastructure while also helping them manage business performance.
Achieving operational excellence with Elastic Observability
As an SRE, you have to manage complex distributed environments with telemetry being gathered from multiple locations: business insights, applications (front end and back end components), infrastructure, and even DevOps tooling.
While getting the data is important, it's really specific operations questions that need answering, such as: Is customer experience degrading? What is the application's throughput, latency, etc.? Is my infrastructure optimized? Are we spending too much money? Are dev pipelines optimized? Observability telemetry data can help answer these questions and much more.
Elastic provides the following capabilities to help ingest and aggregate data from multiple locations, including business insights:
- Elastic Synthetic Monitoring - Monitor customer journeys and understand the impact of web/front end performance on user experience. Get complete visibility and catch problems into your website performance and availability from an external perspective before your customers do.
- Elastic APM with native OpenTelemetry support - Get deep visibility into your cloud-native and distributed applications — from microservices to serverless architectures — and quickly identify and resolve root causes of issues. Seamlessly adopt APM to automatically identify anomalies, map service dependencies, and simplify investigations into outliers and abnormal behavior. Optimize your application code with extensive support for popular languages with native OpenTelemetry support.
- Elastic integrations - Elastic has over 350 out-of-the-box integrations that make data ingestion and connecting to other data sources easy. Once your data is in Elasticsearch, you can visualize and gain initial insights in minutes. These integrations help you ingest data from your application services, cloud service provider (AWS/Azure/GCP), Kubernetes, serverless, databases, Kafka, RabbitMQ, dev tools (Jenkins, Snyk, Github), Salesforce (beta), and much more.
- Custom data ingestion - Elastic also allows you to bring in customized data and process, store, and analyze it in Elastic.
- Universal Profiling™ - Profile everything. Everywhere. All at once. Get whole system visibility into complex, cloud-native environments with frictionless, always-on profiling based on eBPF technology. Optimize performance at all levels of your application, services, and infrastructure with no instrumentation needed.
These capabilities, coupled with Elastic Observability’s search, machine learning, and analytics, will help SREs pinpoint and find answers to the questions we mentioned earlier. However, understanding overall operational performance, such as how you are trending, are you operationally efficient, and are you meeting business objectives, is harder to obtain or even complete. SREs don’t have the time nor can they easily aggregate, consolidate, and correlate telemetry data with business insights to provide a complete operational picture.
To address this challenge, Elastic is releasing an SLO/SLI monitoring capability to help SREs manage and obtain insights into business performance.
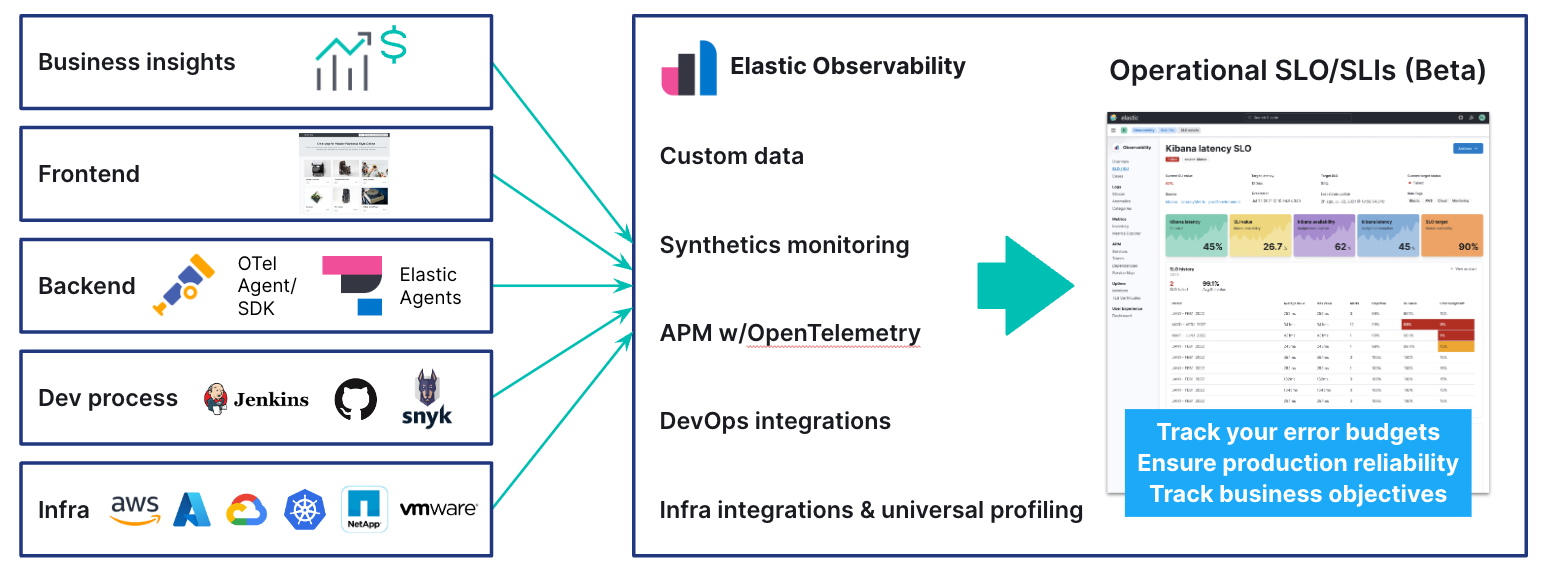
Elastic’s new SLO capabilities will help you:
- Define your SLOs with custom configurations - Allow you to choose latency, availability, or create custom KQL based SLOs. Additionally, you can manage occurrence based or time-slice based budgeting, rolling or calendar based time windows to measure your SLOs.
- Monitor and track your SLOs - Understand all your SLO values, the current budget, health indication, alerts. Even drill down into a specific SLO to get details and understand trends. You can even pivot in context to APM and other parts of Elastic Observability.
- Alert on your SLOs - Alert on SLO violations by defining budget burn rates or using pre populated defaults for burn rate thresholds.
Elastic’s SLO capability is in beta, so please contact your sales representative to gain access.
One additional goal that should be considered for operational excellence is cost. Elastic Observability can help achieve cost efficiency with its Time Series Database (TSDB). While Elastic’s TSDB aids in not only providing a single view across metrics, logs, and traces, along with better insights through analytics, it also improves storage efficiency through its ability to downsample and reduce storage costs of telemetry data. Elastic not only collects and aggregates high volume telemetry data but it also stores it extremely efficiently to improve and achieve your operational cost metrics.
Increasing team productivity with data context and machine learning
Ultimately, you want to increase your productivity and reduce your mean time to happy hour (MTTH). You want to focus on product and operations — the question is always, how?
At a baseline, an SRE has multiple tools at their disposal. Teams typically have simple or complex alerting, use dashboards to help visualize and aggregate data (and continuously change these to suit their needs), and utilize mechanisms to discover and simply analyze their data.
However, these current baseline methods are sufficient. They don’t always help you manage the two main SRE concerns:
- Improve predictability - Finding issues after the fact is the norm, but being able to prevent or even predict them is ideal in preventing potential issues. But how and with what?
- Reduce MTTx - Whether it's mean time to repair, response, or failure, as an SRE your ultimate goal is to not only find the issue but repair and ensure customer experience has improved.
Elastic Observability goes beyond the basics to help you improve predictability and reduce MTTx. These two advanced capabilities are:
All of your observability data in context
Elastic not only provides you with the data that is gathered, but also provides additional contextual information with it. Several examples:
Integrated full stack views - Provides the ability to view application telemetry in conjunction with infrastructure telemetry. In Elastic APM, when analyzing a trace, you can see not only trace-specific metrics and logs, but also the related Kubernetes pod/container metrics and logs.
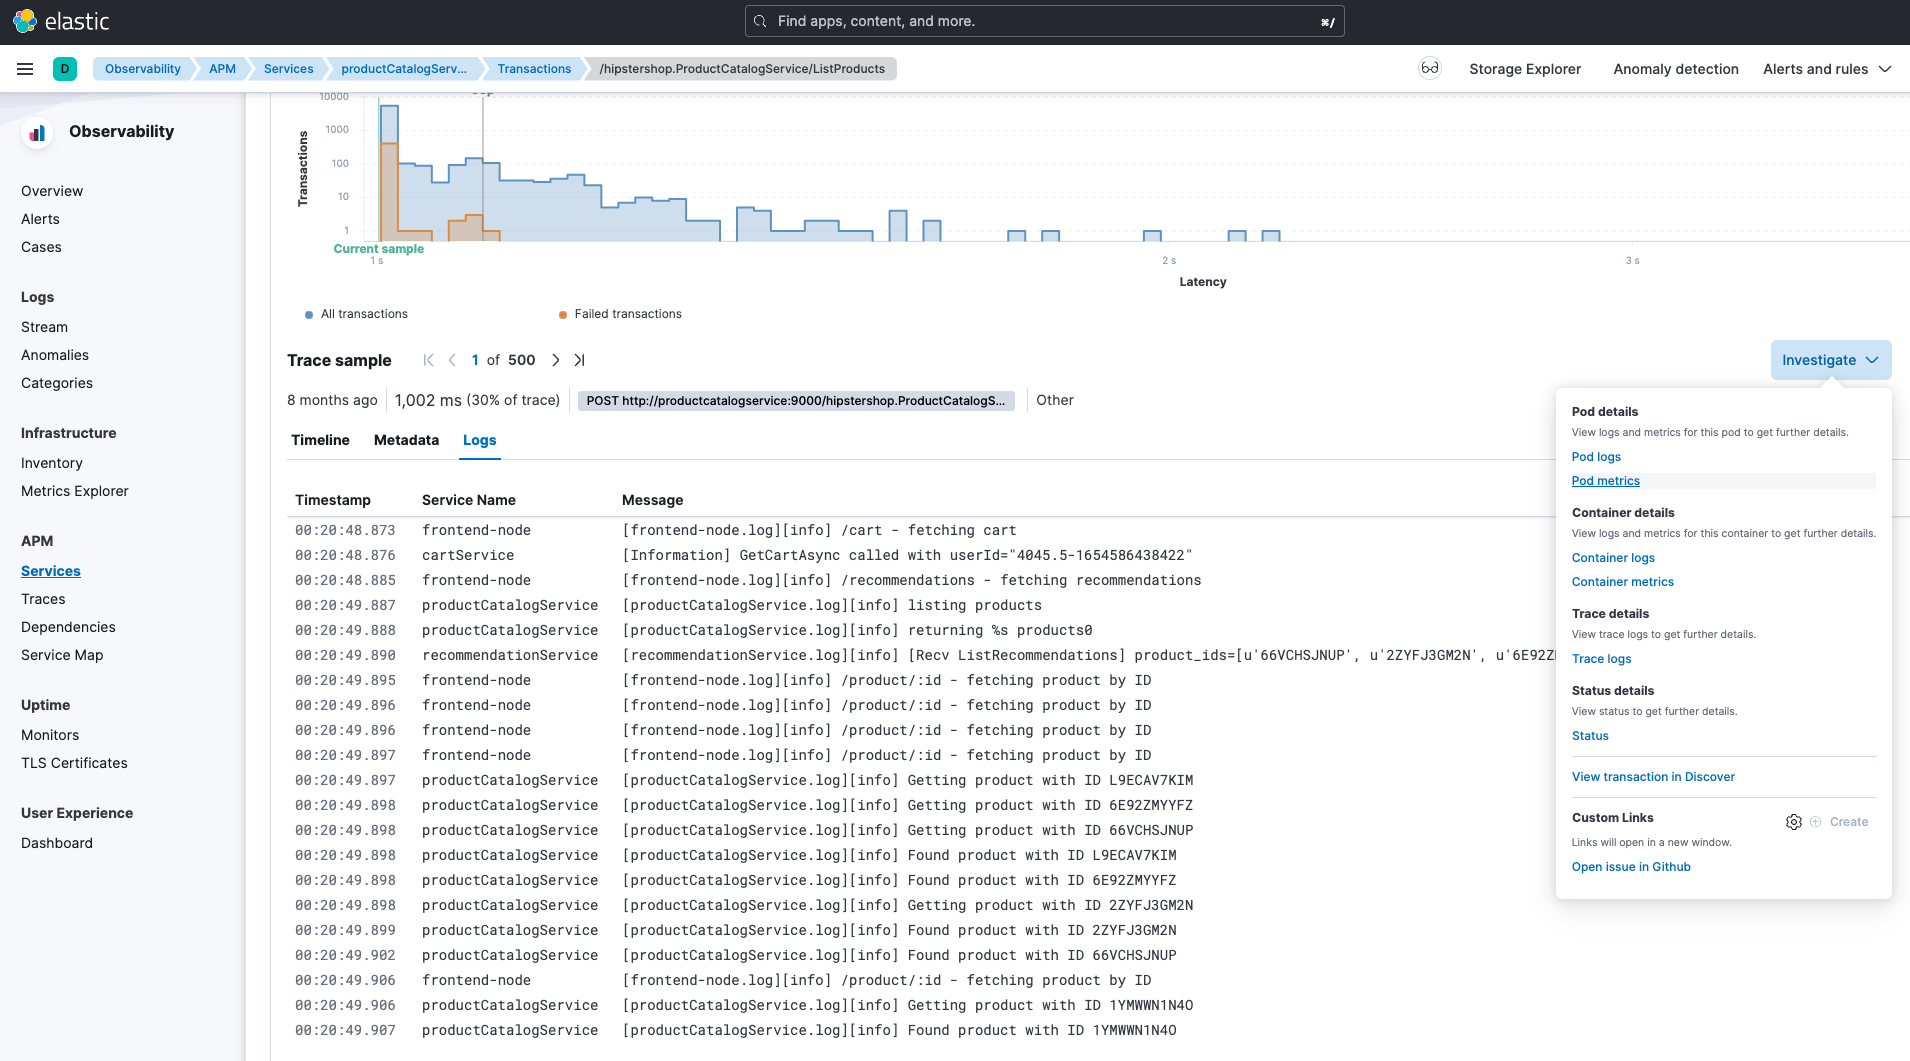
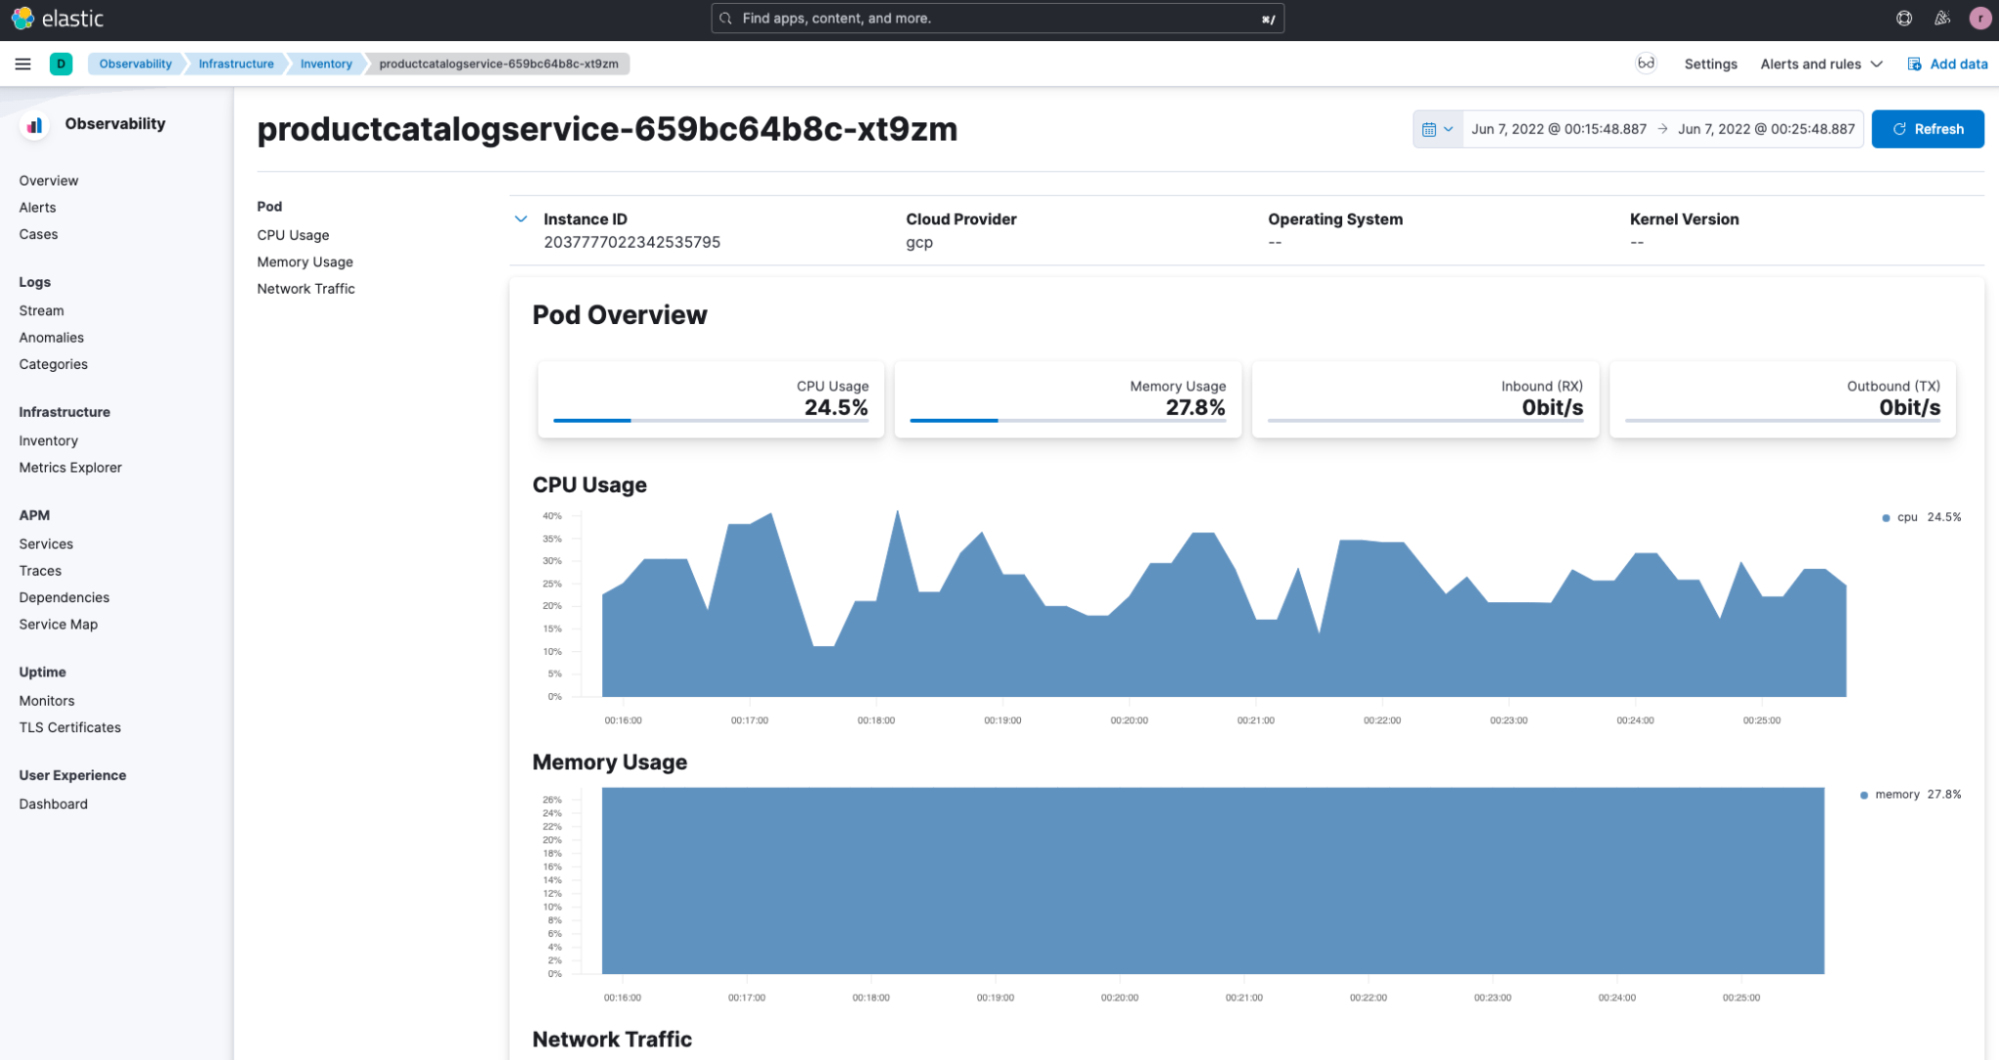
Actionable insights - When an alert occurs, you just get a simple message and a discovery process begins. Elastic recently released a capability to provide additional context to reduce the need for manual discovery. You can potentially get all the right diagnostic information at one location.
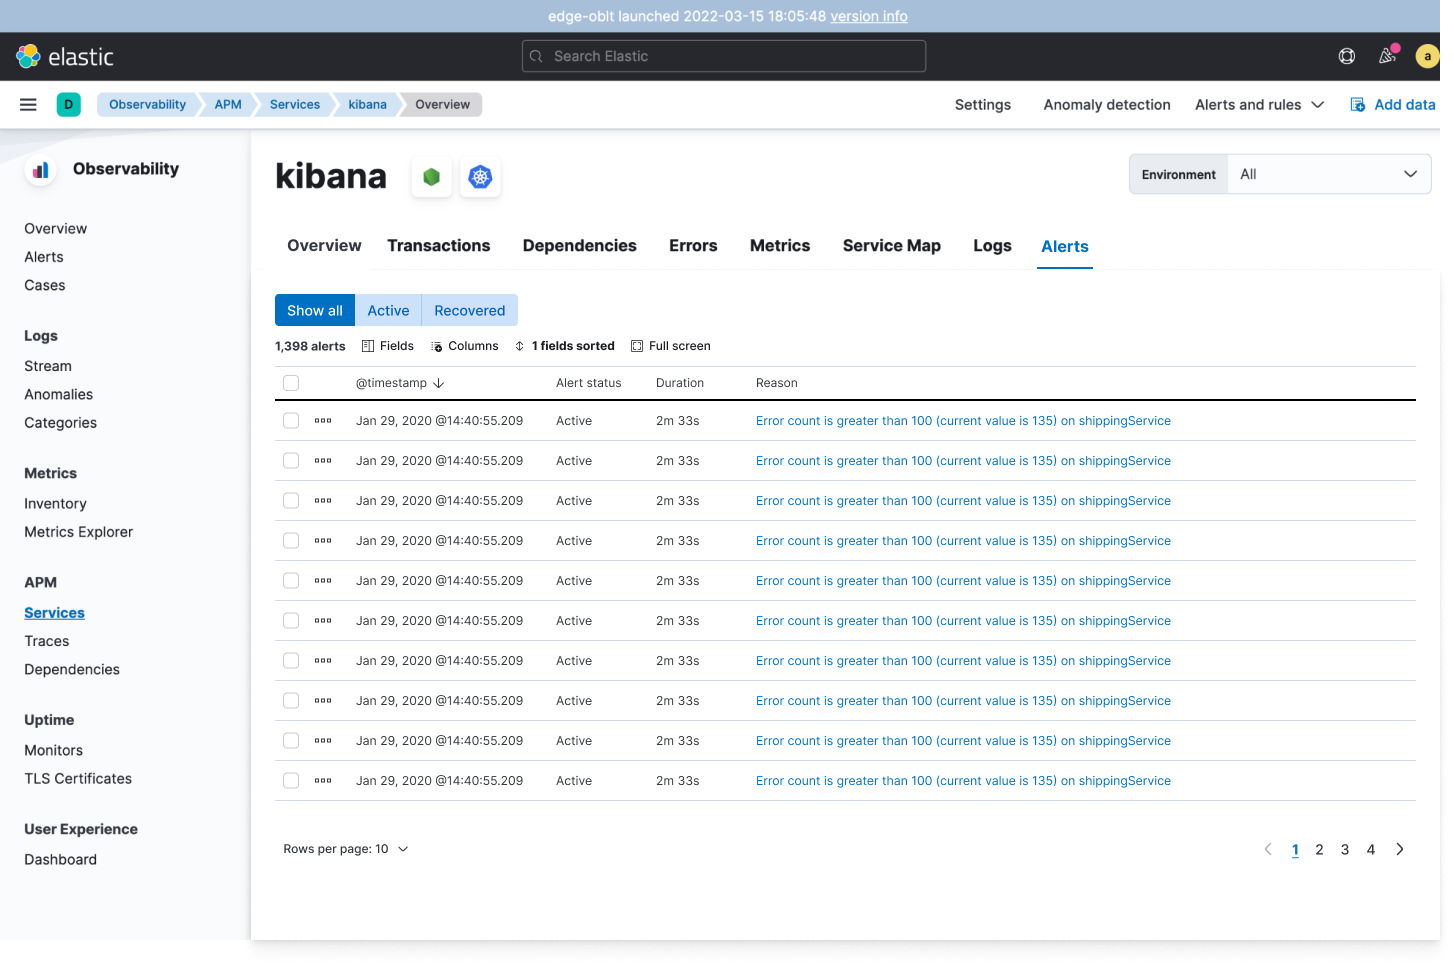
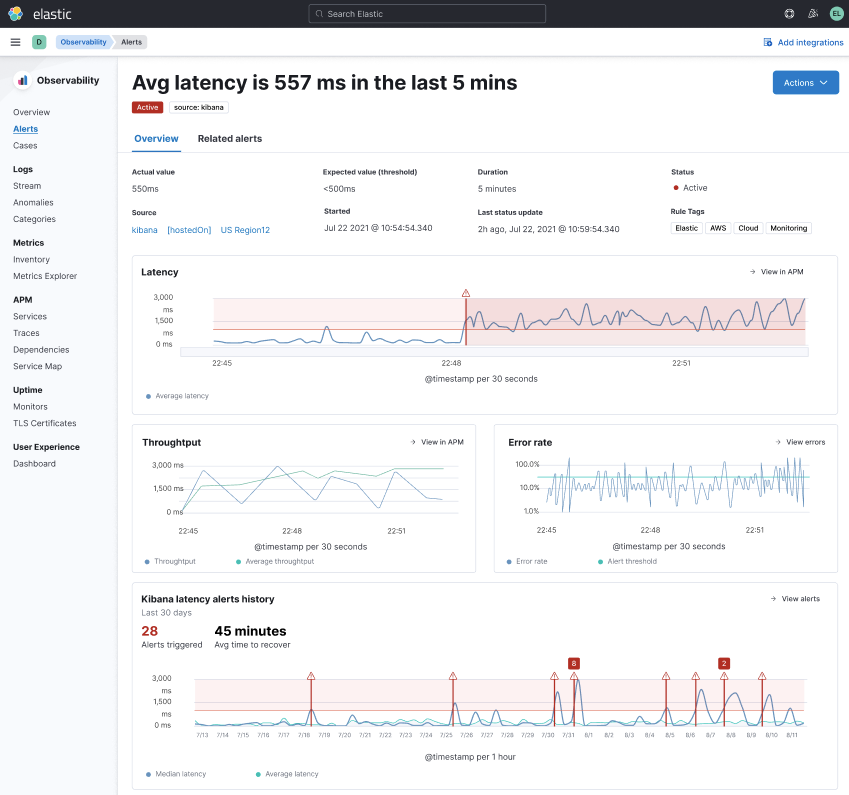
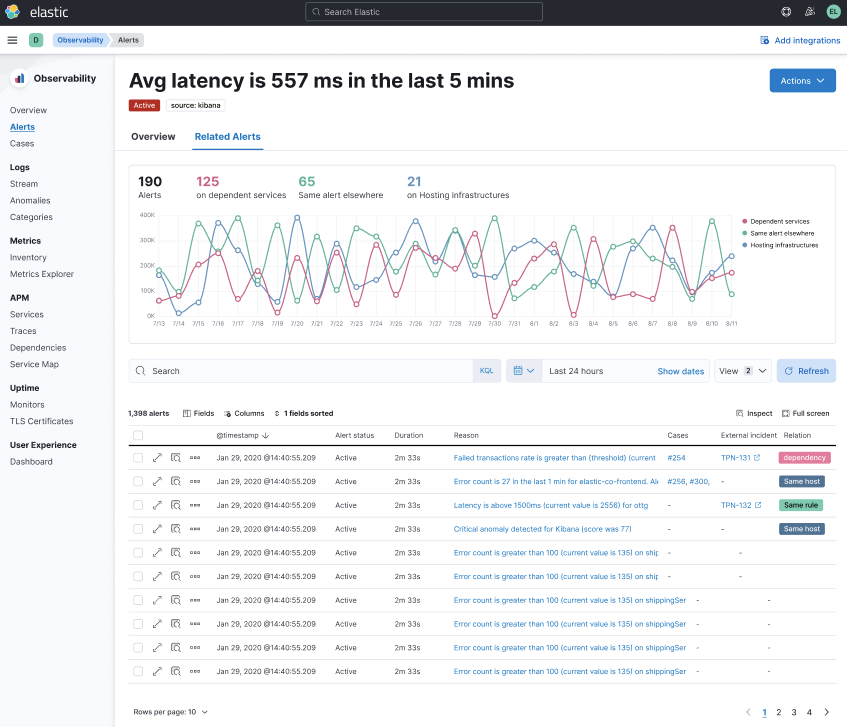
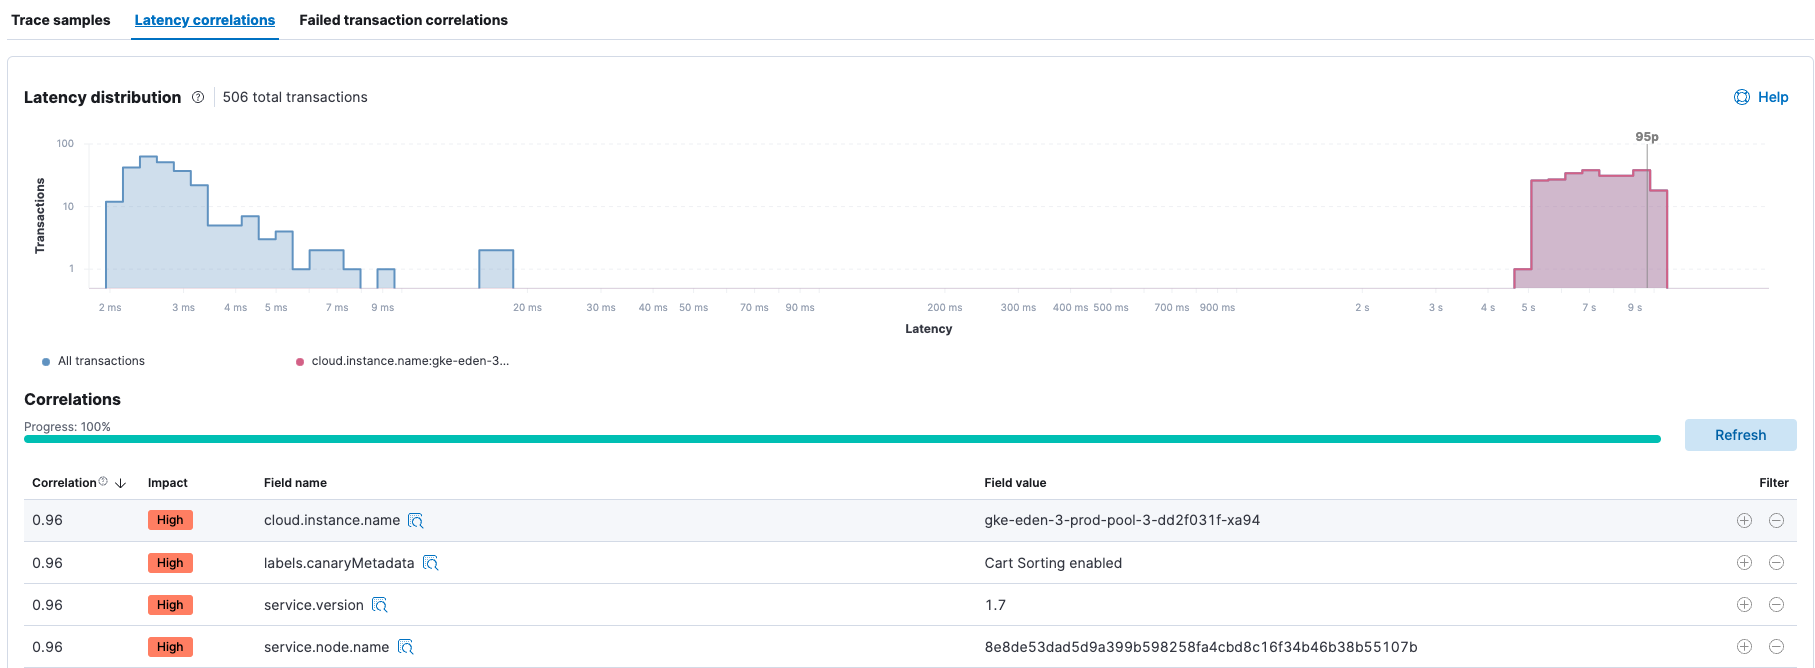
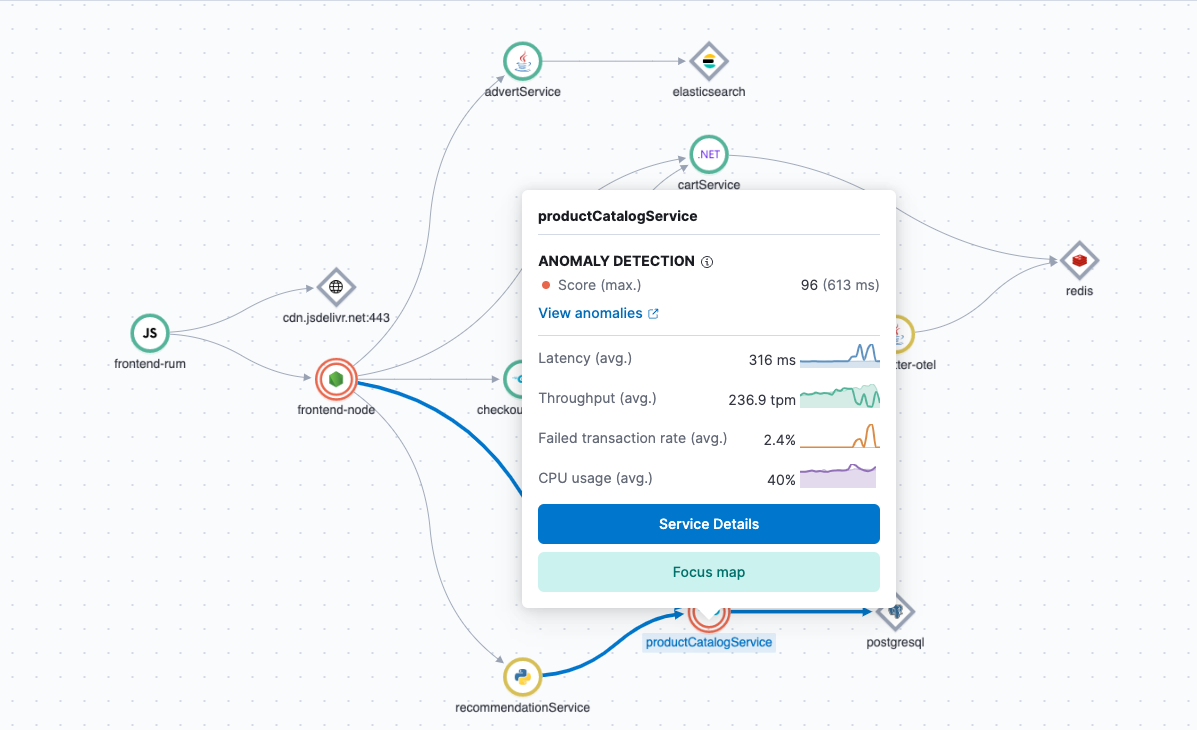
Integrated and automated correlations and anomaly detection - Elastic has integrated output from ML into multiple capabilities so you can view the analysis without having to run it. As an example, you can see anomaly detection per service in APM. Or click a button and see latency correlation for trace distributions in APM.
Market-leading AIOps
Elastic, with its 10 years of development in machine learning, allows you to not only bring your own models, but it’s truly built to do the work for you. Here are several examples of Elastic Observability’s out-of-the-box capabilities using built-in machine learning models, including data frame analytics, and natural language processing (NLP):
- Anomaly detection - Elastic helps you find patterns in your data out of the box, without having to build or modify any machine learning models. Use time series modeling to detect anomalies in single or multiple time series, population data, and forecast trends based on historical data. You can also detect anomalies in logs by grouping messages, and uncover root causes by reviewing anomaly influencers or fields correlated with deviations from baselines.
- Log spike analysis and built in log categorization - Elastic continuously scans and analyzes logs to help you understand when a log spike is a significant deviation from the normal baseline and understand groupings (categorization) of logs to help you analyze issues through simplifying your log analytics.
- Automatic error and latency correlation for trace distributions in APM - The Elastic APM correlation capability automatically surfaces attributes of the APM data set that are correlated with high-latency or erroneous transactions and have the most significant impact on overall service performance.
These features are all prebuilt, one-click capabilities without the need to know ML because the modeling, data frame analytics, and NLP we have in our ML capabilities help support these ML based features. These ML based features support log analytics, APM, and infrastructure telemetry data, by reducing your time to find root cause analysis.
The combination of Elastic Observability’s data in context features and AIOps features will help you, as an SRE, improve predictability and reduce MTTx (whether it's mean time to repair, response, or failure). As an SRE, your ultimate goal is to focus on improving your business and productivity, and these two key capabilities will aid you in achieving this.
Obtaining insights with open data and analytics
With a deep history in open source, not only is Elastic continuously increasing its support for open source projects, but Elastic also innovates to enable you to bring in your own data and analyze it as needed within our open platform.
Ongoing open source support:
Elastic continuing support for open source now includes (but not limited to):
- Native Open Telemetry support
- Istio support for Elastic Agent
- Prometheus support for Elastic Agent
Elastic Common Schema:
Elastic provides the ability to bring in your data models through Elastic Common Schema (ECS). ECS is an open source specification that defines a common set of document fields for data ingested into Elasticsearch. ECS gives you the flexibility to collect, store, and visualize any data. This includes metrics, logs, traces, content, and events from your apps and infrastructure.
ECS is designed to support uniform data modeling, enabling you to centrally analyze data from diverse sources with both interactive and automated techniques. ECS offers both the predictability of a purpose-built taxonomy and the versatility of an inclusive spec that adapts for custom use cases. ECS allows you to normalize event data, so that you can better analyze, visualize, and correlate the data represented in Elastic.
This ECS helps minimize the need to modify or ETL your data in order to ingest it into Elastic. This significantly minimizes your need to modify your process and existing tools versus simply just sending data into Elastic.
We believe this continued support for open source projects and custom data and models support enables Elastic Observability to integrate smoothly into your operations processes without modifying it to fit what a vendor provides.
Custom machine learning models:
Elastic Observability’s machine learning, in addition to the prebuilt out-of-the-box capabilities discussed earlier in this blog, provides:
- Prebuilt unsupervised learning and preconfigured models that identify observability and security issues (anomaly and outlier detections) without having to worry about how to train an AI model
- Prebuilt data frame analysis, which uses supervised models to help aid in classification and regression analysis
- Natural language models to help analyze information that is ingested and identify patterns such as PII data identification, which when coupled with scripts, redact this sensitive information
- An ability to bring in your own models to help analyze and visualize data the way you want
By supporting the most popular and commonly used open source ML frameworks, Elastic Observability is the platform of choice for organizations with advanced machine learning teams in-house. These organizations have invested significant time and money developing their own models to help analyze data and develop customized insights for their needs and daily operations. With Elastic’s machine learning, you can easily add these custom models into Elastic Observability.
Here are two examples of using publicly available models:
- How to extract data from news articles with publicly available model imported into Elastic and develop a strong visualization of the analyzed data
- How to utilize a customized sentence-transformer model that takes a sentence or a paragraph and maps it to a 384-dimensional dense vector
Conclusion
While the need for observability is readily apparent, the bigger challenge is to find the right platform for both today and tomorrow. While out-of-the-box observability capabilities are important, the ability to customize and build a platform that will serve your organization in the long-run is sometimes overlooked. Given the unique digital footprint organizations typically have for their on-premises and cloud environment, the flexibility to adapt and evolve over time is crucial for any enterprise observability solution.
At the core, observability is about unifying your observability data and then deriving both real-time and historical insights into the performance of your applications and systems, with the overarching goal of establishing operational excellence, which leads to a stronger and more robust customer experience.
By leveraging the three pillars of observability—metrics, logs, and traces—you can achieve a holistic view of your system’s health. This integrated approach not only enhances operational efficiency but also drives superior customer satisfaction.
Elastic Observability is well-positioned for your future by delivering advanced AIOps and machine learning on top of a platform built for open data and lightning-quick analytics. The complex, distributed nature of modern applications today that need to be always-on (and are generating terabytes of telemetry data), demands observability that provides the flexibility and power for your future.
As we’ve shown above, the power and flexibility of Elastic allows you to get a complete picture from application to infrastructure while also helping them manage business performance. Hopefully you’ve seen how Elastic can help:
- Improve your operational efficiency by combining both production and business data while managing SLOs
- Improve team productivity with better features and the use of machine learning to increase your time on design and improving the business
- Integrate into your day-to-day SRE operational processes without change through our open approach through open source adoption and the ability to bring your own data and analysis models
What are you waiting for? Try out Elastic Cloud and sign up for an account, and see how easy and simple Elastic Observability is to use and integrate.
Next step: The 2024 Observability Landscape — a survey of observability decision‑makers