Getting started with Elastic Cloud on Kubernetes: Data ingestion
In part one of this series of two blogs, we deployed ECK and created a Elasticsearch cluster. In this second part, we will:
- Deploy a sample application instrumented with Elastic APM and have it send APM data to the ECK-managed Elasticsearch cluster
- Deploy Metricbeat to Kubernetes as a DaemonSet and securely connect to the cluster
The goal is to show you how to obtain some of the information generated for the cluster by ECK during deployment so that you can connect to the cluster and send data to it. A detailed observability discussion is beyond the scope of this blog. If interested, please see the Observability with the Elastic Stack blog post.
Deploy an application instrumented with Elastic APM
We instrumented an extremely simple Node.js application from this blog using the Elastic APM Node.js agent. The application is a static website that uses the Express framework. You can download the source code of this application from this GitHub repository.
To properly configure the APM agent, we need to obtain the APM server URL and the APM server token. We can decode the APM server token with the following command:
echo `kubectl get secret apm-server-sample-apm-token -o=jsonpath='{.data.secret-token}' | base64 --decode`
The APM server is exposed as a Kubernetes service. Find the service name with this command:
kubectl get services | grep apm
From the output, you will see the service name is apm-server-sample-apm-http and the port is 8200. Since the APM server is deployed in the default k8s namespace, the FQDN is apm-server-sample-apm-http.default.svc.cluster.local. Also, the APM server is secured with TLS by default. So, the APM server URL will be:
https://apm-server-sample-apm-http.default.svc.cluster.local:8200
Deploy an APM application
Deployment information for the sample application is inside the deployment file shark-node.yaml. Edit the environment section with information of your cluster:
env:
- name: ELASTIC_APM_SECRET_TOKEN
  value: 'srj59kt4gbdm8xnxm2mdqd9d'
- name: ELASTIC_APM_SERVER_URL
  value: https://apm-server-sample-apm-http.default.svc.cluster.local:8200
- name: ELASTIC_APM_SERVICE_NAME
  value: "Shark"
- name: ELASTIC_APM_VERIFY_SERVER_CERT
  value: "false"
As the cluster was created with self-signed, you need to set ELASTIC_APM_VERIFY_SERVER_CERT to false, to turn off server certificate validation.
Deploy the sample application into your Kubernetes cluster and check the logs. The output should be:
Example app listening on port 8080!
kubectl apply -f shark-node.yaml
kubectl logs deployment/shark-demo-deployment -n shark
Expose the application with a service and port-forward to your laptop so that you can access the application locally:
kubectl expose deployment shark-demo-deployment -n shark
kubectl port-forward service/shark-demo-deployment 8080 -n shark
Navigate through the pages of the app: http://localhost:8080.
Look at APM tracing data
Open the APM UI. If you see the message “There’s no APM index pattern with the title “apm-*” available,” click the Setup Instructions link and follow the instructions to set up APM. Make sure you select Load Kibana objects at the end. In the APM UI, select Shark from the Services tab:
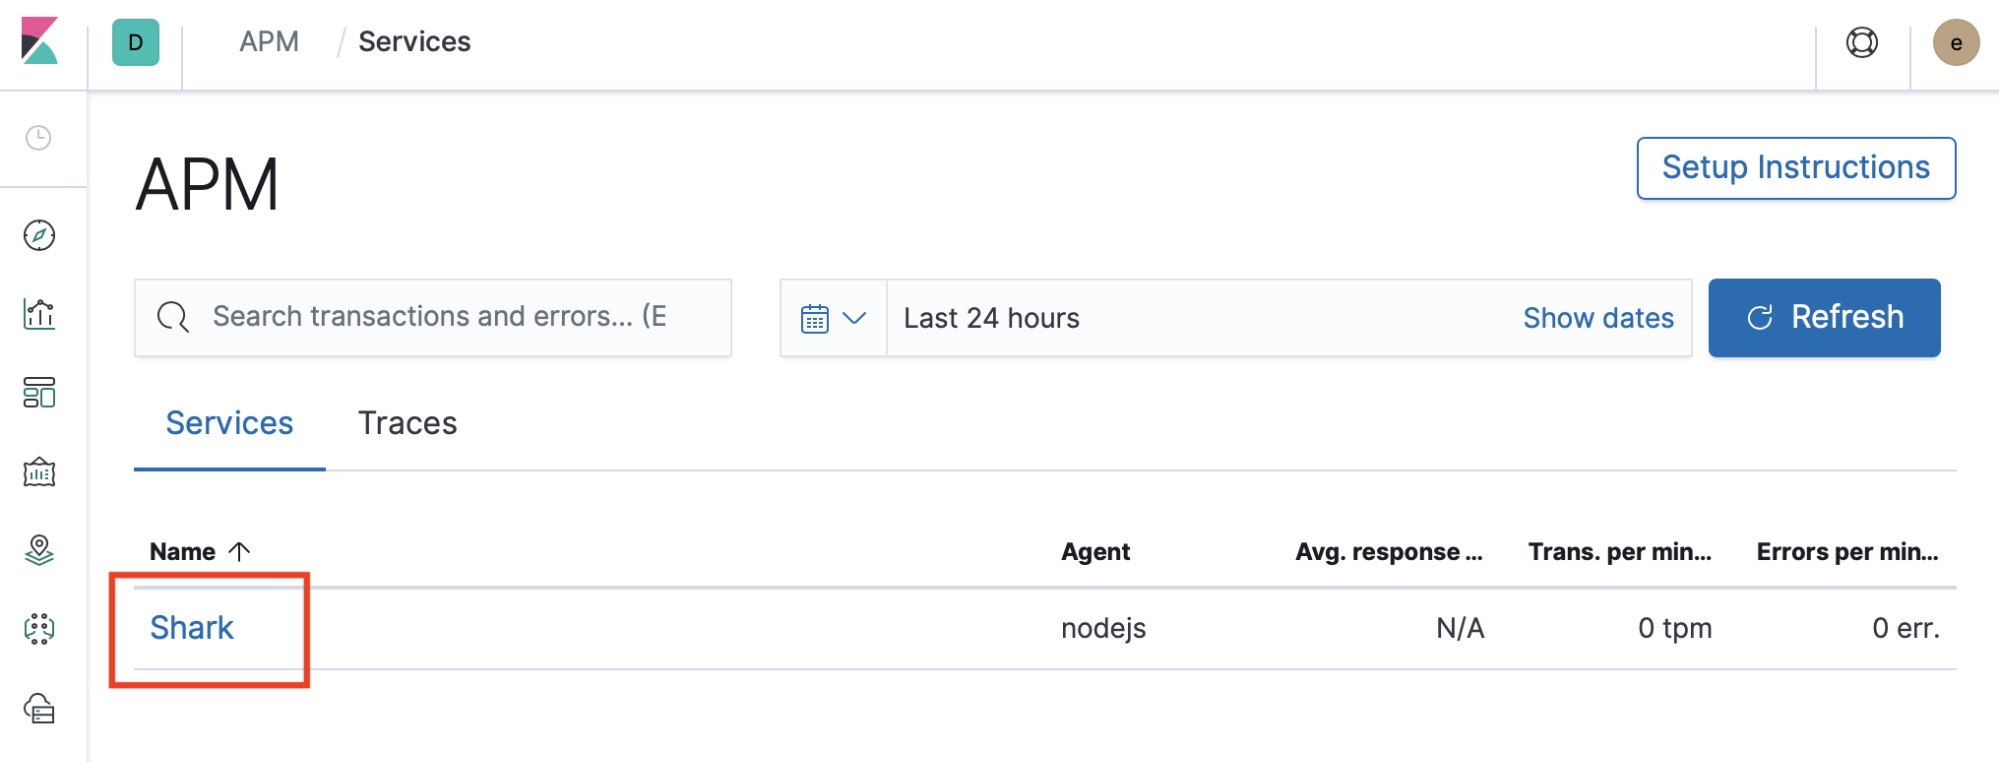
Look at the transactions, check for errors, and look at the metrics. Detailed APM walkthrough is beyond the scope of this blog, but yeah, we got APM data flowing into an ECK-managed Elasticsearch cluster! If you are interested in Elastic APM, you can check out the following blogs:
Deploy Metricbeat
Let’s also deploy Metricbeat into your Kubernetes cluster and have it send metrics data to your ECK-managed Elasticsearch cluster. We need a couple of things for Metricbeat to connect to Elasticsearch securely via SSL:
- The certificate generated during deployment
- Connection information for Elasticsearch and Kibana: URL, user name, password
Create a Kubernetes ConfigMap with the cert
The cert is added to a secret. Extract the cert using the following command:
kubectl get secret elasticsearch-sample-es-http-ca-internal -o=jsonpath='{.data.tls\.crt}' | base64 --decode
Edit the manifest cert.yaml and replace the sample with the decoded tls.crt. Make sure you indent the cert as shown in the sample. Create the ConfigMap with the following command:
kubectl create -f cert.yaml
Create secrets with connection information
Next, we will put all the information about our Elasticsearch cluster into a manifest file secrets.yaml so that we can create the secrets. Kubernetes secret objects let you store and manage sensitive information, such as passwords, OAuth tokens, and SSH keys.
Run kubectl get services to list all the services so that you can find out the service URLs of the Elasticsearch service and the Kibana service. In this case:
- The Elasticsearch URL is
https://elasticsearch-sample-es-http.default.svc.cluster.local:9200 - The Kibana URL is
https://kibana-sample-kb-http.default.svc.cluster.local:5601
Base64 encrypt your Elasticsearch password and paste it in the file secrets.yaml. All other connection information is already there.
echo -n 'bhsd6djttf6ff8zn8njgdm8m' | base64
Finally, create the Kubernetes secret with the following command:
kubectl apply -f secrets.yaml -n kube-system
Deploy kube-state-metrics
kube-state-metrics is a simple service that listens to the Kubernetes API server and generates metrics about the state of various objects such as deployments, nodes, and pods. Download and deploy kube-state-metrics with the following commands:
git clone https://github.com/kubernetes/kube-state-metrics.git kube-state-metrics
kubectl create -f kube-state-metrics/kubernetes
Deploy Metricbeat
Now, we are ready to deploy Metricbeat, which we can do with the following command:
kubectl apply -f metricbeat-kubernetes.yaml
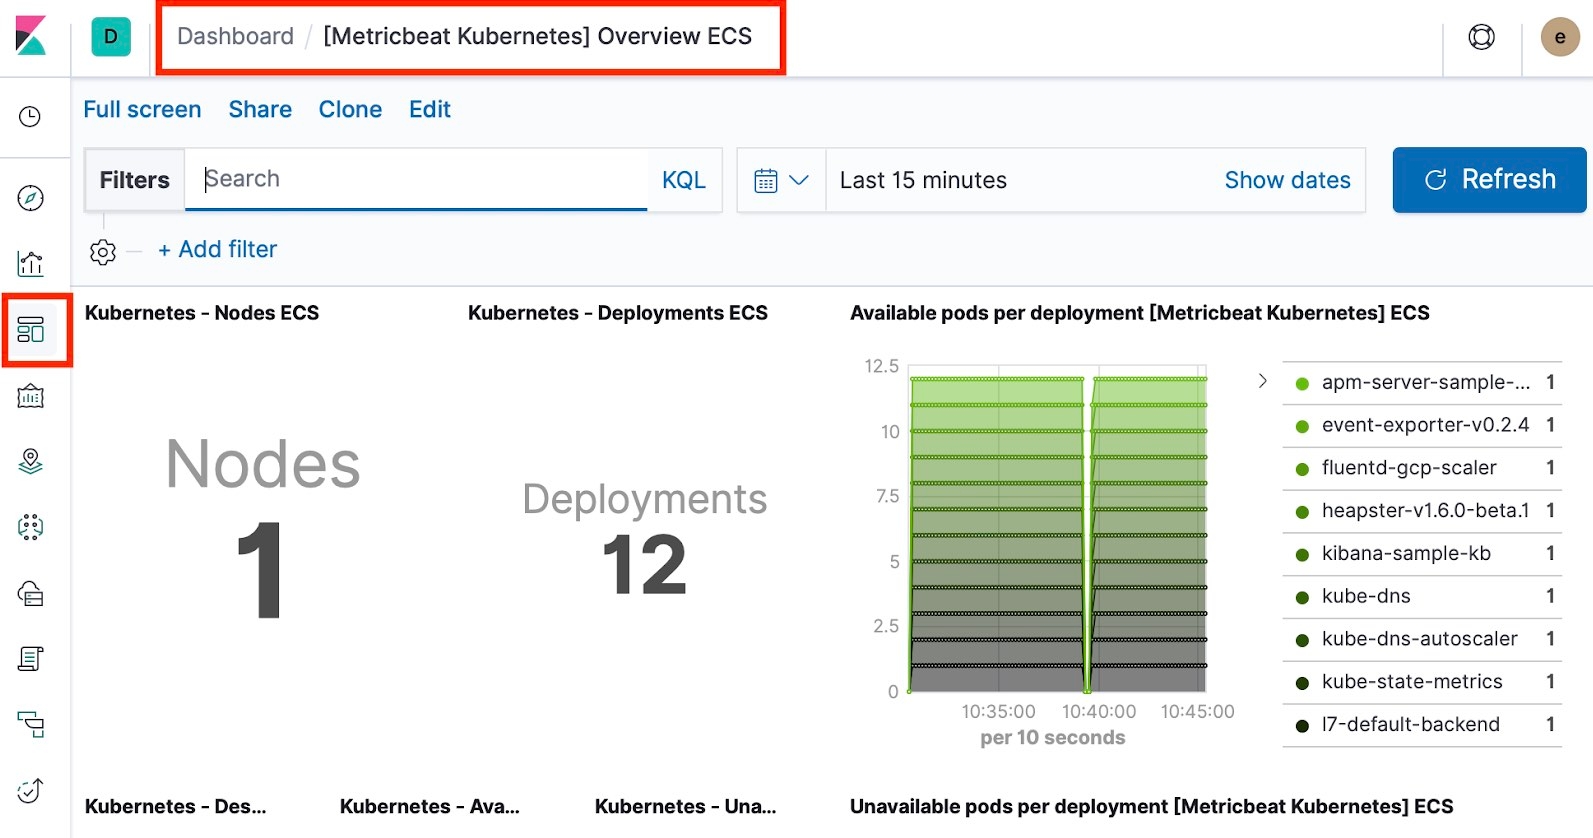
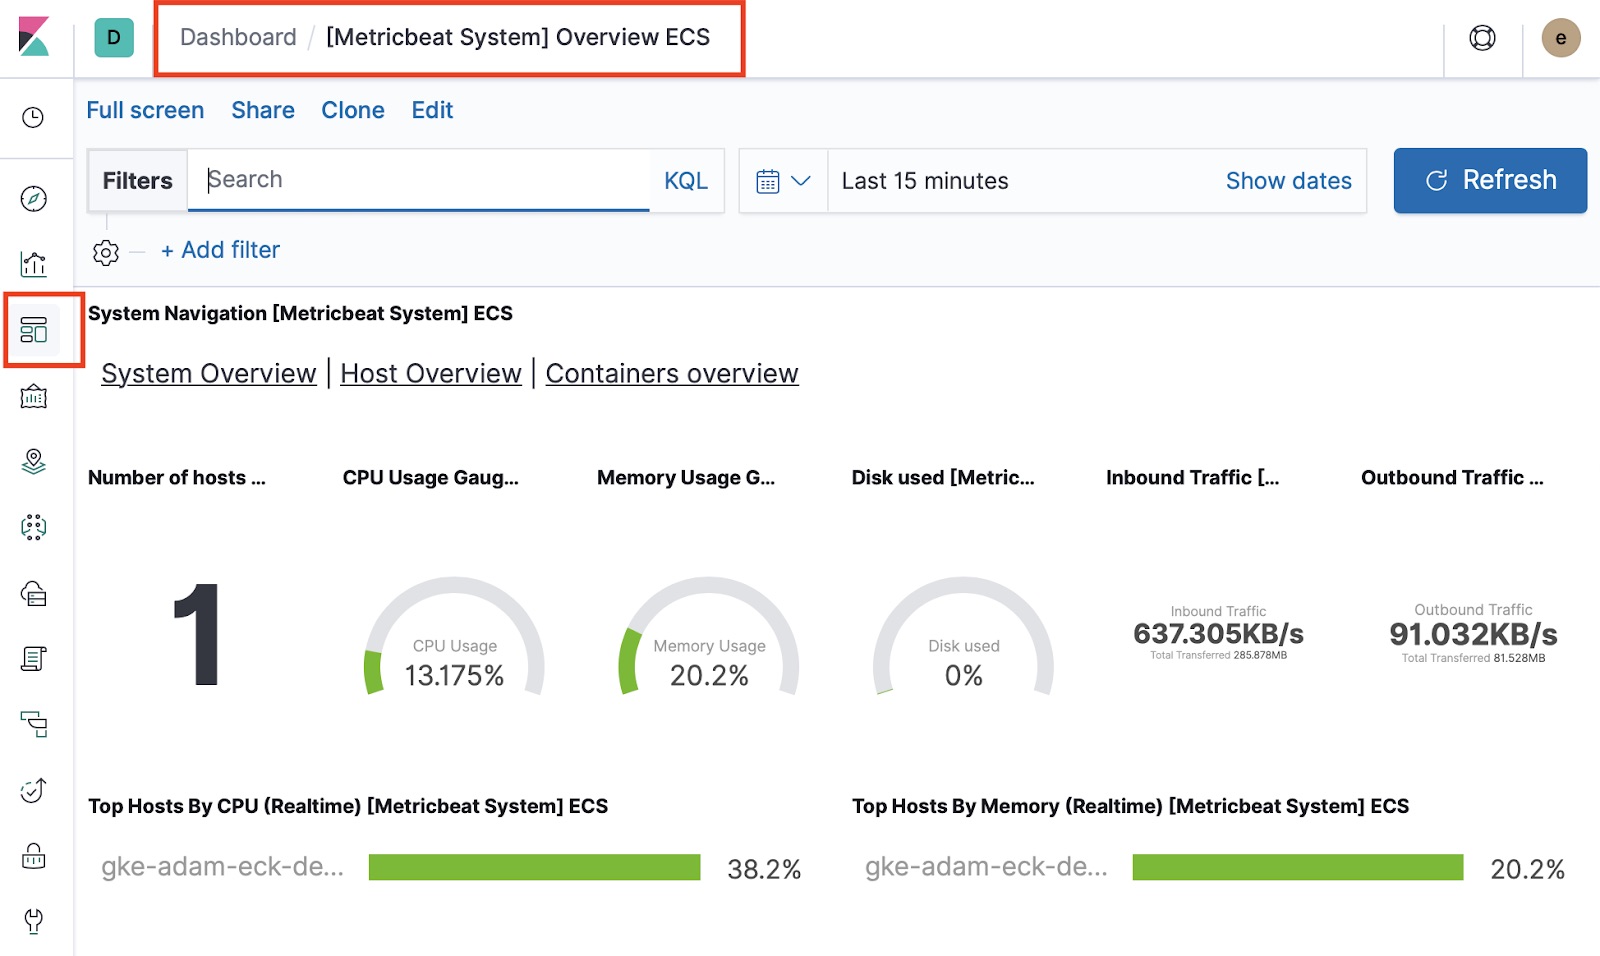
That’s it — Metricbeat should be sending data to your ECK-managed Elasticsearch cluster. Go to Kibana and take a look at all the out-of-the-box Metricbeat dashboards for your Kubernetes cluster, hosts, and containers.
Summary
Developed and supported by the creators of the Elastic Stack, ECK is the best way to deploy Elastic on Kubernetes. You can conveniently send logs, metrics, and APM data to ECK-managed Elasticsearch clusters in a secure fashion and gain full visibility of your business applications. Enjoy!