Elastic Metrics 7.6.0 released
We’re happy to announce that a new release of Elastic Metrics, 7.6.0, is now available on the Elasticsearch Service, or as part of the default distribution of the Elastic Stack. Debuting in this release is the new GCP integration for collecting metrics, Azure storage monitoring, insights into AWS billing and usage, and a lot more!
Billing and usage for AWS
Different cloud deployments have different resource requirements spread across multiple AWS services. In some cases you might have different accounts for the teams working in different parts of your organization. With all of these different combinations it becomes hard to keep track of your actual resource usage, which makes you wonder — what will my bill look like? Am I using my quota efficiently? Is there room for improvement?
In this release we’ve added another lens into observability of your AWS accounts. Two new metricsets in the Metricbeat AWS module can help you keep track of your estimated charges and resource usage across all of your AWS accounts:
- billing: when enabled, collects estimated charges that are calculated several times a day for every service in AWS that you use. In addition, the metricset captures the estimated overall total of your AWS charges.
- usage: collects metrics that track the usage of some of the AWS resources by querying the AWS Cloudwatch API. Usage metrics correspond to AWS service quotas, which helps you to manage quotas proactively.
Both metricsets come with dashboards where all of these metrics are visualized in a simple way. You can reuse these visualizations by, for example, putting them side by side with your other operational data points, like service metrics, to see how your operations correlate with the incurred cost.
Inventory for AWS services
One of the perks of collecting cloud metadata along with metrics from cloud services is that this information can be used in many different ways — for example, building an inventory of cloud resources used by your accounts. This is another great example of how high-cardinality metrics can help you boost the observability of modern platforms.
Previously, the Metrics UI Inventory page in Kibana was capable of giving a bird’s eye view of all hosts, Docker containers, and Kubernetes pods that you monitor with Elastic. We decided to take this concept further and expand it to cloud infrastructures starting with AWS services.
The new Inventory offers custom views for AWS EC2 instances, S3 buckets, RDS databases, and SQS queues.
Each view is enriched with metrics and groupings specific to each service and can work across multiple AWS accounts. For example, the S3 buckets inventory lets you choose the size, number of objects, total requests, and downloaded or uploaded bytes for every bucket in your inventory. You can further group them by region or any custom field you choose. Just like for hosts and containers, the AWS inventory allows you to easily view logs, metrics, or other operational data with a single click.
To start using the AWS inventory you will need to activate corresponding metricsets in Metricbeat’s AWS module configuration.
Monitoring Google Cloud Platform
We’re excited to announce that GCP monitoring is now part of our cloud integrations! Whether you’re using GCP as your only cloud infrastructure provider or as part of your hybrid cloud model, you’re now able to monitor your deployments from one place. The Google Cloud Platform module in Metricbeat automatically collects metrics from multiple cloud accounts and workloads into Elasticsearch where they can be further used for analysis, visualization, or alerting. Under the hood, the module is using Stackdriver to retrieve all metrics, labels, and other service metadata via the Stackdriver APIs.
In this release we’ve added the compute metricset that collects metrics from Compute Engine Virtual Machines in Google Cloud Platform. The metricset is simple to configure and use:
metricbeat.modules:
- module: googlecloud
  metricsets:
    - compute
  zone: "us-central1-a"
  project_id: "your project id"
  credentials_file_path: "your JSON credentials file path"
  exclude_labels: false
  period: 300s
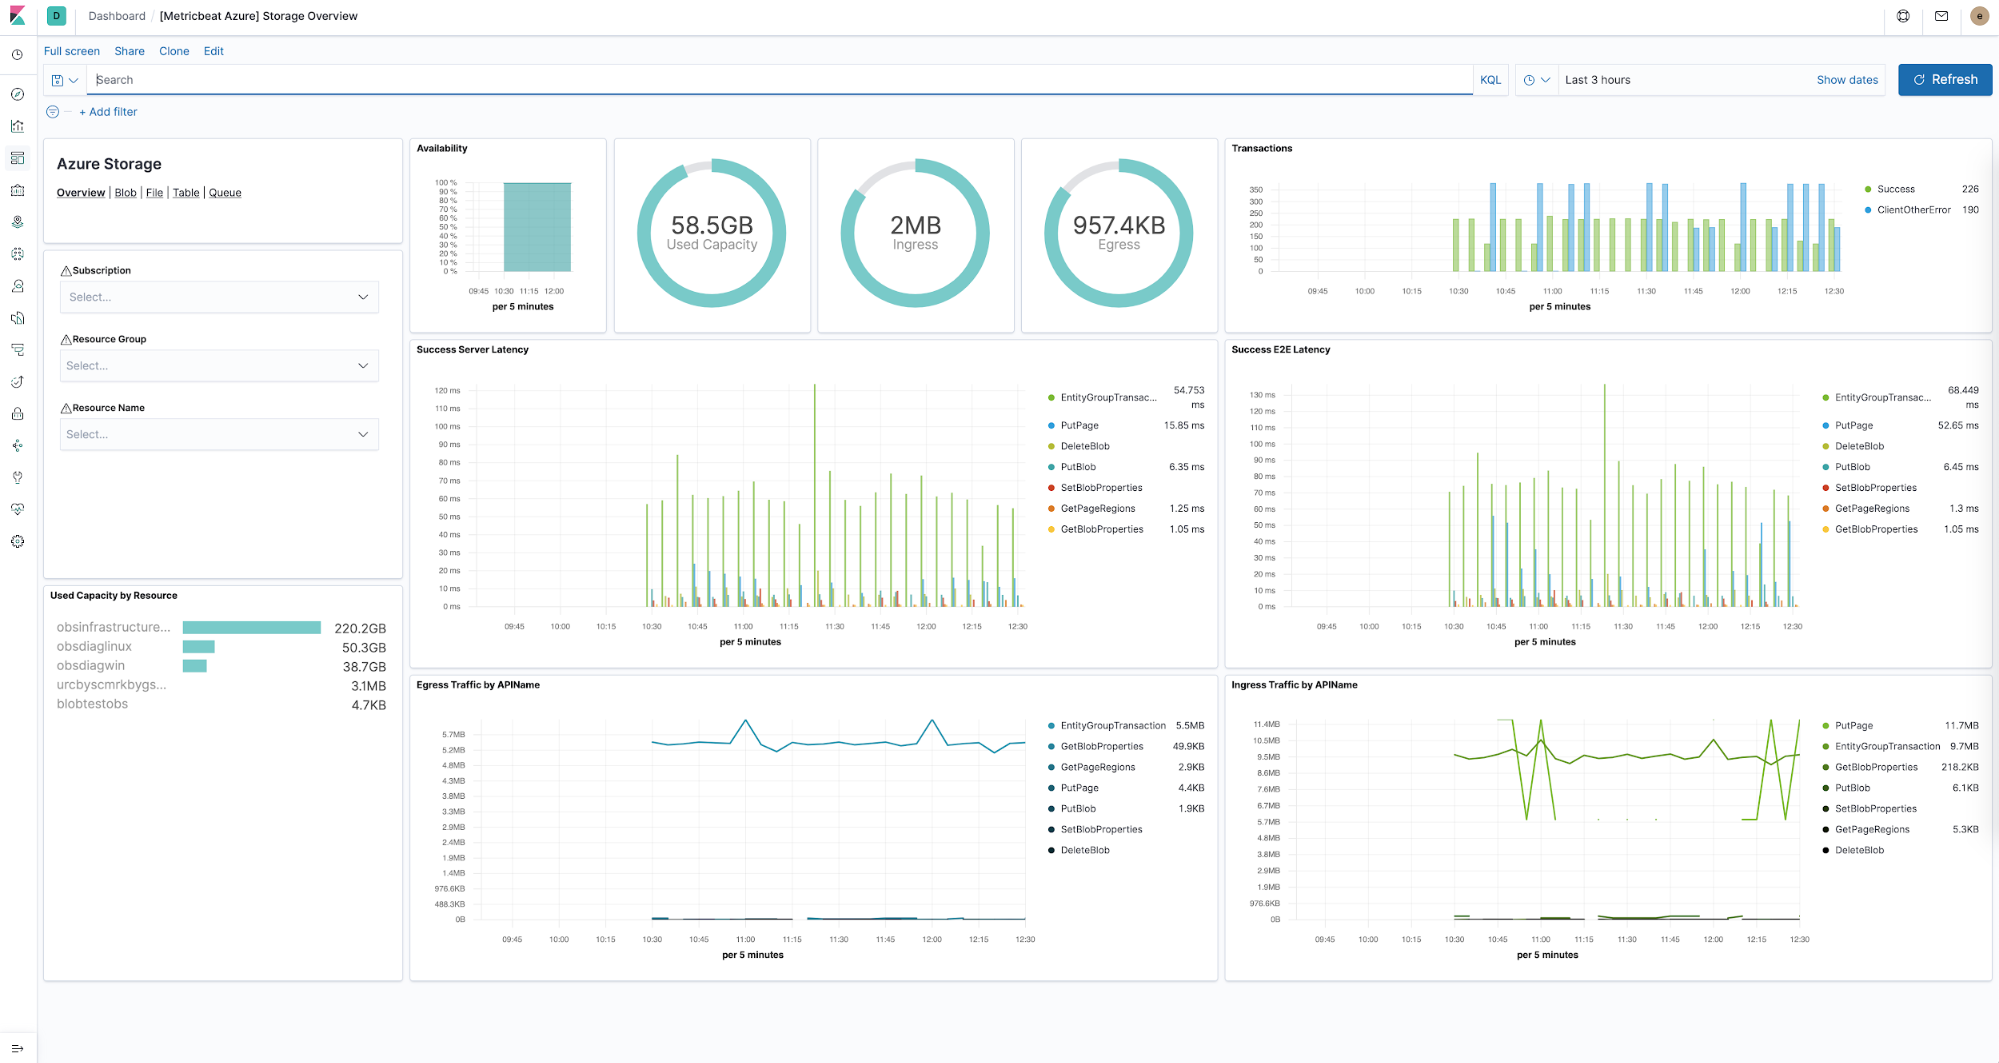
Azure Storage monitoring
Azure Storage provides different types of data storage services for different scenarios. These services are:
- Azure Blobs: a scalable object store for data objects
- Azure Files: a file system service for the cloud
- Azure Queues: a messaging store for reliable messaging between application components
- Azure Tables: a NoSQL store for schemaless storage of structured data
In this release we introduced the storage metricset to our Azure integration. This metricset can be easily configured to retrieve metrics for the different storage types:
resources:
    - resource_id: ""
      service_type: ["blob", "table"]
    - resource_group: ""
      service_type: ["queue", "file"]
The available storage types are blob, table, queue, and file. The metricset also comes with dashboards for each supported storage type, which makes it easy to see the relevant metrics subscription, resource group, or resource name.
Improved Kubernetes observability
In this release we continued expanding visibility into the Kubernetes ecosystem of services and added support for PersistentVolumes, PersistentVolumeClaims, and Services. PVs and PVCs are resources responsible for how storage in Kubernetes is allocated and consumed, while Service provides an abstract representation of applications running on a set of Pods.
The new metricsets capture metrics exposed by the kube-state-metrics agent and can be found under kubernetes.persistentvolume.*, kubernetes.persistentvolumeclaim.*, and kubernetes.service.* fields, respectively.
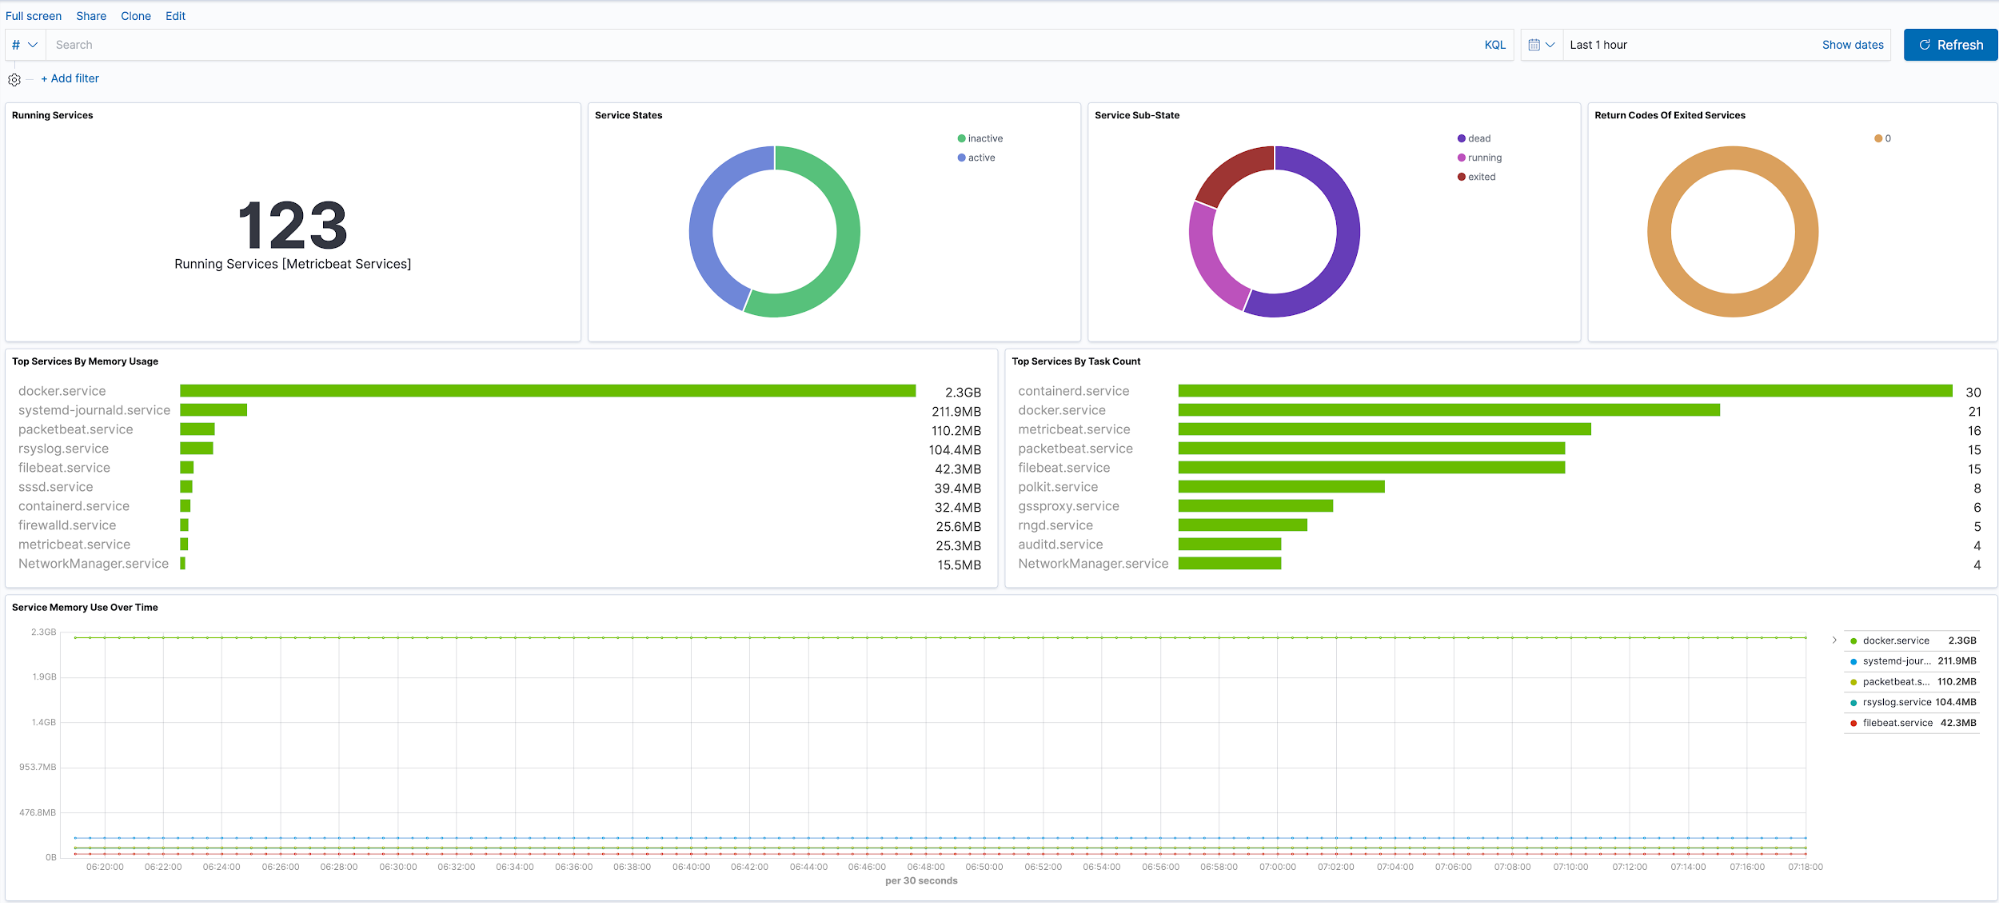
Enhanced system module
We worked on the system module in Metricbeat to provide more information about how your servers are behaving. The new additions are:
- service: provides the status of systemd services, such as the load or activity state of the service
- network_summary: reports network IO metrics collected from the operating system and sorted by protocol: ip, icmp, tcp, udp, udp_lite
Monitoring Apache ActiveMQ
ActiveMQ is a popular messaging platform written in Java. Starting with v5.8.0, ActiveMQ comes bundled with Jolokia, which provides an API to ActiveMQ's JMX capabilities. In this release we’re introducing the ActiveMQ module in Metricbeat, which periodically captures metrics describing ActiveMQ’s brokers, queues, and topics:
- broker: provides metrics for connected consumers, producers, memory usage, active connections, and exchanged messages
- queue: collects metrics for exchanged messages (enqueued, dequeued, expired, in-flight), connected consumers, and producers
- topic: offers metrics for ActiveMQ topics, such as exchanged messages (enqueued, dequeued, expired, in-flight), connected consumers, and producers
New metricsets for Kafka Producer, Consumer, and Broker
We expanded metric coverage in the Kafka module by adding three new metricsets: kafka.broker, kafka.producer, and kafka.consumer. Note that the Jolokia agent is required to be deployed along with a Kafka JVM application.
Monitoring NATS Streaming services
NATS Streaming is a fast and lightweight streaming platform built on NATS. In this release we added the new Metricbeat module for NATS Streaming (STAN) that uses STAN’s monitoring server APIs to collect statistics about server’s channels, subscriptions, and the server itself.
Make it yours
You can access the latest version of the Elastic Metrics application on the Elasticsearch Service on Elastic Cloud by creating a new cluster or upgrading an existing cluster the day of release, or you can download it as part of the default distribution of the Elastic Stack.