Observability on blockchain and the Hyperledger project
Hyperledger Fabric is a blockchain framework by the Linux Foundation that uses some open source projects to build a modular blockchain application. And do you know what? You can monitor your Hyperledger Fabric applications with the Elastic Stack. :)
We are going to assume a specific Hyperledger Fabric setup. With Hyperledger Fabric you can deploy your application using different "blocks" to achieve the same result. For example, you can use a Hyperledger Fabric internal implementation, Kafka, or etcd for consensus operations, and you can use GoLevelDB or CouchDB as database.
The services deployed for this example are:
- Apache Kafka for ordering, monitored with the Metricbeat Kafka module
- Apache Zookeeper as a requirement of Apache Kafka, monitored with the Metricbeat Zookeeper module
- CouchDB as the source of truth database, monitored with the Metricbeat CouchDB module
- Peers monitored with the Metricbeat Prometheus module
- Orderer service written in Go, monitored with the Metricbeat Golang module
The result is a very rich dashboard with an overall view of a Hyperledger Fabric network:
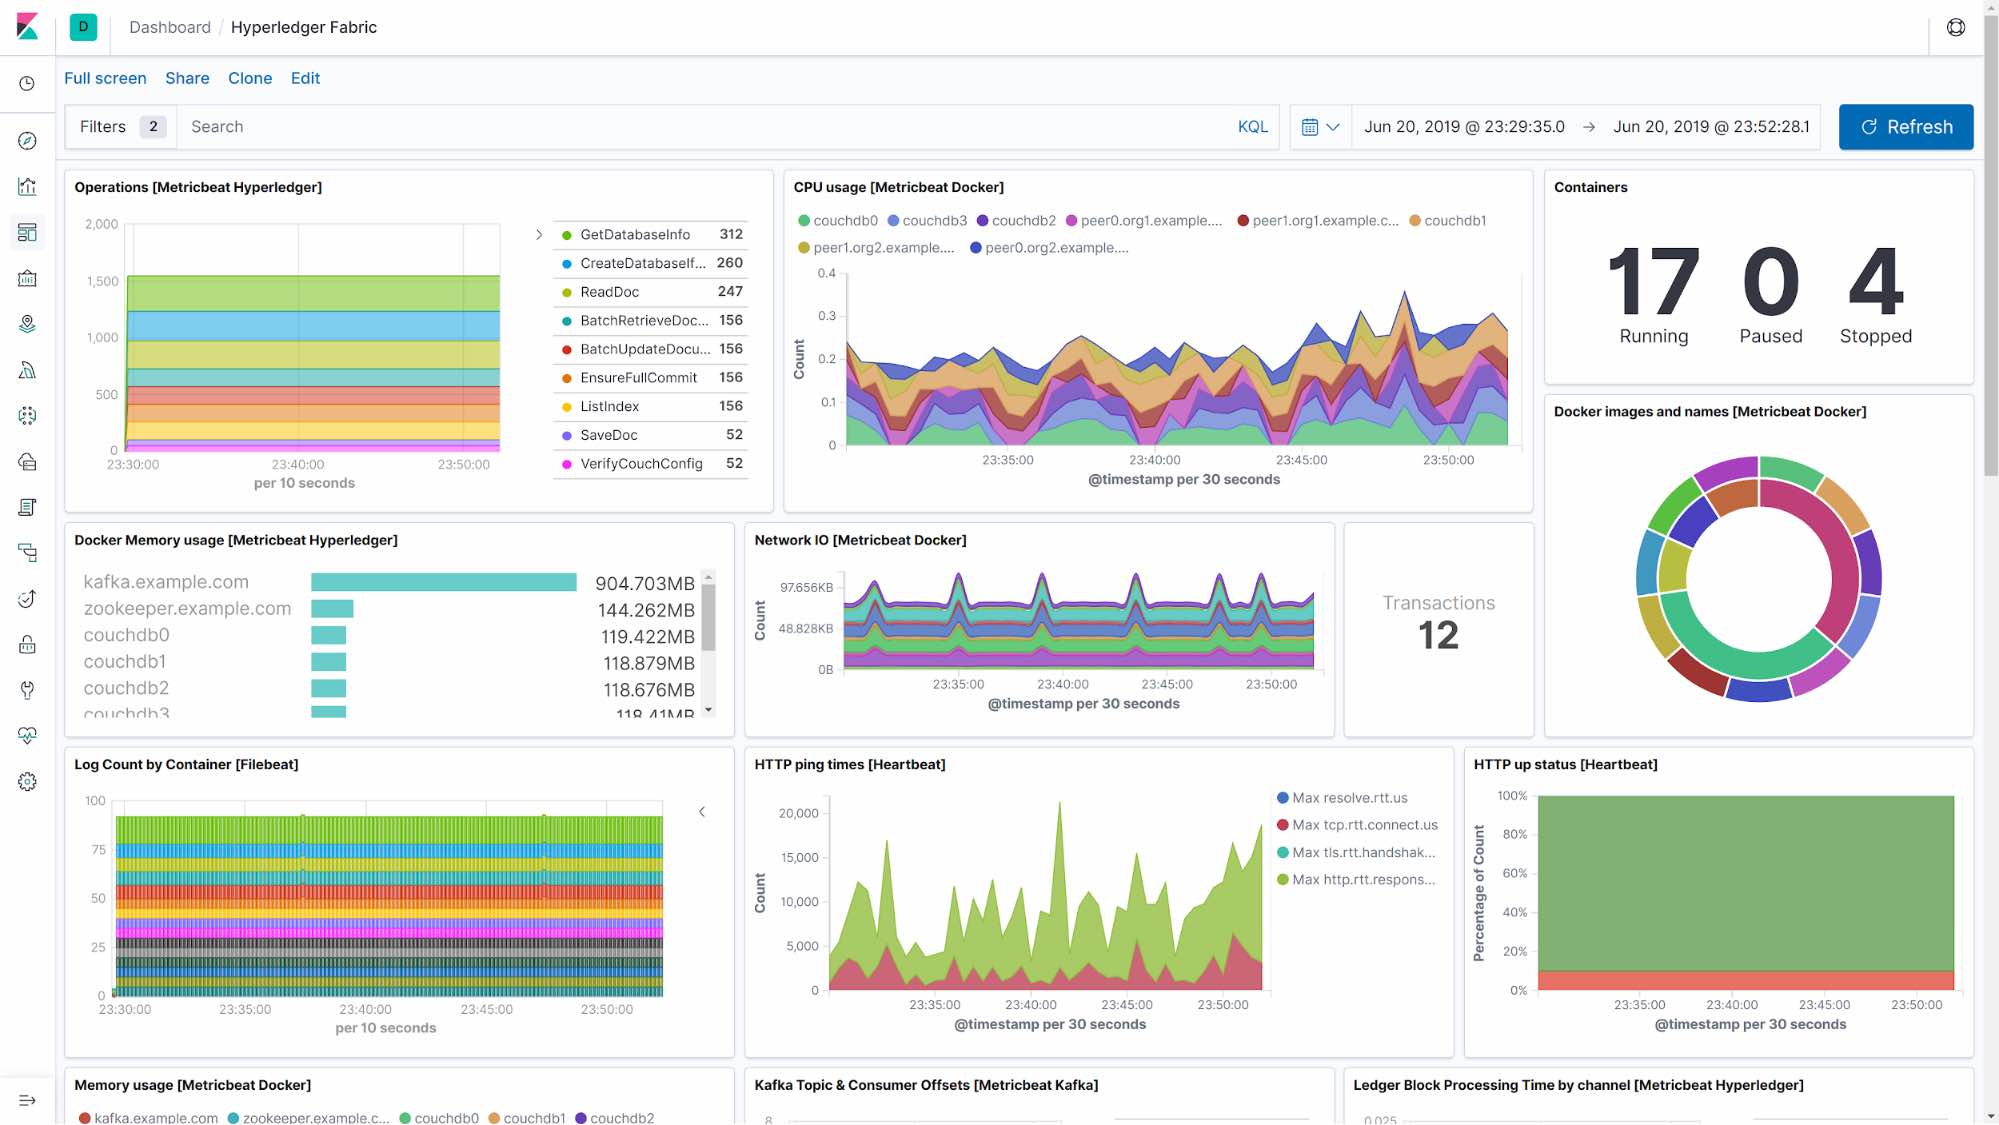
In the screenshot above we see a portion of a dashboard specifically built for Hyperledger Fabric. We can also see Metricbeat, Filebeat, and Heartbeat working in harmony. Each peer inside the Hyperledger Fabric network is monitored by configuring them to expose Prometheus metrics. Heartbeat is also used; in this case, Heartbeat supports ICMP, TCP, and HTTP protocols so we have configured it to monitor all HTTP endpoints that were available.
The network is deployed in Docker so the Metricbeat Docker module has been configured to monitor it. But also, a Filebeat configured with Container as input (previously called Docker input) and with the add_docker_metadata processor allow us to extract and enrich Docker generated logs. Because we are not using any Filebeat module to process Docker log lines, the configuration can’t be simpler:
filebeat.inputs:
  - type: container
    enabled: true
    paths:
      - /path_to_your_docker_logs/*/*.log
    json.keys_under_root: true
output.elasticsearch:
  hosts: ["your_elasticsearch:9200"]
processors:
  - add_host_metadata: ~
  - add_docker_metadata:
      host: "unix:///var/run/docker.sock"
The config above points the container input in Filebeat to the logs path (in this case, they were Docker containers so it points to the Docker logs path). Docker outputs log lines as JSON so we set to true json.keys_under_root so that they are not “stringified.” We configure our Elasticsearch cluster and add two very useful processors: add_host_metadata, which enriches the JSON with useful data coming from the host machine where Filebeat is running; and add_docker_metadata which, in turn, enriches the JSON with useful information about the Docker engine that is running the containers.
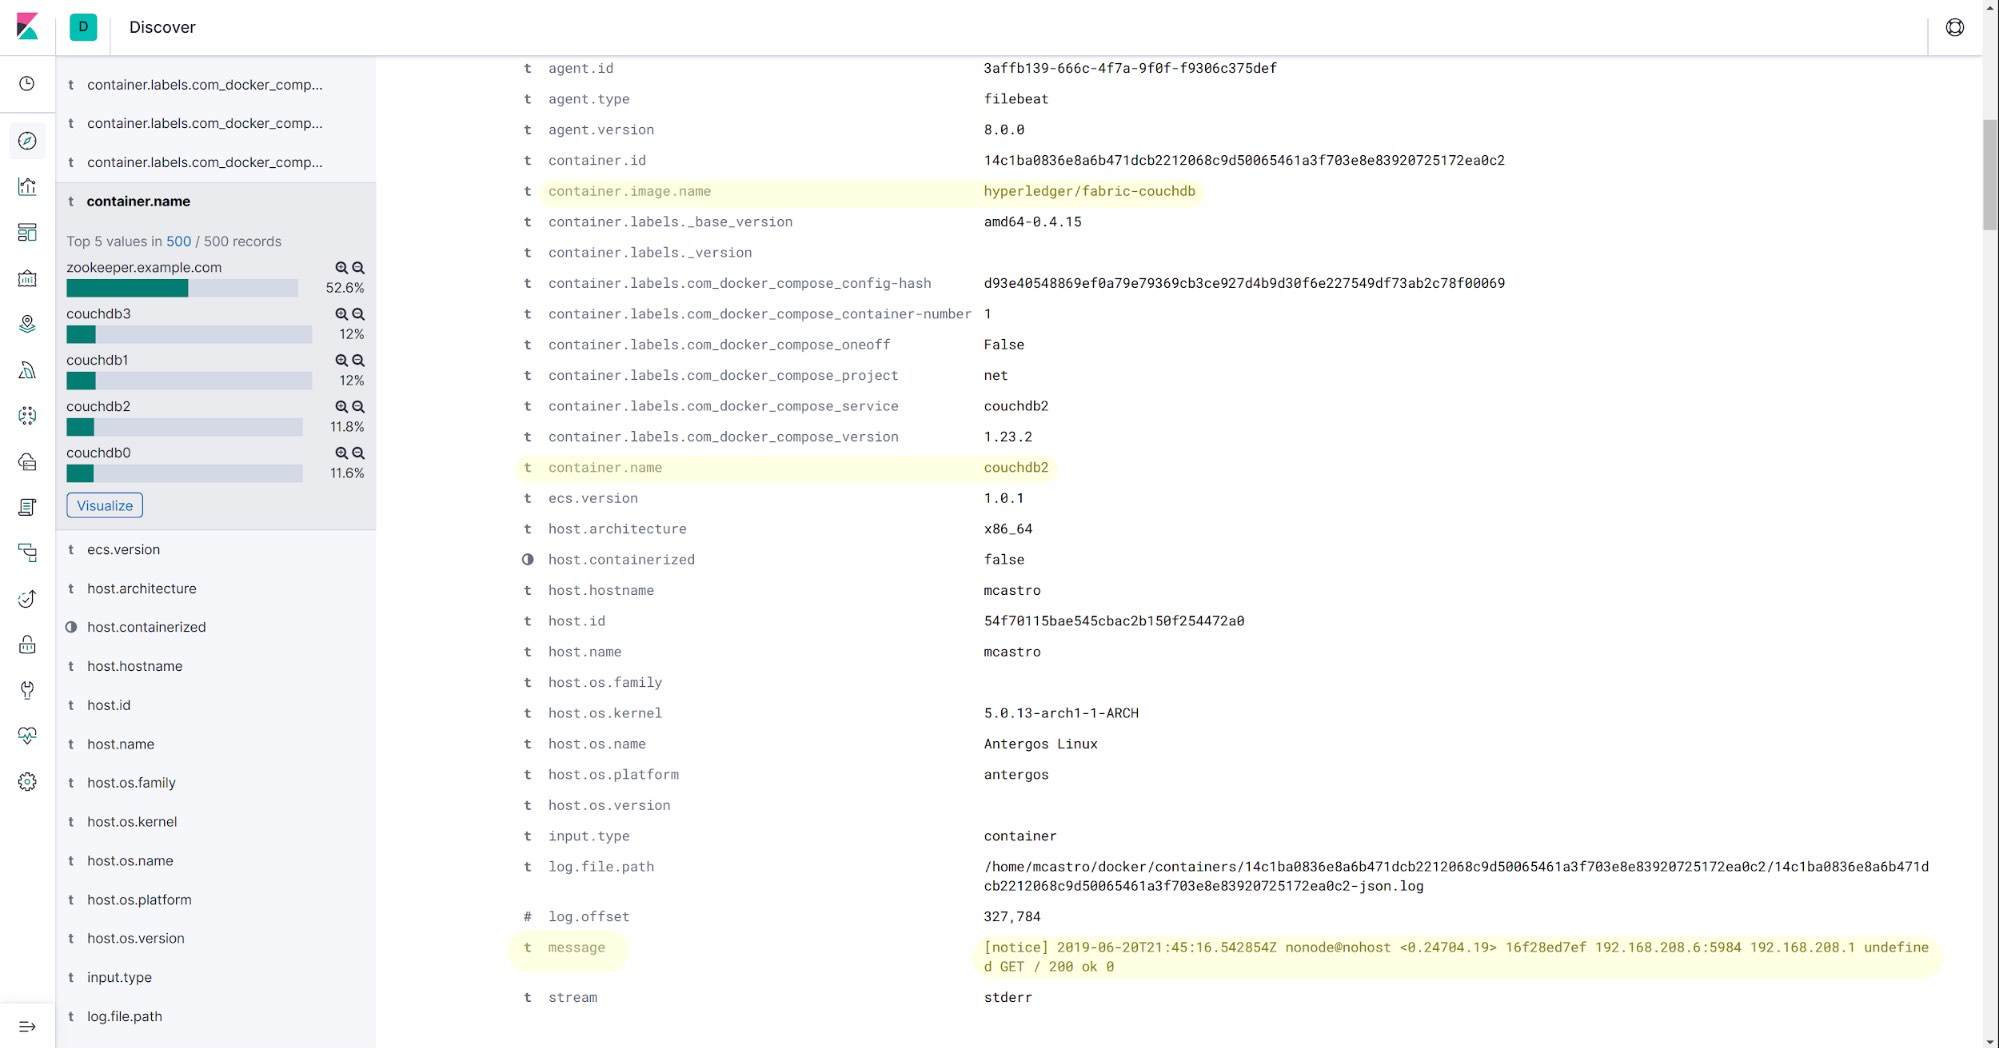
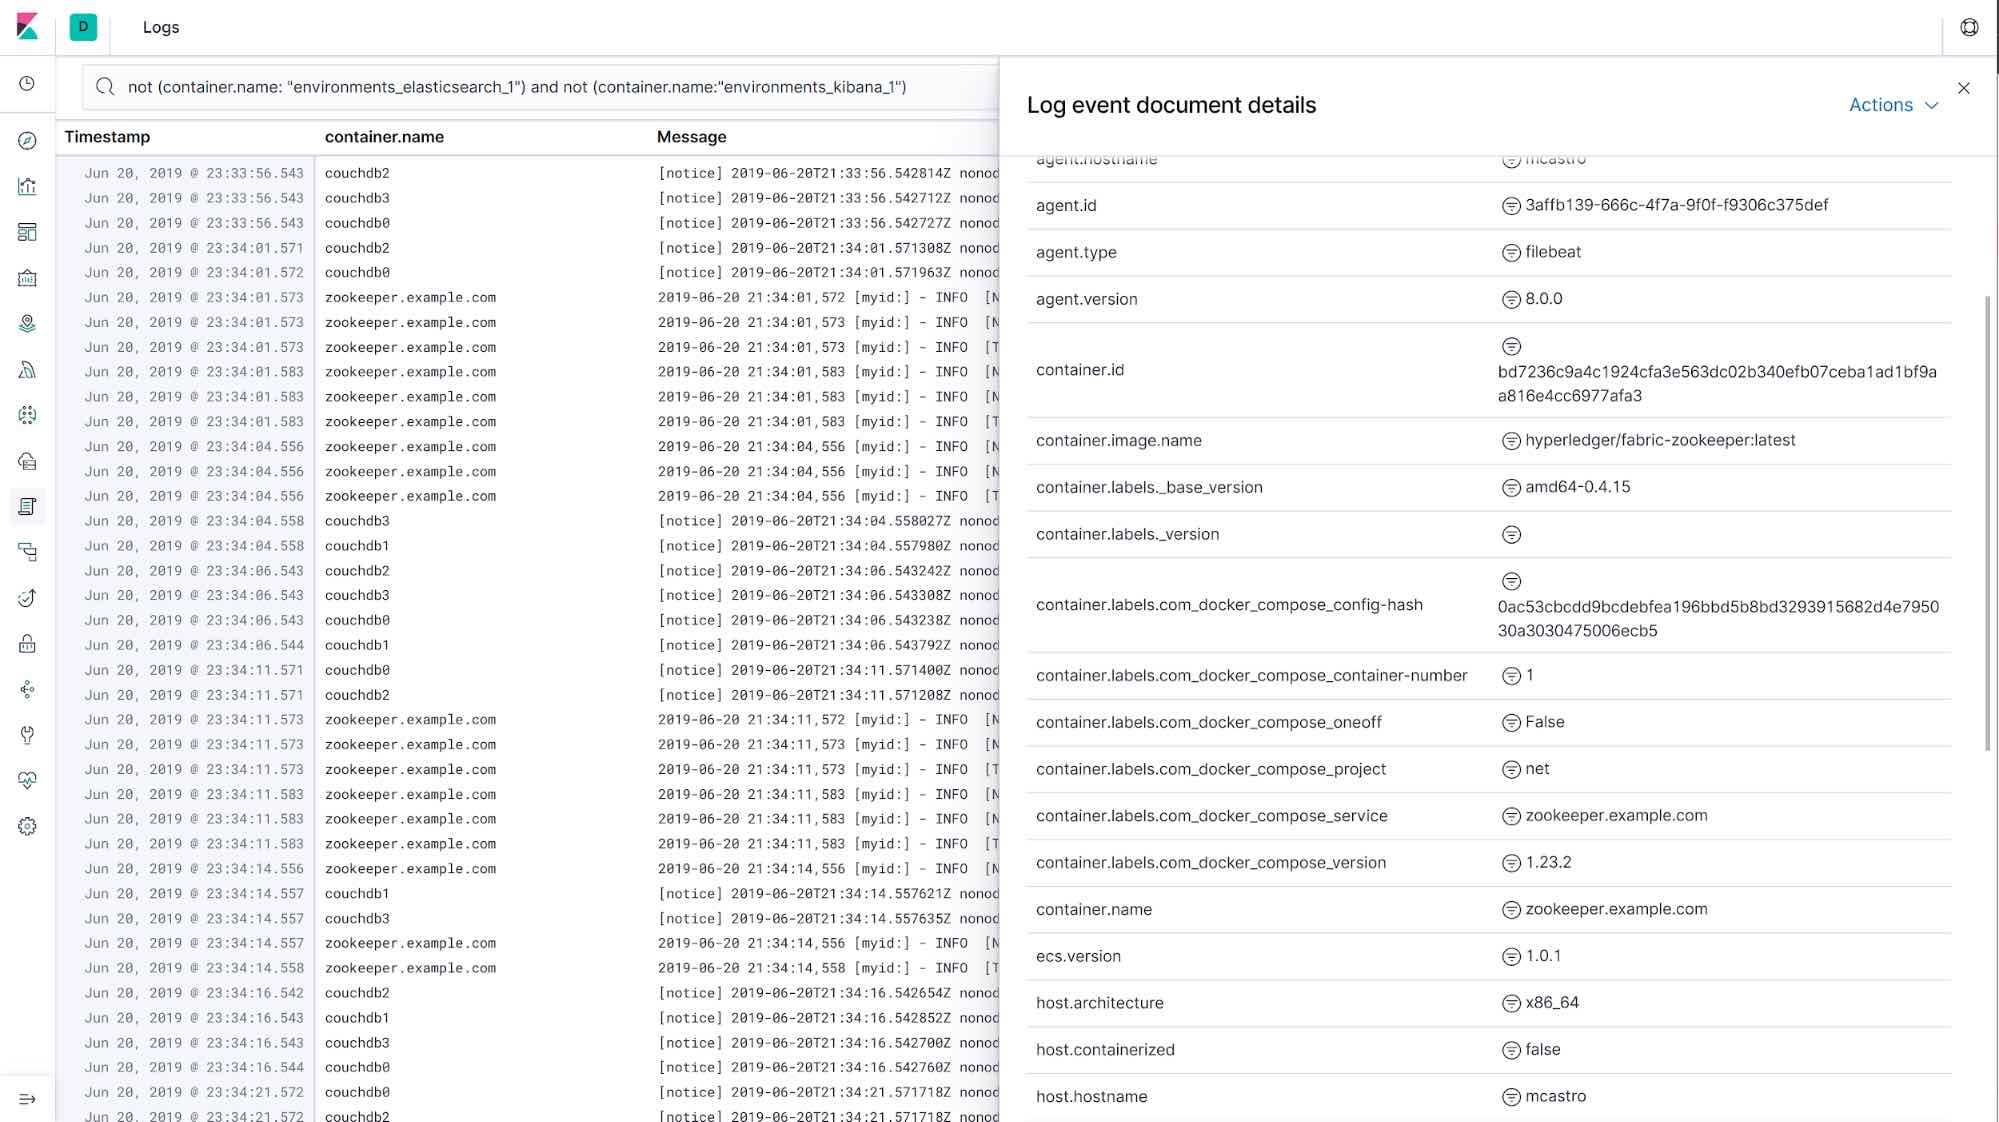
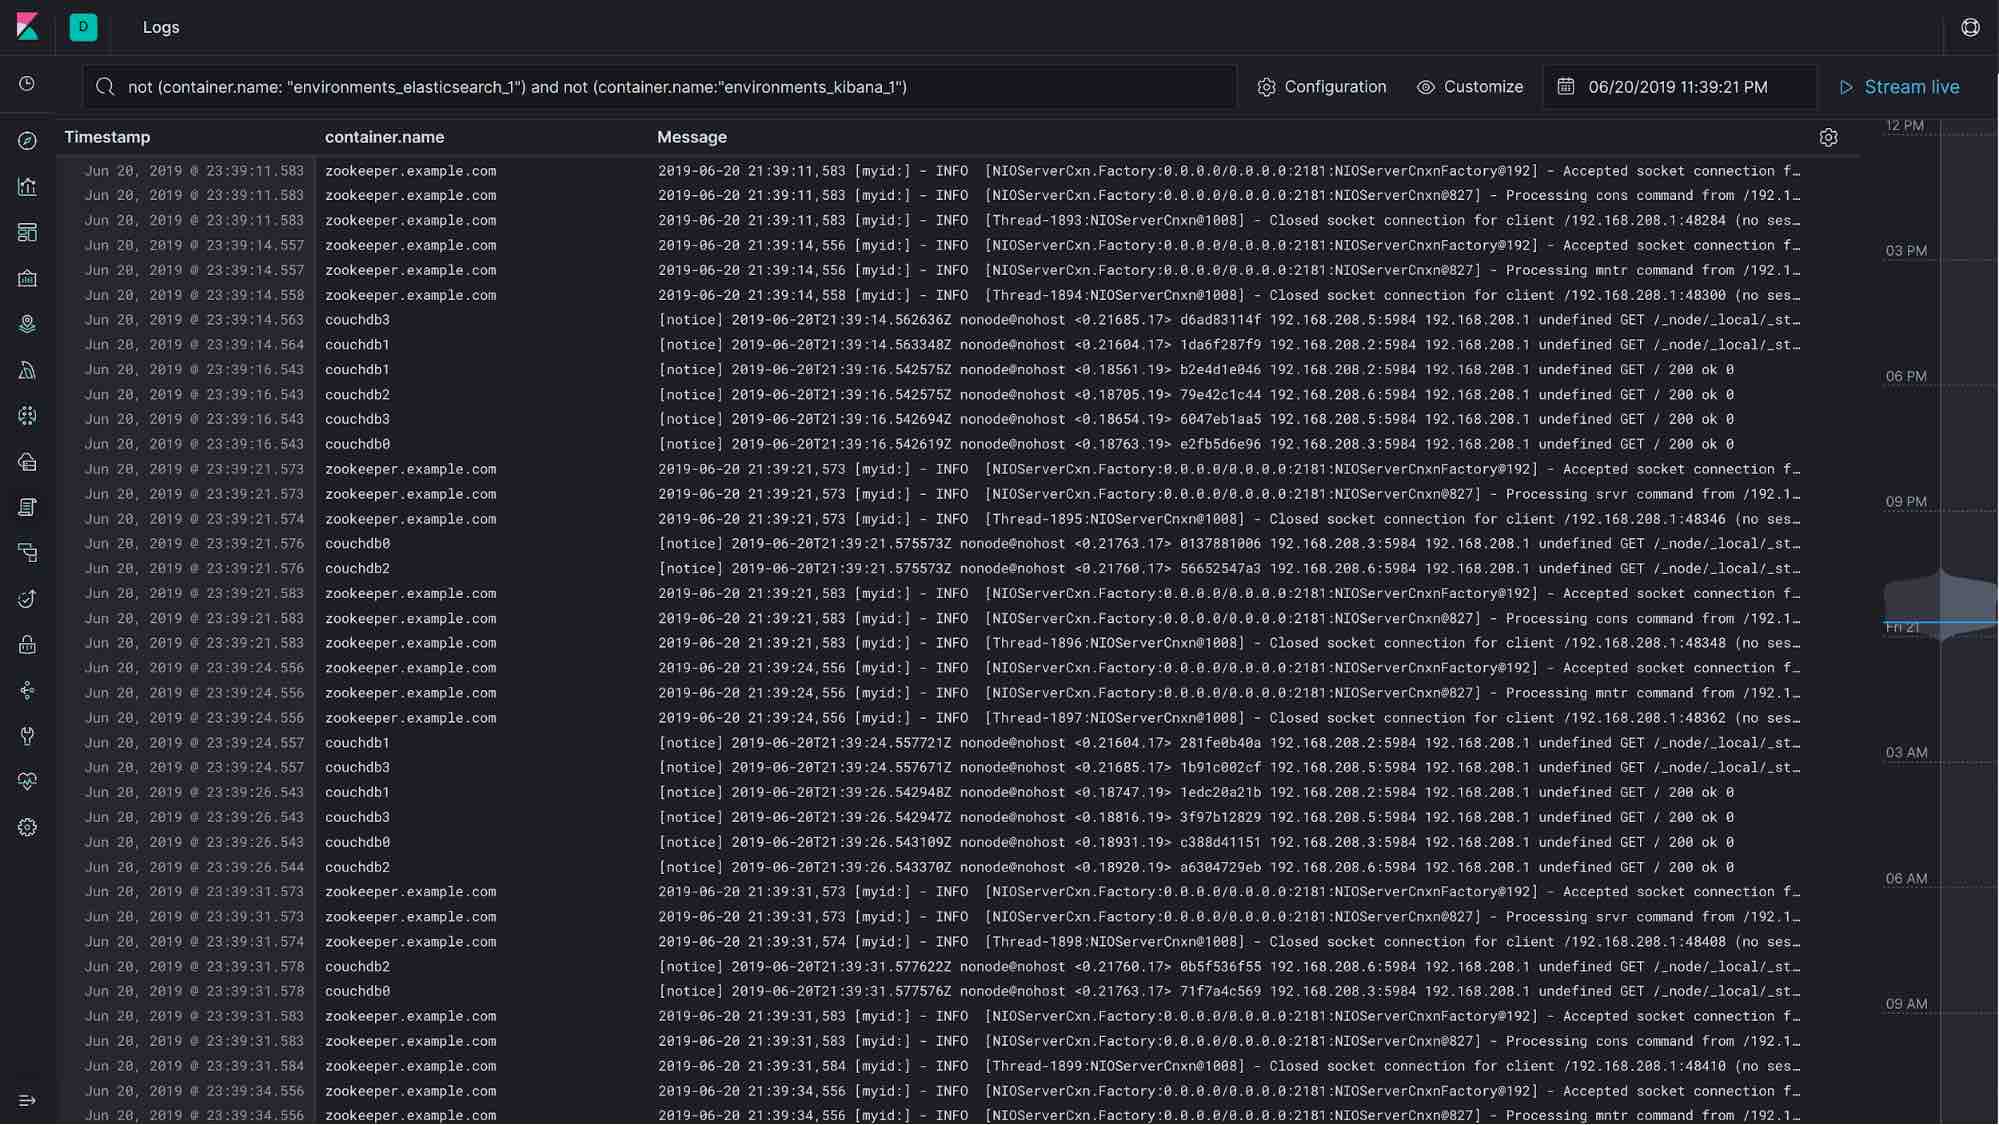
Apart from the Discover tab, you can also use the Logs UI to have a never-ending stream of logs with customized columns and data:
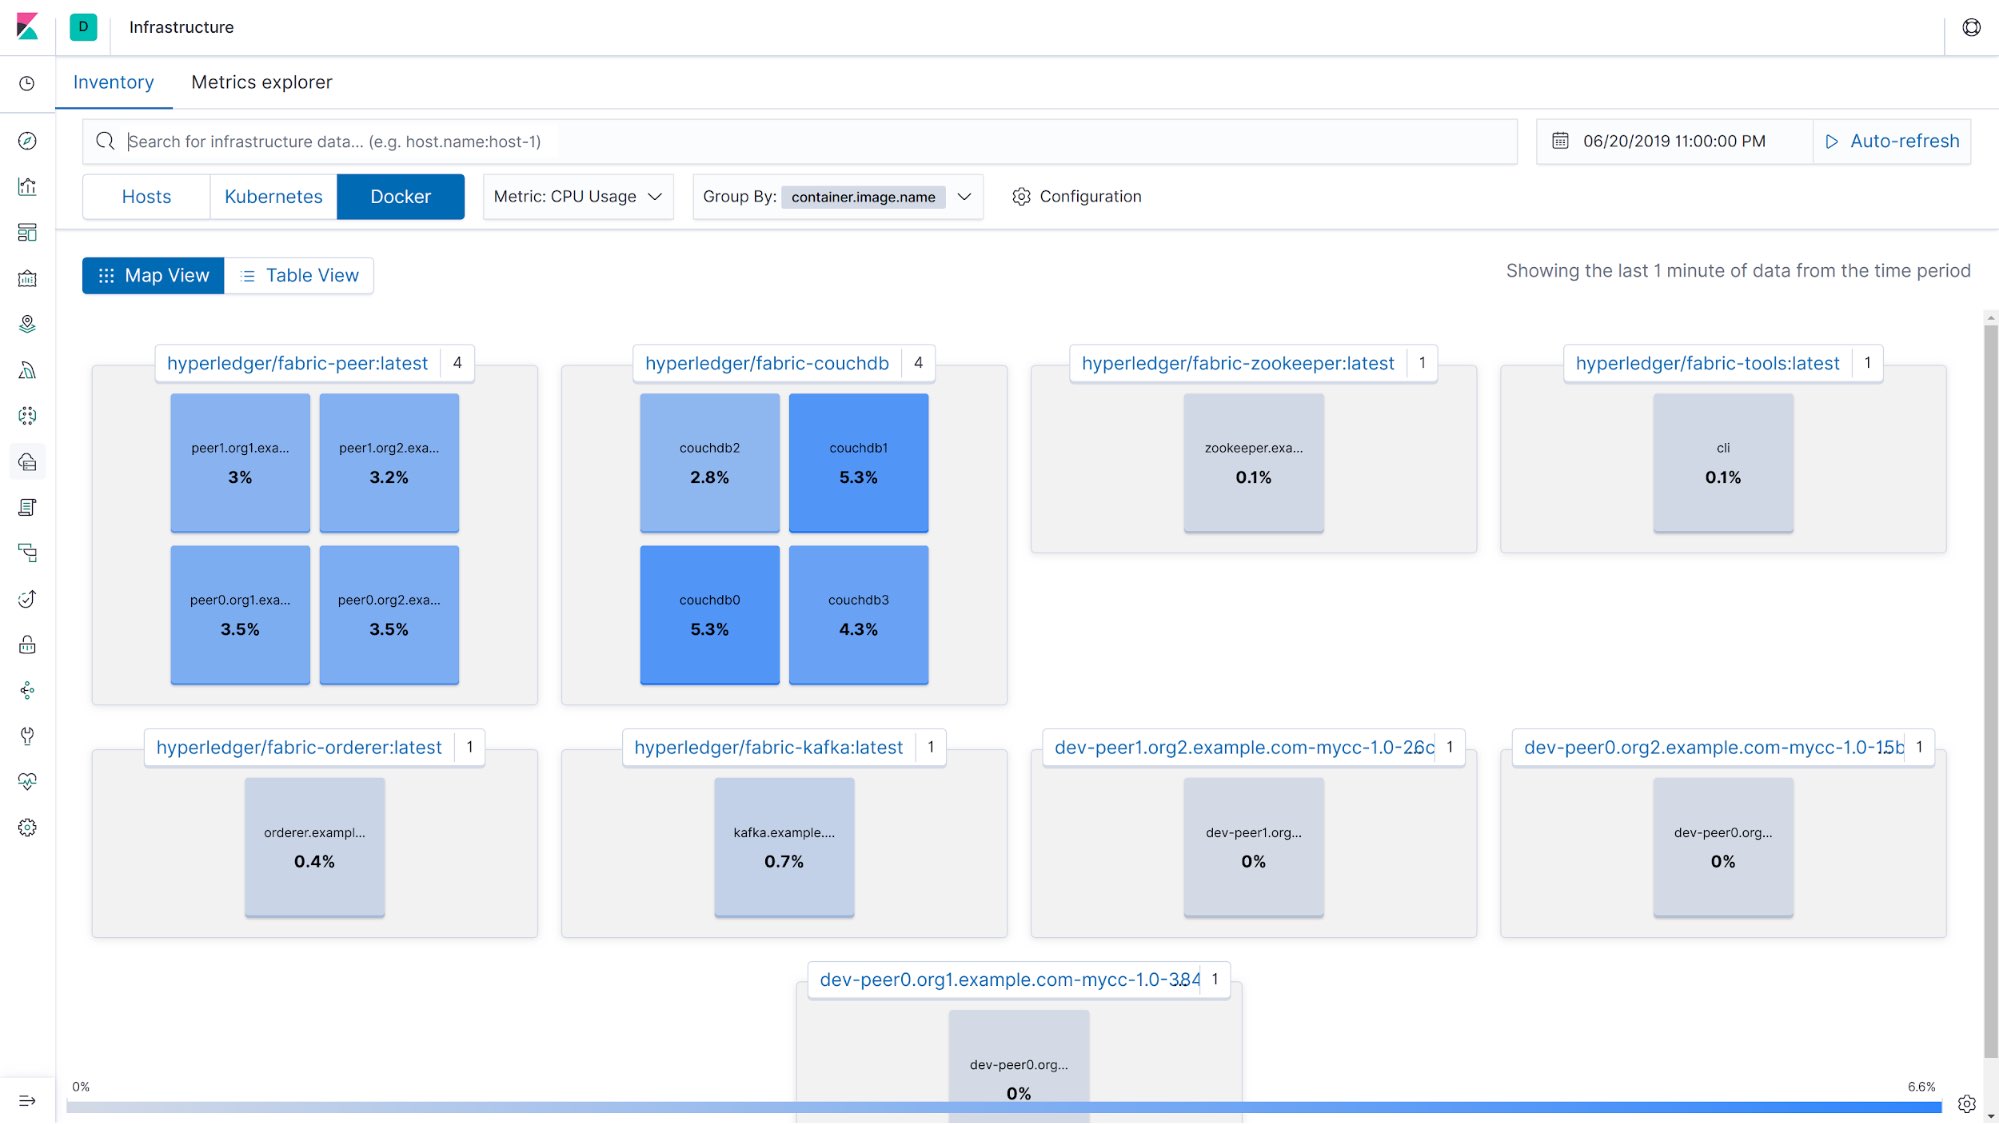
Finally, if logs, metrics, and uptime data playing together weren’t enough, you can also use the Infrastructure app. There you can see a different view of the infrastructure; in this case, we grouped the containers by image name to see their CPU usage.
The Elastic Stack for observability is critical for any complex distributed system, but don't forget that you must also instrument your apps with Elastic APM solution to "close the circle" of observability inside your product: logs, metrics, uptime, and tracing.
Bonus! Did you know that Kibana now has dark mode? If you want to give it a try, just go to Management - Advanced Settings and activate it! :) Here we can see the Logs UI in dark mode:
Want to see it in action?
You can start monitoring your Hyperledger Fabric today by signing up for a free trial of the Elasticsearch Service on Elastic Cloud, or you can download it as part of the default distribution of the Elastic Stack. Grab the Metricbeat and Filebeat executables appropriate for your platform and start monitoring!