Real-time monitoring of Fastly metrics with the Elastic Stack and Haskell
The Stack Infra team at Elastic uses many services to provide downloads for projects like Elasticsearch and Kibana to our users. One of these services is Fastly, which helps us optimize delivery to regions around the world. Keeping an eye on the performance and behavior of our CDN is important to ensure we're operating at the level we expect.
Key Metrics
Fastly provides a few ways to gain better insight into your services. Log streaming with Elasticsearch provides a native logging integration, and the real-time metrics API offers collection of different statistics. Gaining visibility into the behavior of specific points of presence can be critical when digging deep into problems, especially when offering content on a global scale. For example, we might want to find which region errors are spiking in, or determine how traffic volume has changed within the past hour in Austria. The real-time metrics API can help answer these types of questions.
Understanding the API
The Fastly real-time metrics API is relatively straightforward. Given a service ID (an alphanumeric string), we can retrieve a snapshot of real-time metrics scoped to this service. Per the documentation, we send a timestamp of 0 in the initial request. We use the tools curl and jq to send and parse responses:
$ curl -H"Fastly-Key: $FASTLY_KEY" https://rt.fastly.com/v1/channel/<id>/ts/0
The response to this request is a large JSON object containing metrics for various points of presence, including a Timestamp key to use for later requests:
$ curl -H"Fastly-Key: $FASTLY_KEY" https://rt.fastly.com/v1/channel/<id>/ts/0 | jq .Timestamp
1591205140
$ curl -H"Fastly-Key: $FASTLY_KEY" https://rt.fastly.com/v1/channel/<id>/ts/1591205140
Typically, we would inject some time to wait between these two requests to let metrics aggregate between requests.
This is great! We can send these metrics along to Elasticsearch to create custom dashboards in Kibana and even leverage alerts to keep an eye on key metrics. But how can we make this better? By writing a small utility to do the work of fetching metrics and indexing them into Elasticsearch for us. We can make this process more resilient, performant, and generally useful.
A Generalized Tool?
One of Elastic's Source Code principles is that of Space, Time: room to experiment and learn with new and interesting approaches to problems. The preceding sections outline a pattern that isn't too esoteric: we'd like to fetch JSON objects, most likely munge the data a little bit, and index it within Elasticsearch.
Haskell is a compelling programming language with powerful features, but with a small set of practitioners in comparison with other programming languages. The Fastly real-time metrics API use case presented an opportunity to take a well-understood task and solve it with Haskell to develop a better understanding of the language within the experimental Space, Time principle.
Given the room to experiment, a problem to solve generally, and a language ecosystem to use, we developed a tool for this space - and we gave it a unique name, in the time-honored tradition of the Stack Infra team (and its love for Guy Fieri).
Beefheart
Beefheart is a small, easy-to-use Haskell daemon that runs continuously to index Fastly real-time metrics into Elasticsearch. Here's what many, many terabytes of traffic look like when piped through Beefheart and visualized in Kibana:
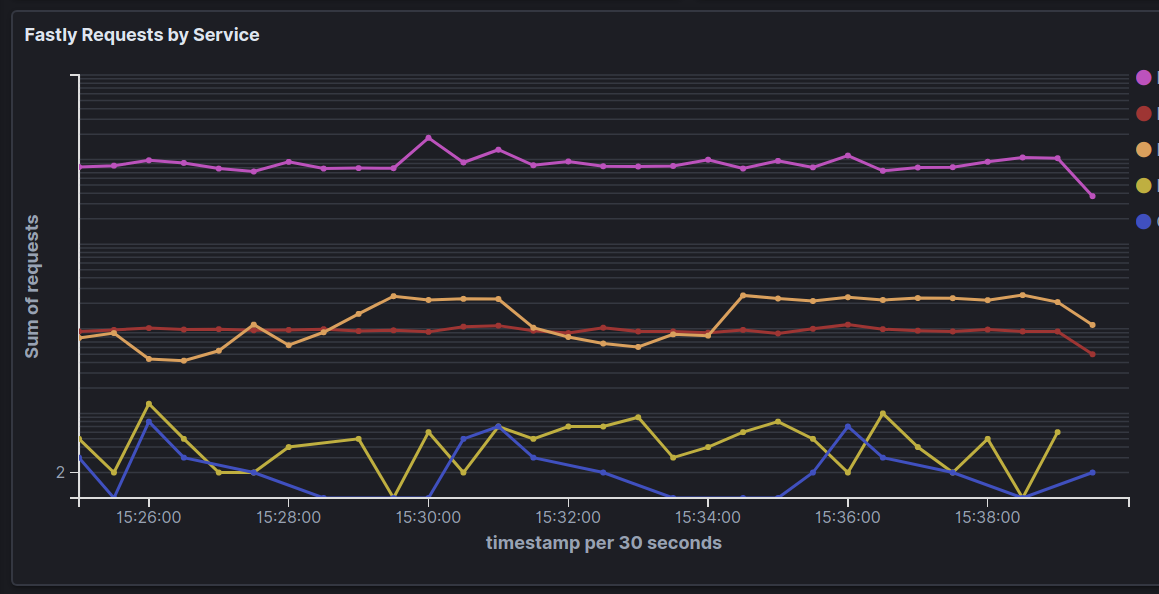
Beefheart auto-discovers services in your Fastly account, has retry logic built-in to compensate for network instability, and self-manages index lifecycle/data expiration. The project's GitHub repository contains the code and usage instructions, but I'd like to take some time to talk briefly about the experience of writing a production Haskell service.
For context, this service has been operating reliably in our infrastructure for several months and has provided us with useful metrics during that time.
Ecosystem and Community
A monad is like a burrito. Wait, let's try that again.
Sending HTTP requests and reading/writing JSON is a pretty core aspect of many programs, and Haskell's support here is on par with many other languages, but with the added benefit of its powerful type system.
As an example of this, consider the Fastly API for a service. Using Generic instances, we can express the responses we expect from this API as a well-defined type, and then simply ask Haskell to derive the logic for serializing our type to and from JSON. Beefheart's ServiceDetails type is a succinct example of this. One primary benefit of this is that, any time we work with a ServiceDetails value in the code, we can know that, for example, the versions key will always be present without fear of attempting to access a non-existent JSON key.
data ServiceDetails =
  ServiceDetails
  { deleted_at  :: Maybe UTCTime
  , created_at  :: UTCTime
  , comment     :: Text
  , customer_id :: Text
  , updated_at  :: UTCTime
  , id          :: Text
  , publish_key :: Text
  , name        :: Text
  , versions    :: [ServiceVersion]
  } deriving (Generic, Show)

instance FromJSON ServiceDetails
instance ToJSON ServiceDetails
The req HTTP request package provides similar guarantees to help ensure various code paths and failure cases are well-accounted for when sending HTTP requests to both Fastly and Elasticsearch endpoints.
The Haskell community is active and engaged. The stack build tool makes development simple, and projects like haskell-language-server are under active development. The author would like to offer a particular shout-out to the Haskell channels in the functional programming Slack community, which have been helpful and welcoming.
Concurrency
Early on in the development of Beefheart, the metric fetching logic was a simple recursive loop: for each Fastly service ID, a request would be sent to retrieve metrics, and continue serially along the list of monitored services indefinitely. The performance here is adequate, but given room to experiment, we wanted to find what it would take to turn these inherently independent I/O operations into distinct threads.
It turns out that this ends up looking very elegant when each task is put into its own, independent IO () action. The async package provides easy-to-use functions like forConcurrently to fan out tasks in a list into individual threads.
-- Run each of our threads concurrently:
queueWatcher app gauge -- Our monitoring/instrumentation thread
  `concurrently_` indexingRunner -- Elasticsearch bulk indexer
  `concurrently_` forConcurrently services -- And, concurrently for each service:
    (metricsRunner indexNamer) -- Spin off a thread to poll metrics regularly.
One interesting piece of this problem is sharing thread-safe values: as we retrieve metrics values from Fastly, sending these along to a worker thread to index them into Elasticsearch must happen in a thread-safe manner to avoid concurrency bugs. The approach taken in this project is to leverage STM values to enqueue and subsequently dequeue bulk Elasticsearch operations. The technique is less complicated than you would think: after creating the thread-safe bounded queue, we use one function to enqueue BulkOperations, and then pull them off the queue in another function that indexes them in Elasticsearch. Running these operations across multiple threads occurs safely because they happen within the STM monad.
Visibility
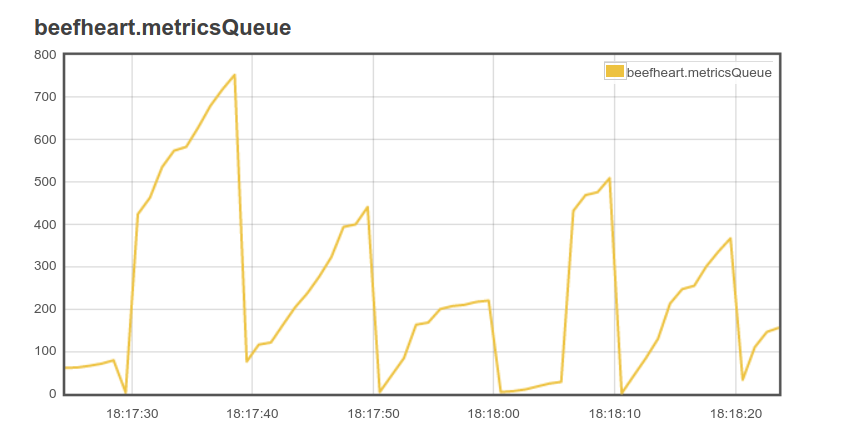
In general, most Haskell programs tend to behave as you would expect once they compile, but building in some observability can help with operational maintainability. The ekg package has been tremendously useful in this regard for the Beefheart project. Simply by spinning off another thread that regularly polls the shared bulk operations queue, we can see documents get flushed from the queue at regular intervals and watch the program work in real time:
Moreover, the ekg-elasticsearch package can send these runtime metrics directly to Elasticsearch. Doing so means that you can create Kibana dashboards for metrics like resident memory allocated to Beefheart during program execution.
Elasticsearch, Haskell, and Fastly
Elasticsearch provides many useful tools to make Beefheart even more turnkey and easy to use from the perspective of an operator. One common technique when ingesting continuous streams of logs or metrics is to leverage a periodic job of some type to regularly prune old data to avoid exceeding disk space on hosts running Elasticsearch. Beefheart uses the ILM API to set up default policies to regularly prune and retire data to avoid filling up disks.
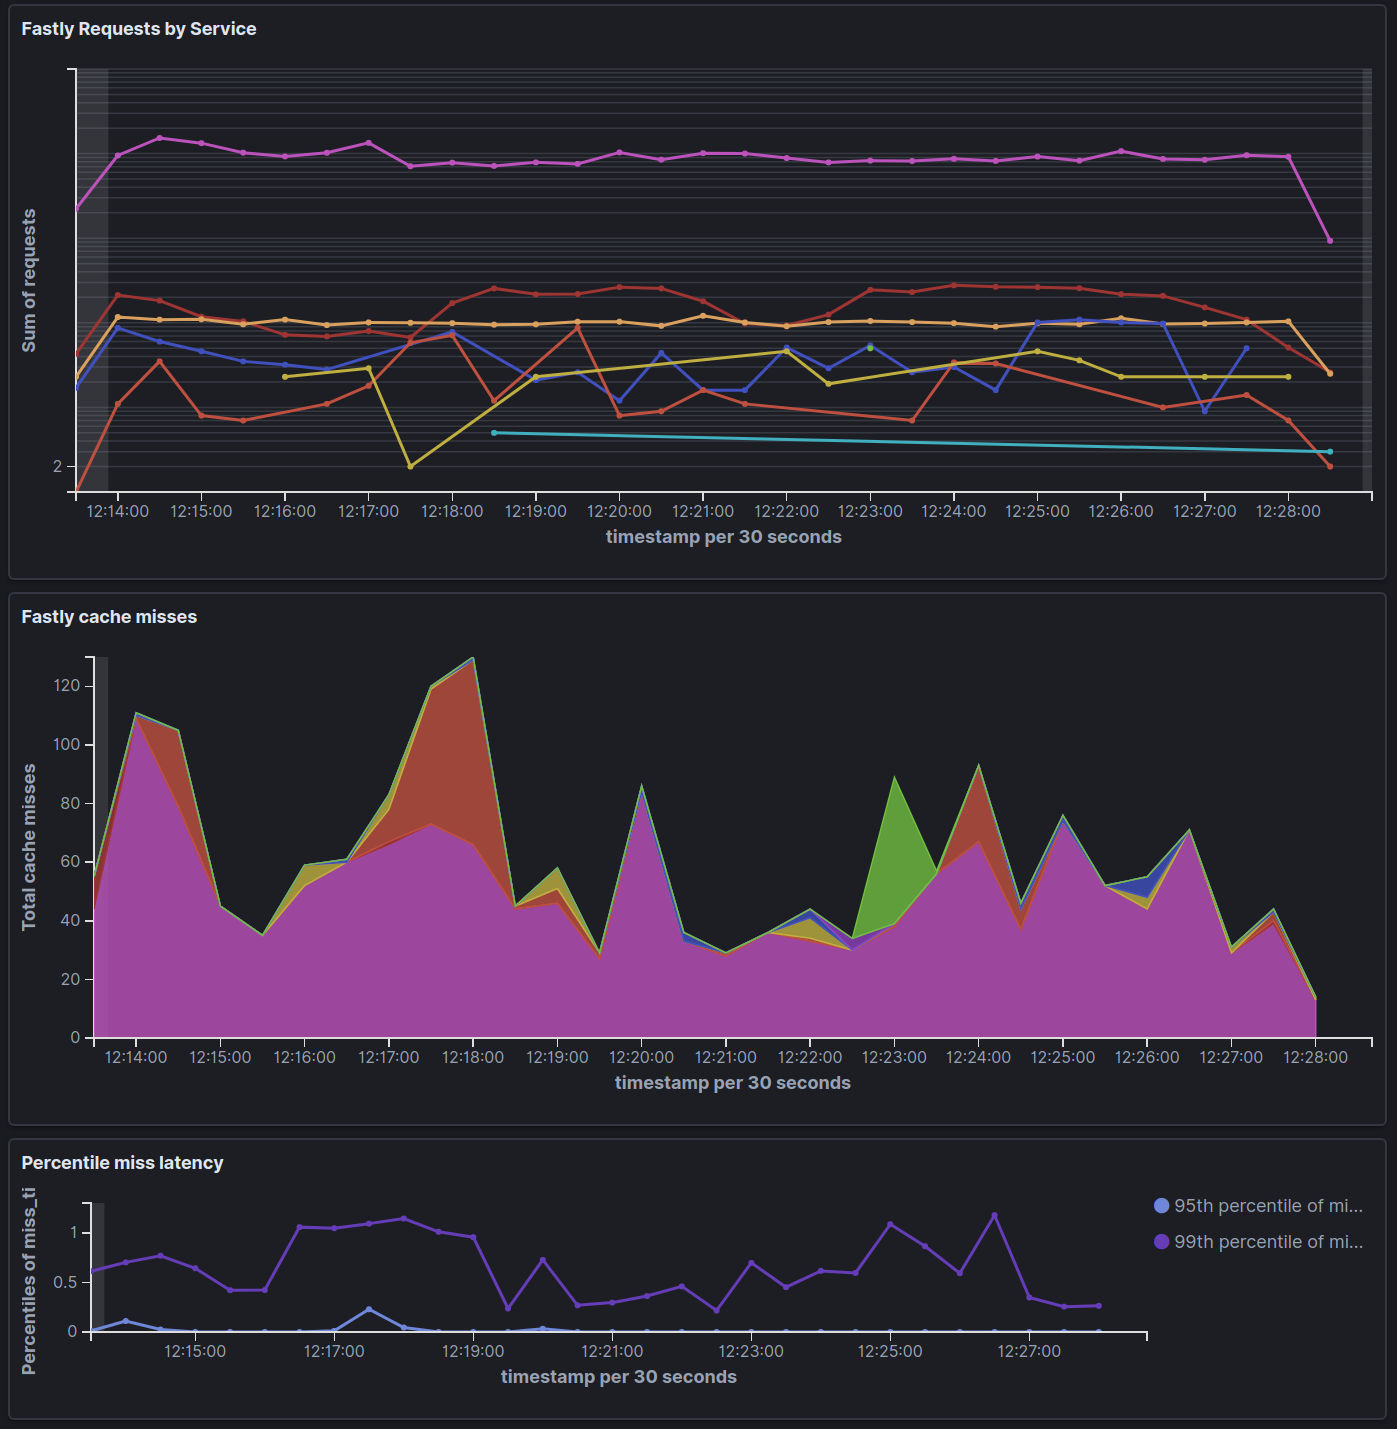
Beefheart also closely controls mapping types to ensure that useful aggregations, such as summing total response or request size over a given month, occur as expected. The following Kibana dashboard represents a few aspects of our Fastly services: request count, cache misses, and 95th and 99th percentiles for miss latency.
Elasticians are strongly encouraged to share what we learn in Space, Time projects. Beefheart includes thorough documentation to make it approachable to users interested in seeing Haskell in real-world practice. As an example, the code for collecting metrics contains extensive explanation for how Beefheart handles exceptions. With all that said, Beefheart is a first-time public Haskell project for its authors, so improvements and code corrections contributed to the GitHub repository are more than welcome.
Start Monitoring Your Fastly Services Today
Beefheart works with any recent Elasticsearch version, including those hosted on Elastic Cloud if you'd like to try a free trial of our hosted Elasticsearch Service, a local instance, or in Docker. A minimum version of 6.7 is recommended to use features like ILM.
We'd love to hear your feedback - collaborate with the project on GitHub or chat about this and other observability tools on our forums!