How to set up Elastic Cloud: Advice from Elastic Support
I hate reinventing the wheel once I find a good setup. On top of that, I dislike searching for all the links I used to come up with the “ultimate setup” for different services. So, I decided to outline for myself (and for you of course) my default setup when I deploy on Elastic Cloud to set myself up for success and automate insight for the future. Most of my setup steps make monitoring accessible or automate various warnings to myself.
By the end of this article you will have configured your cluster for full observability, which includes metric and log collection, troubleshooting views, and cluster alerts to automate performance monitoring.
Start up the party
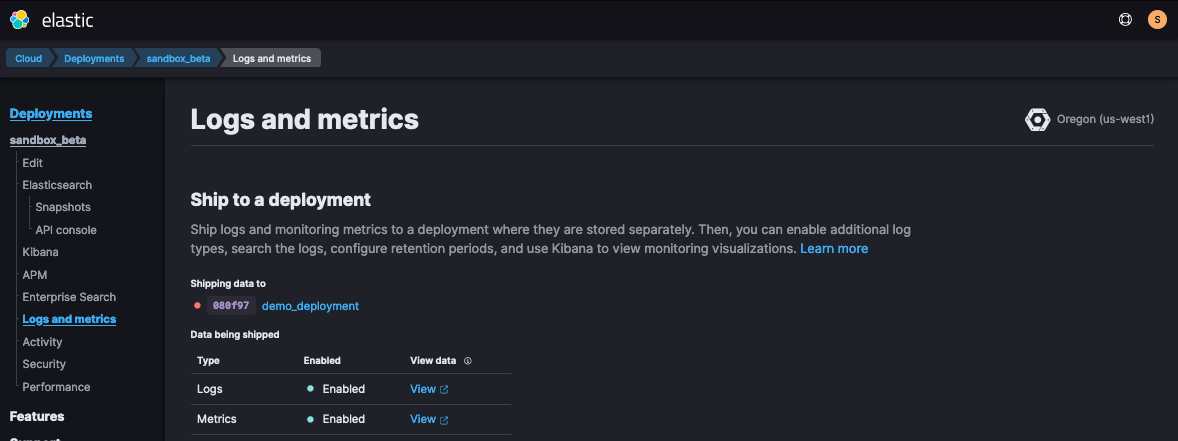
In Elastic Cloud, once you’ve created a new Deployment, you’ll want to enable Deployment > Logs & Metrics. If dev testing, you might do self-monitoring, but anything Production should go to a separate deployment.
Once your deployment is created, you may prefer to update your deployment configuration to see your Elasticsearch proxy traffic. To do this, edit the deployment’s elasticsearch.yml to include the following:
- xpack.security.audit.enabled: true
- # xpack.security.audit.logfile.events.include: _all
- # xpack.security.audit.logfile.events.emit_request_body: true
The last two lines are commented out for now but left there as placeholders to easily turn on in the future. It generates large sized logs but is helpful to turn on temporarily when troubleshooting traffic request bodies.
How’s my baby?
Once I’ve enabled monitoring, I can view my deployment’s health via Kibana > Stack Monitoring.
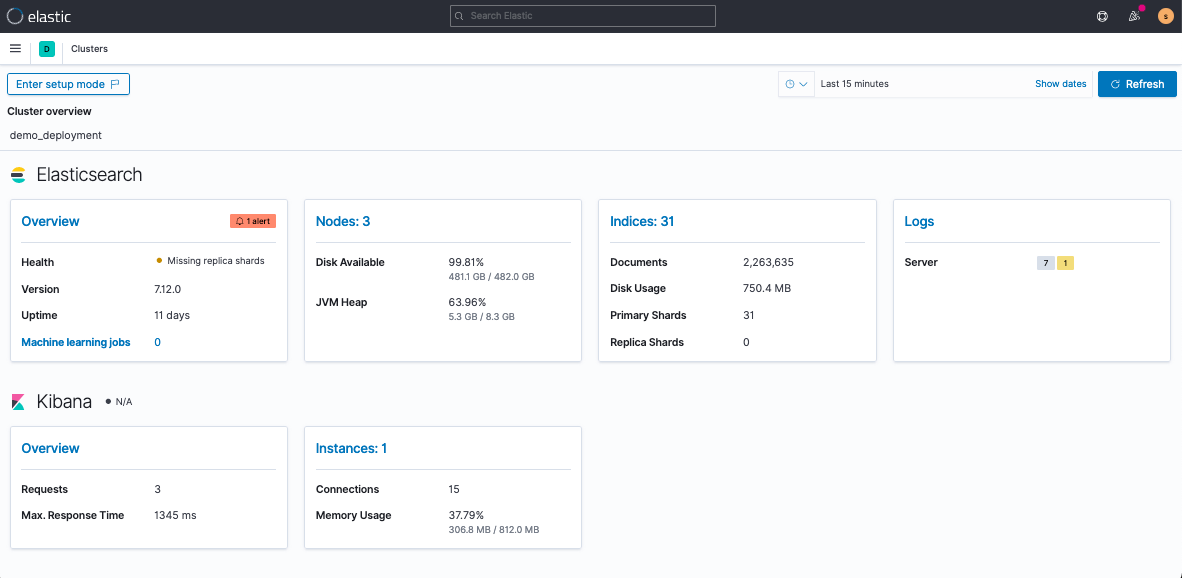
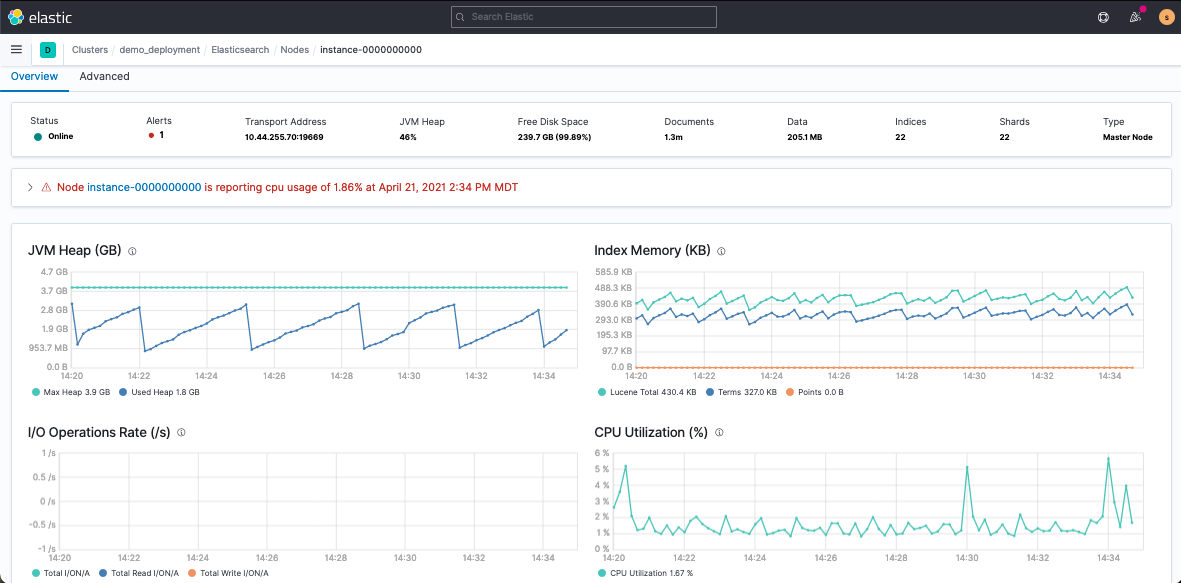
These views will help you troubleshoot traffic and monitor deployment health. The Node view will be your best friend when it comes to monitoring cluster CPU and JVM strain.
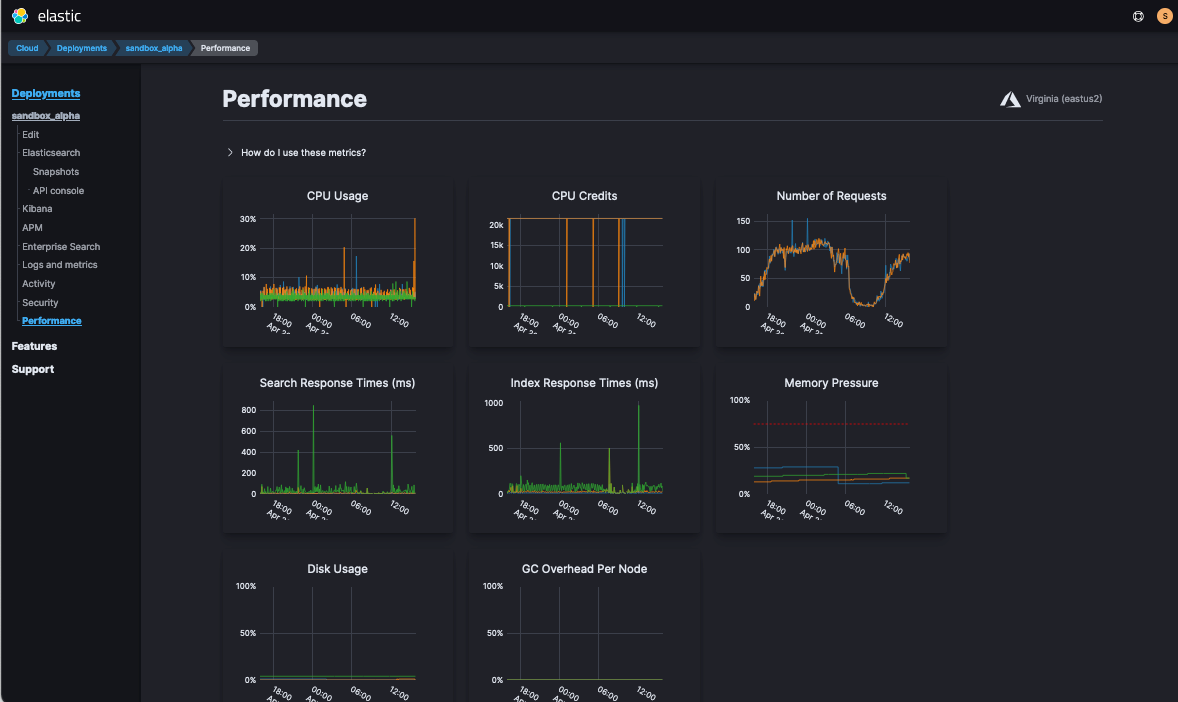
If you’re ever in a rush, you can check the overview from Elastic Cloud > Deployment > Performance.
Show me the logs
If you find a suspicious timeframe, you can investigate it via Kibana > Observability > Logs > Stream. This is heaven sent when deployments have issues since it shows the errors of what’s wrong in real-time!
Pro tip: The logs you see in the Stream view are part of the same logs Elastic Support reviews when a deployment experiences issues.
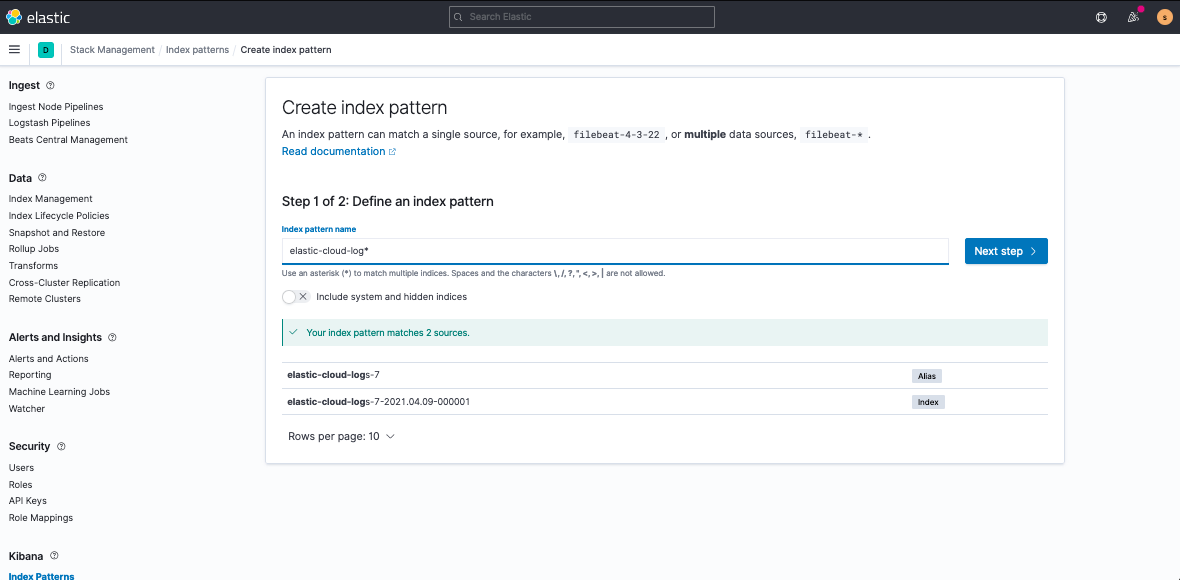
Discover is also a great option for investigating widespread historical patterns, but requires a quick set up. Under Kibana > Stack Management > Index Patterns, you’ll create a pattern for elastic-cloud-logs* using the time_field:@timestamp to sit on top:
Now, when you navigate to Discover or Stream, you’ll see, for example, if you’ve misconfigured your SAML authentication set up:
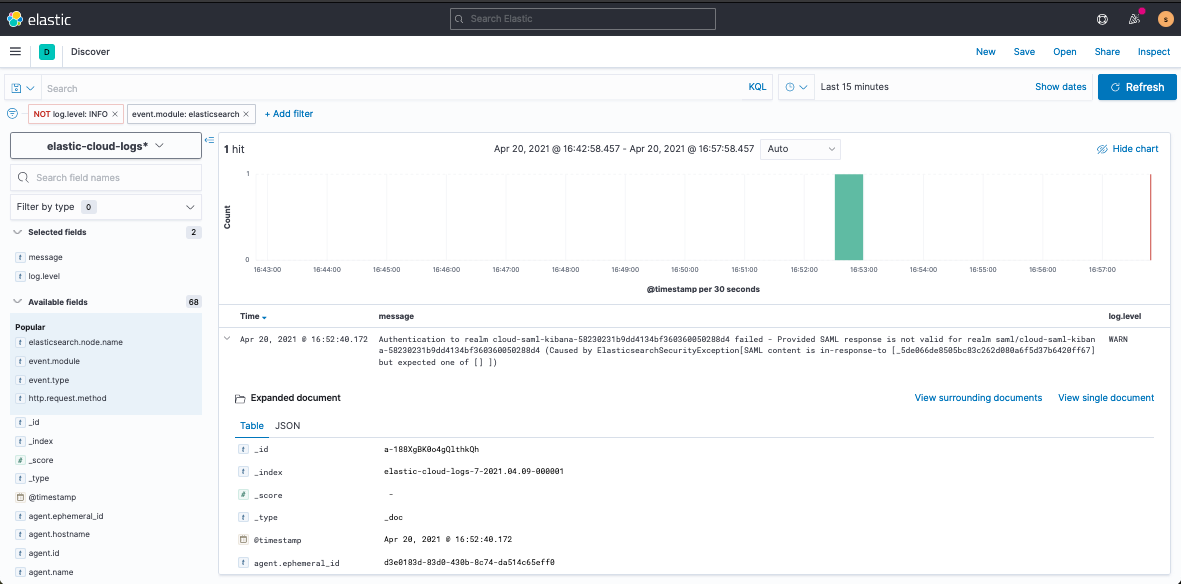
To be fair, this doesn’t usually come up on set up day, but it’s better to be prepared for potential future issues.
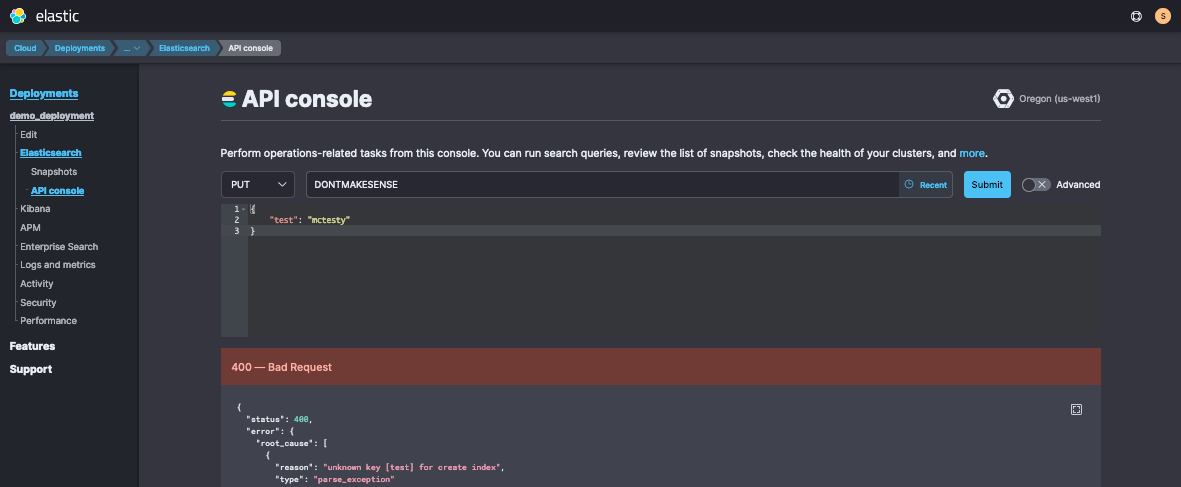
As an example of frequently investigated columns, you can use this view to test your proxy traffic requests. After inducing an example bogus request from the Deployment > Elasticsearch > API Console:
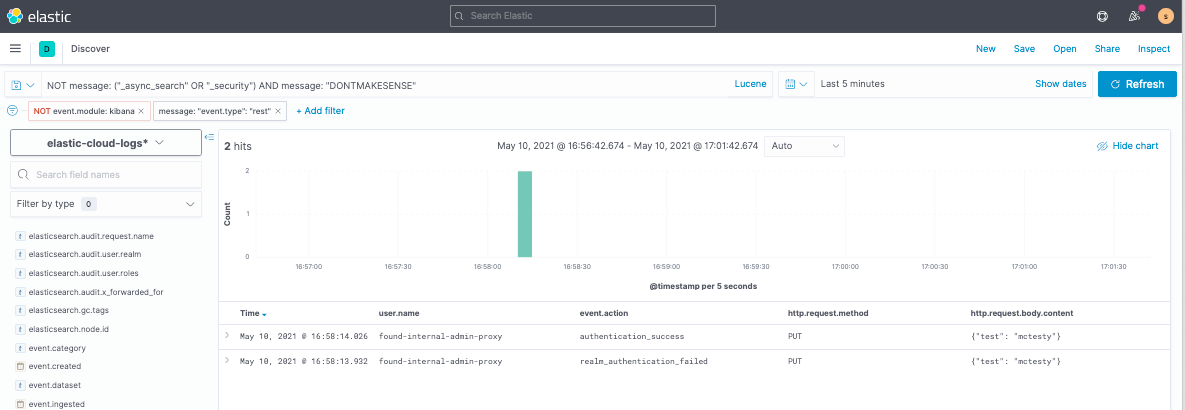
Then you’ll see it reported as a new log. (Audit logs do not currently report the HTTP response status code, but they do report a correlating event.action column.)
Wake me when you’re ready
The data world, by various naming conventions, lives and breathes these steps:
- consolidate influx,
- standardize data,
- make accessible,
- determine alerting,
- automate recovery.
Elastic handles steps 1 and 2 and most of 3. Kibana Alerts automates step 4. When they hit step 5, I’ll be out of a job.
Step 4 is a really cool conversation right now, because you can now take advantage of default Stack Monitoring alerts out-of-the-box. You don’t have to do anything other than enable Logs & Metrics to get them.
On top of the default index writing Kibana Action, you might want to piggyback with custom actions, like Slack. To set up these notifications, you’d first set up a Slack Connector and then append it to the default Alert.
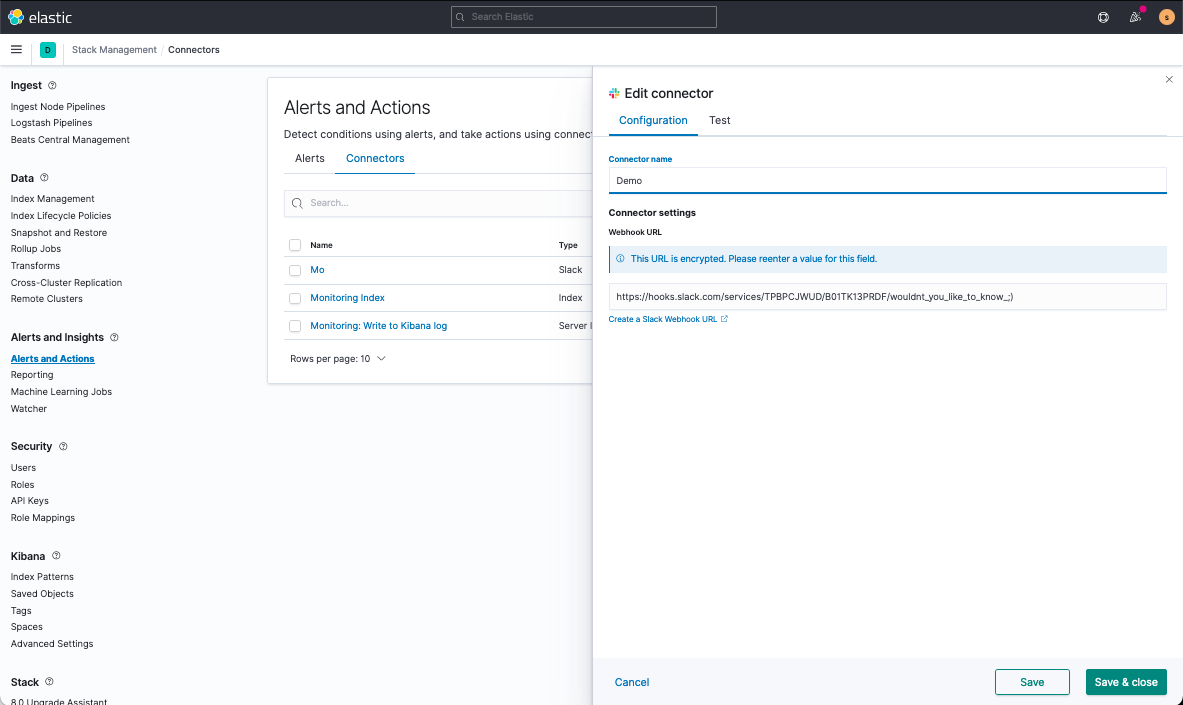
First, navigate to Kibana > Stack Management > Alerts and Actions > Connectors and create your Slack Connector.
Second, under Stack Monitoring, you’ll Enter Setup Mode and navigate to edit an alert. Scrolling to the bottom of the screen, you’ll add your Slack connector as an action and set up a customized message.
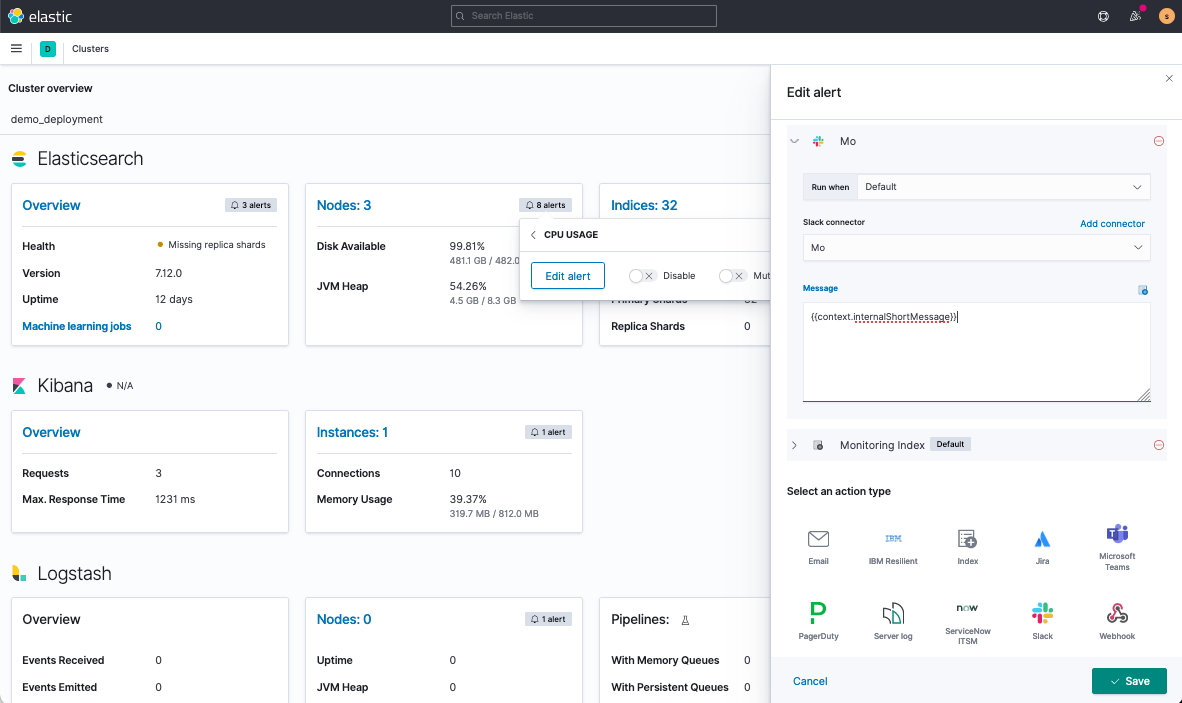
Once saved, if your CPU alert goes off, you’ll get a Slack notification to investigate if your cluster’s experiencing a traffic blip or if you need to scale out. I usually automate the latter with Elastic’s Autoscaling.
I’m always angry ready
At this point, there are two methods to monitor ongoing health, which are viewing deployment logs and automated alerts. When issues come up that you need to troubleshoot, you’ll frequently start with the same queries to determine which rabbit hole to investigate. As a managed service, Elastic Cloud is here to help you manage the maintenance and upkeep. As you manage, monitor, and troubleshoot your deployment make sure you have an understanding of the shared responsibilities between Elastic and yourself so you know what issues you need to remedy to keep your deployment running smoothly.
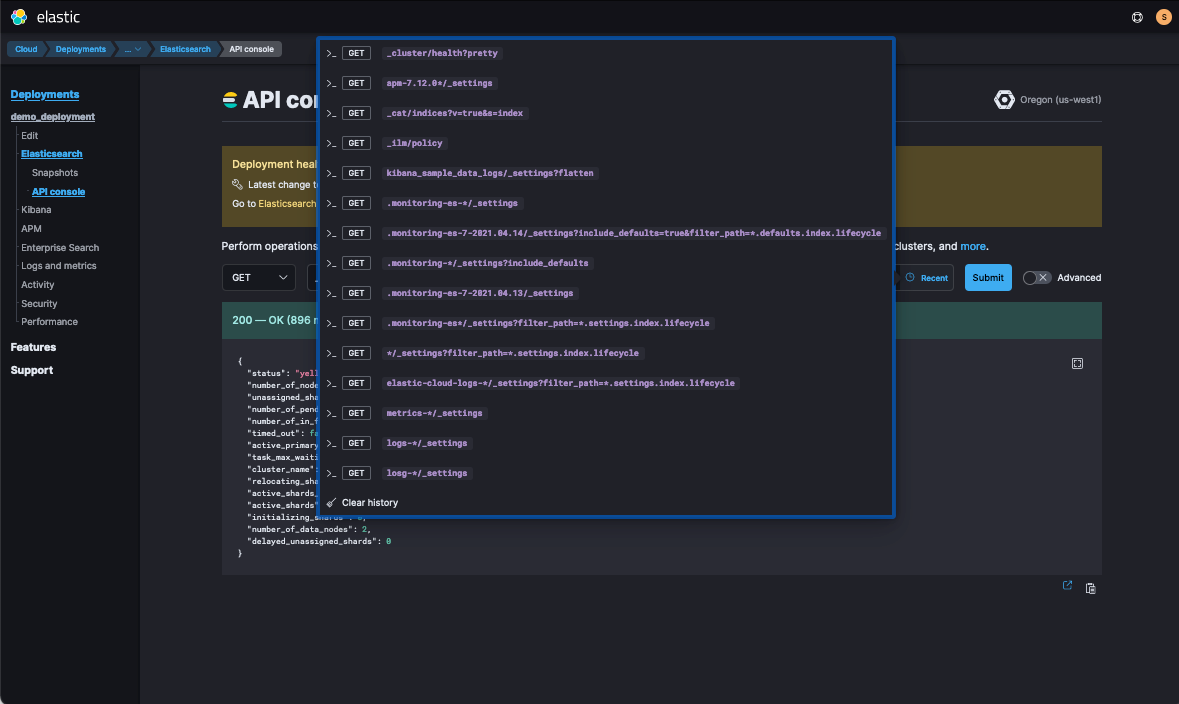
You can run these commands from my Kibana > Dev Tools or from my Elastic Cloud > Deployment > Elasticsearch > API Console. In the API Console, once you run _cluster/health, you’ll be able to see it in the Recent requests drop-down.
Now which queries to front-load, you may ask? You can learn more top queries you should run for your deployment by reading our blog Managing and Troubleshooting Elasticsearch Memory.
That’s all folks!
Wooh! Now you don’t have to worry if your deployment’s ok, because you’ll be notified when it has trouble and will already have data views set up to strike back. (Take that new junior developer who decides to flood bulk requests at midnight. I still <3 you!)
At this point, if you’re experiencing trouble implementing any of the above steps or want to set up further monitoring customizations (such as a drop in ingest traffic), feel free to reach out! We’re here and happy to help! You can contact us via Elastic Discuss, Elastic Community Slack, Consulting, Training, and Support!