How machine learning in the Elastic Stack keeps Leaseweb secure
Looking for an alternative to Splunk? Learn how migrating to Elastic from Splunk can help you unify your observability and security data into a single platform, while decreasing your overall costs and admin overhead.
Leaseweb is a global Infrastructure-as-a-Service (IaaS) provider offering customers hosting solutions to boost their business while cutting costs. From our beginning 20 years ago, our founders envisioned how they could use their skills and experience as professional pilots to build out the Internet as a service in hopes of making it accessible and available to everyone. Today, that same vision remains part of our DNA. With over 80,000 servers spread across 20+ datacentres around the globe, Leaseweb provides its services to digital natives everywhere. Our operations are managed from multiple hubs, with the main set of activities being deployed from our global headquarters in Amsterdam.
We embrace open source and security. That’s where Elastic comes into play.
Securing at scale
Keeping a company of our magnitude secure is not an easy task. With over 600 employees spread across 4 time zones and running on a global infrastructure, we established that our current monitoring solution was not sufficient to meet our needs. We concluded that, with the amount of data and traffic we need to process, secure, and retain for compliance reasons, not only were solutions such as Splunk too cost intensive, but they also didn’t quite provide us with the fine-grained search capabilities that we were going to need for our use case. After looking at multiple solutions, we ended up picking Elastic.
Originally, we were drawn to Elastic for the open source nature of the product. However, other factors played a big role: the responsiveness and quality of the support team, the ability to onboard almost any type of data source, and the important machine learning capabilities that come with a subscription.
Switching to proactive monitoring with Kibana and machine learning
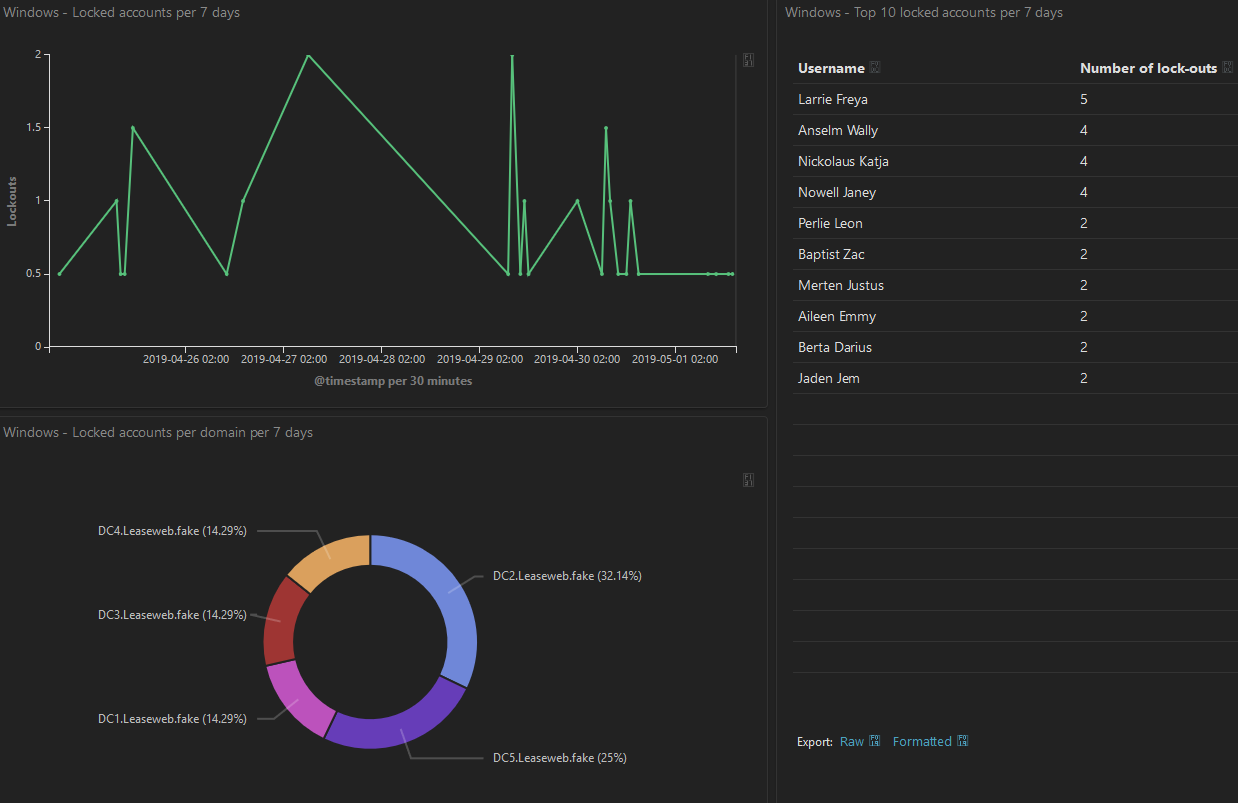
During the implementation of our setup, we onboarded multiple services, including firewalls, an anti-virus engine, and event logs of Windows domain controllers and endpoints, as well as data flowing from network appliances. Using Kibana, we built quite a lot of dashboards covering a wide range of information we needed, including:
- Important anti-virus activities on machines over time
- User management activity from Active Directory
- Failed logon attempts on our domains
- Account lockouts on our domains
- Notable events on the firewalls
- Possible hostile interactions with our support desk through our communication channels
- Tracking of ongoing attacks on our infrastructure

Onboarding all these sources gave us a multitude of advantages. For example, the security team can now respond much faster to incidents by being able to quickly search and visualize different sources of log data. They are also able to create flexible dashboards, allowing them to proactively monitor what is happening in the organization.
By using the machine learning features of the Elastic Stack on the ingested data, the system itself can alert our engineers on suspicious behaviour that is in need of investigation. Lastly, the extraneous information in the security logs allows us to assist other departments within Leaseweb when a problem such as loss of connectivity, establishing baselines, etc., arises. In one such instance, we saw a huge spike in certain types of requests made to our boundary firewalls. When using Elastic to drill down on this, we could see that some kind of DDOS attack was going on and we took appropriate mitigation measures.
Elastic also helps us keep track of known bad actors that are scanning or testing our systems. For instance, we once identified unusual behaviours in one of our firewalls that machine learning immediately flagged. After investigating, we understood that someone had attempted to breach our perimeter and were easily able to isolate the incident based on this alert and kept the attackers at bay.
Overall, machine learning in the Elastic Stack is quite helpful. If using a large enough dataset, we can anticipate issues and generate instant alerts for known or expected suspicious activities. It also helps us filter the noise by focusing on suspicious activities that we may not have been looking for.
Advice for your Elastic journey, and our planning for the future
What we have learned from our current implementation is that you really need to think about which sources you want to ingest, what value these sources have from a security perspective and/or how they benefit the company as a whole. It is also important to stay on top of the releases done by the Elastic team. We keep up with the latest updates, because even the smaller releases contain new features that are very useful (such as index lifecycle management). Also, keeping up to date helps in preventing surprises when a major upgrade comes along.
During the implementation, we had a lot of contact with the Elastic Support team. Most questions were regarding setting up visualizations or how to build certain queries, from incorporating machine learning data into graphs or building certain queries to get the correct information from the Elastic Stack. The response from the support team was fast and complete. We would advise any Elastic customer to involve their support representatives sooner rather than later.
In the near future, we plan on setting up more behaviour-based alerts using machine learning. We have noticed that if you set up the machine learning queries correctly, it can alert you before you even have an idea of what is going on. And that’s why we’re harnessing the Elastic Stack.