Gain the upper hand over adversaries with Osquery and Elastic


 Share on Twitter
Share on Twitter

 Share on LinkedIn
Share on LinkedIn

 Share on Facebook
Share on Facebook

 Share by Email
Share by Email

 Print this page
Print
With the Elastic 7.16 release, Osquery Manager is now generally available for Elastic Agent, making it easier than ever to deploy and run Osquery across your environments. By collecting Osquery data and combining it with the power of the Elastic Stack, you can greatly expand your endpoint telemetry, enabling enhanced detection and investigation, and improved hunting for vulnerabilities and anomalous activities.
This blog post gives a brief intro to the Osquery Manager integration for Elastic Agent and how it can be used in conjunction with Elastic Security. Included are examples that show how to operationalize the Osquery data with use cases such as building critical security alerts, querying isolated hosts during investigations, and monitoring for anomalous host activities with ML detections.
How does Osquery Manager work?
Osquery is an open source tool that lets you query Operating Systems like a database using SQL. When you add the Osquery Manager integration to an Elastic Agent policy, Osquery is deployed to all agents assigned to that policy. Once that’s added, from Kibana, you can run live queries and schedule recurring queries for those agents to gather data from hundreds of tables across your entire enterprise. These capabilities help with real time incident response, threat hunting, and regular monitoring to detect vulnerability or compliance issues.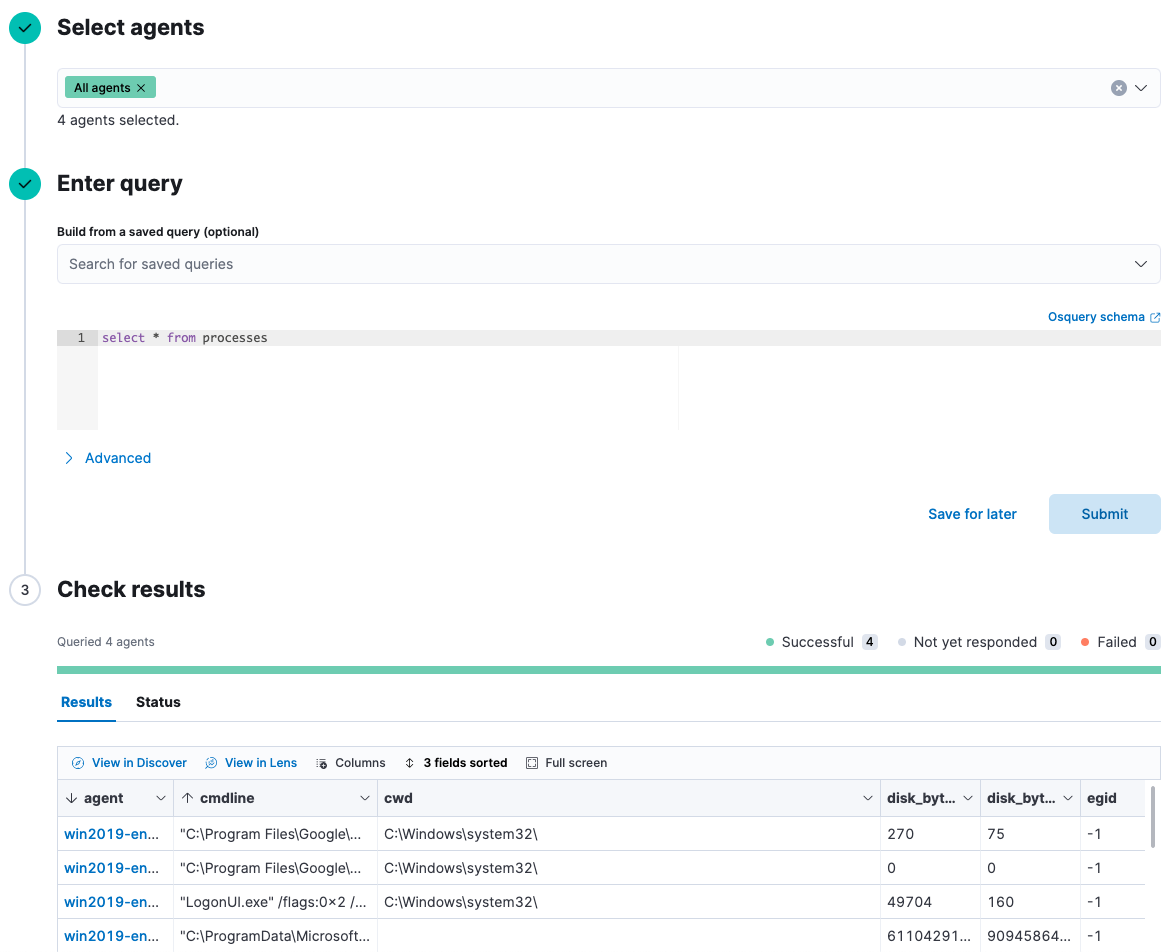
When you run live or scheduled queries, the results are automatically stored in an Elasticsearch index and can easily be mapped to the Elastic Common Schema, normalizing your data to a common set of fields to work with the SIEM app and enabling you to easily search, analyze, and visualize data across multiple sources.
Build security alerts for Osquery data
Osquery surfaces a broad swath of data about operating systems. When combined with the Elastic Security solution, security teams are able craft queries that help them to detect threats within their environment, monitor for issues that matter the most to their organization, and then take action when there’s a problem.
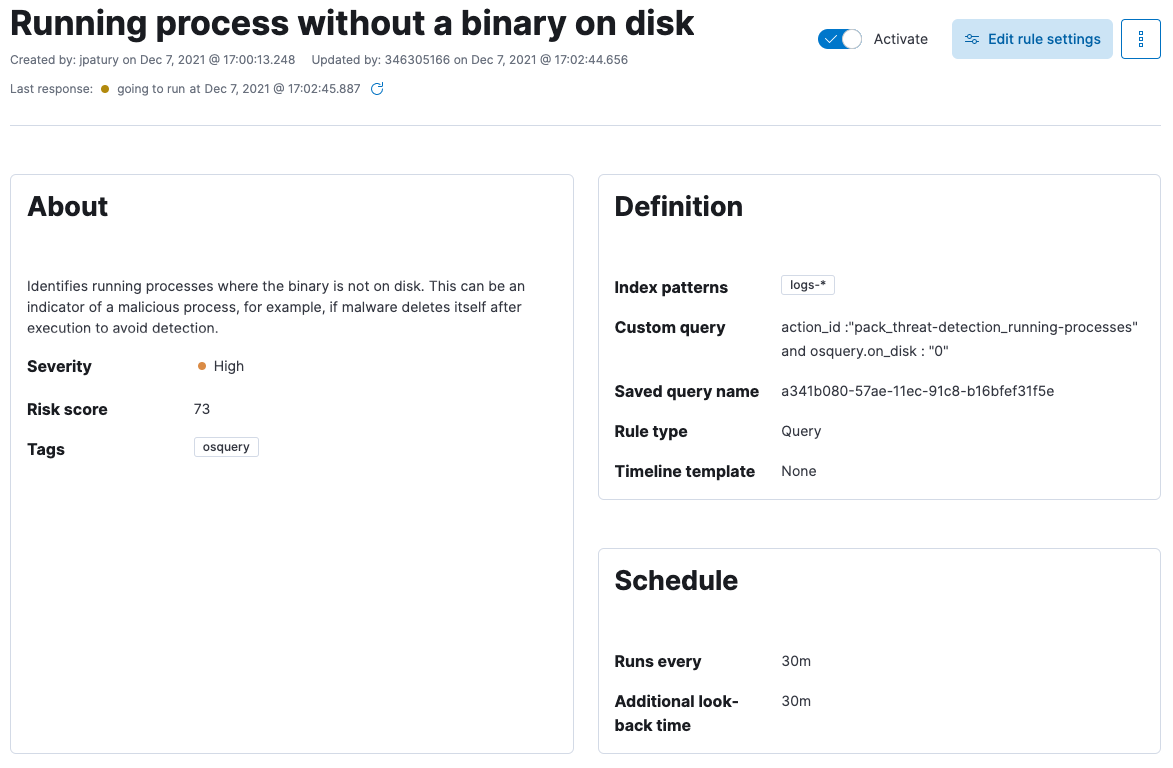
As an example, one issue to monitor is whether any of your systems have processes running where the executable is no longer on disk. This can be an indicator of a malicious process, for example, when malware deletes itself after execution to avoid detection.
You can monitor this using Osquery across Windows, Linux, and Mac systems with a simple query:
SELECT * FROM processes;
The response from the processes table includes several useful fields, like the name, pid, and path of all running processes on the target systems, as well as whether the process path exists on_disk. If on_disk = 0 for a process, that means the file is no longer on the disk and there may be an issue. This is a perfect use case for 1) scheduling a query to monitor for this across your fleet, and 2) creating an alert to notify you when a process is found that doesn’t have a binary on disk.
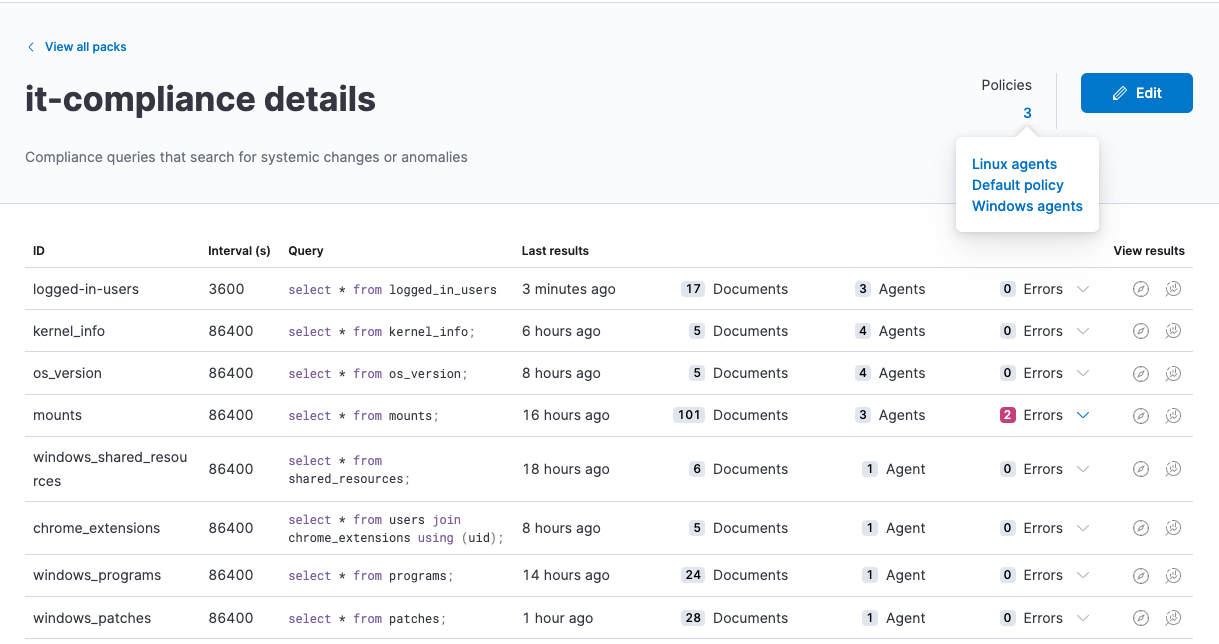
SELECT name, path, pid FROM processes WHERE on_disk = 0), it can be beneficial to schedule a broader query that retrieves all fields for the processes table, because you can use that data to drive several cases you may want to monitor.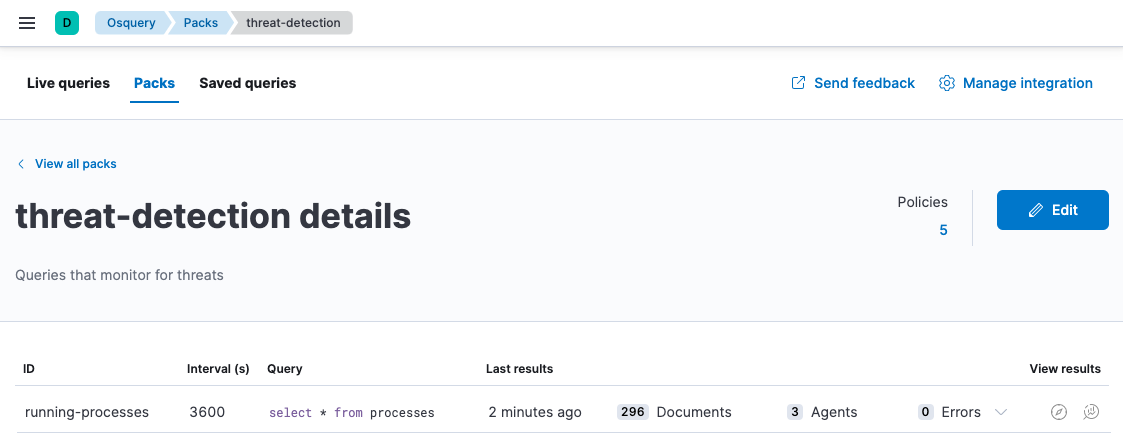
Once this query is running regularly, you can then write a detection rule to alert you when query results include a process that’s missing a binary on disk. This example rule will alert if it finds any results for the running-processes query in the threat-detection pack where the on_disk field is 0.
Query isolated hosts
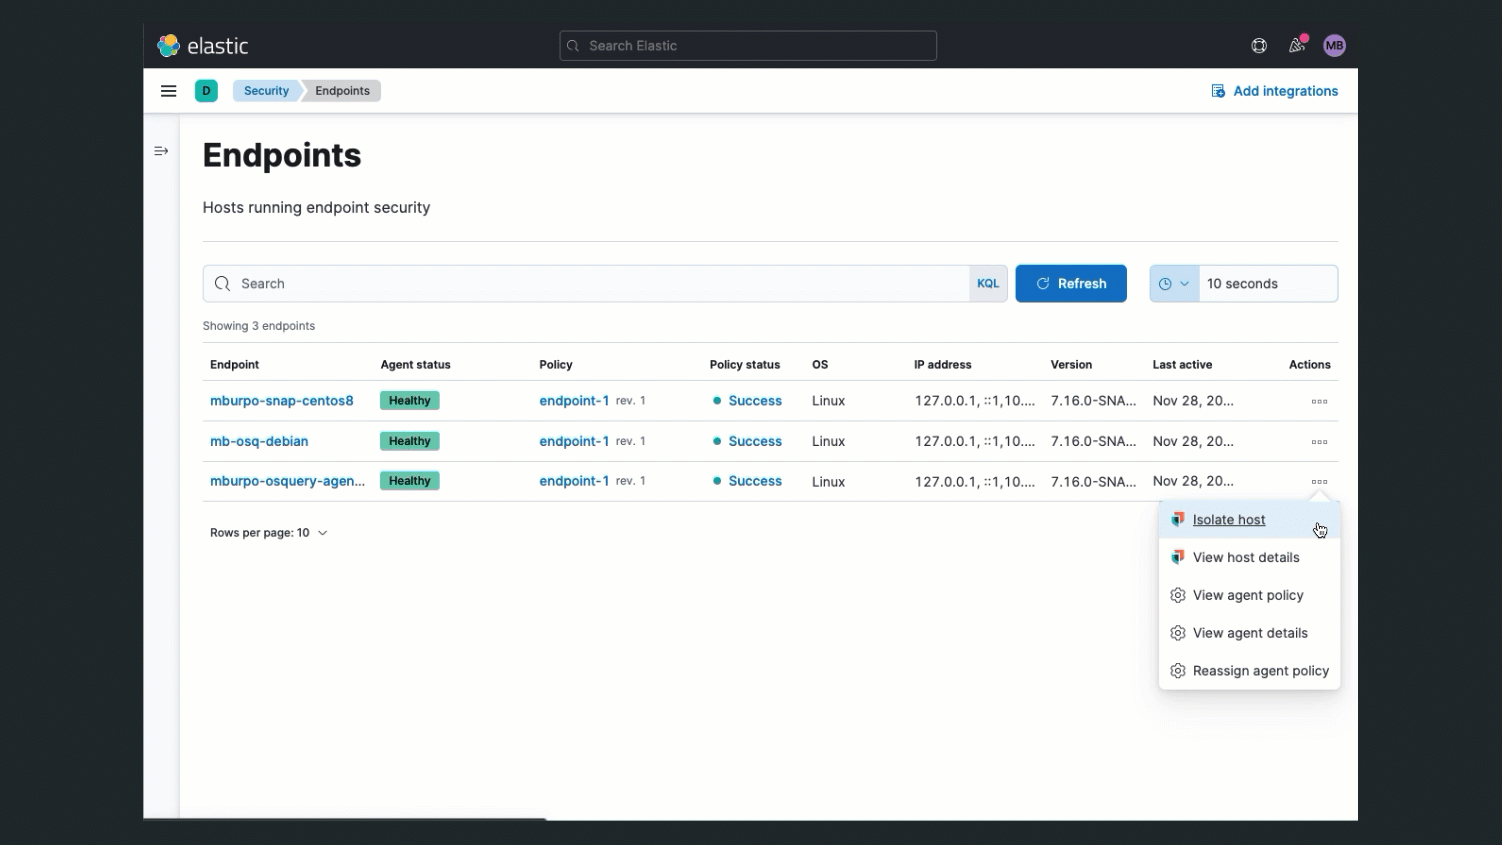
Combining Osquery with the Endpoint Security integration can take your security operations to the next level. With Endpoint Security enabled, when you are handling a security incident and suspect that a system has been compromised, you can isolate the host from your network to block communication and prevent lateral movement to other hosts. Isolating a host in this situation can give you time to investigate the issue and recover to a safe state.
While a host is isolated, it can still communicate with the Elastic Stack, and you can use Osquery to run live queries against the host to help with your investigation. For example, you can use it to help assess the impact and severity of the compromise or to confirm the issue has been resolved before releasing the host.
Monitor for anomalous host activities
With scheduled query packs, you can run a set of queries regularly to establish a baseline of behavior and activity on your hosts. The data you collect over time helps you to build an understanding of what normal operating conditions are like in your environment. For example, you can write queries to monitor for the applications users have installed, who logs into which systems, which programs run on startup, and many others.
With Elastic Machine Learning, you can create anomaly detection jobs for specific Osquery data that you’re collecting so that you can identify anomalous patterns in that data.
Let’s walk through an example that shows how to monitor for anomalous programs installed on Windows systems.
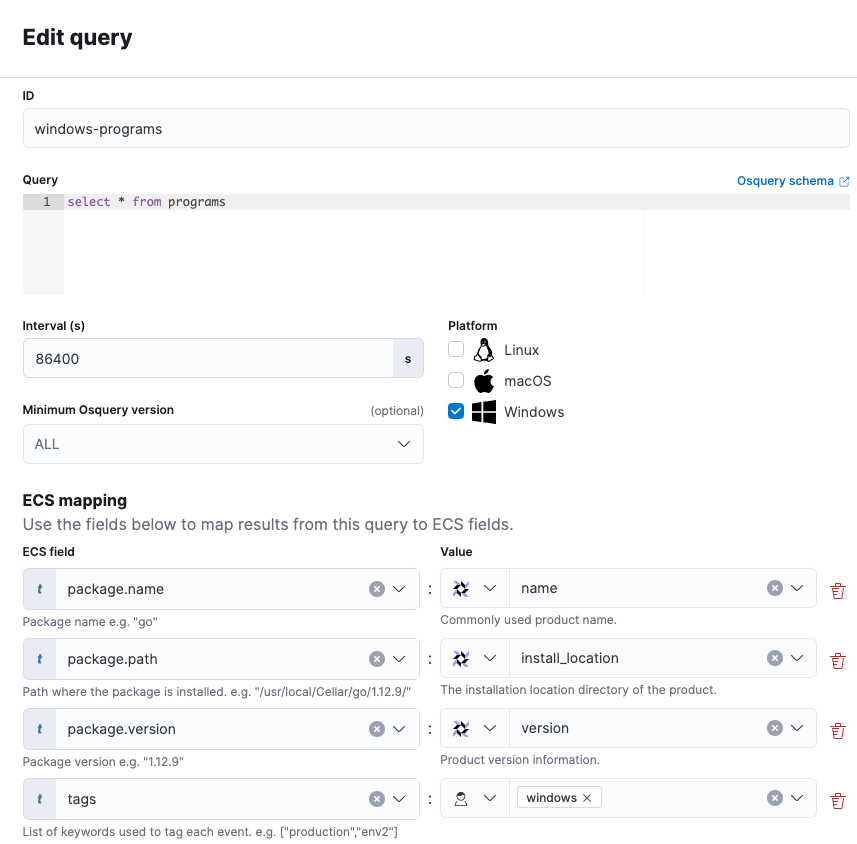
First, to establish a baseline, schedule a query to begin collecting all programs installed on your Windows systems. This query is set to run once a day and also maps a few Osquery values to ECS to standardize the data:
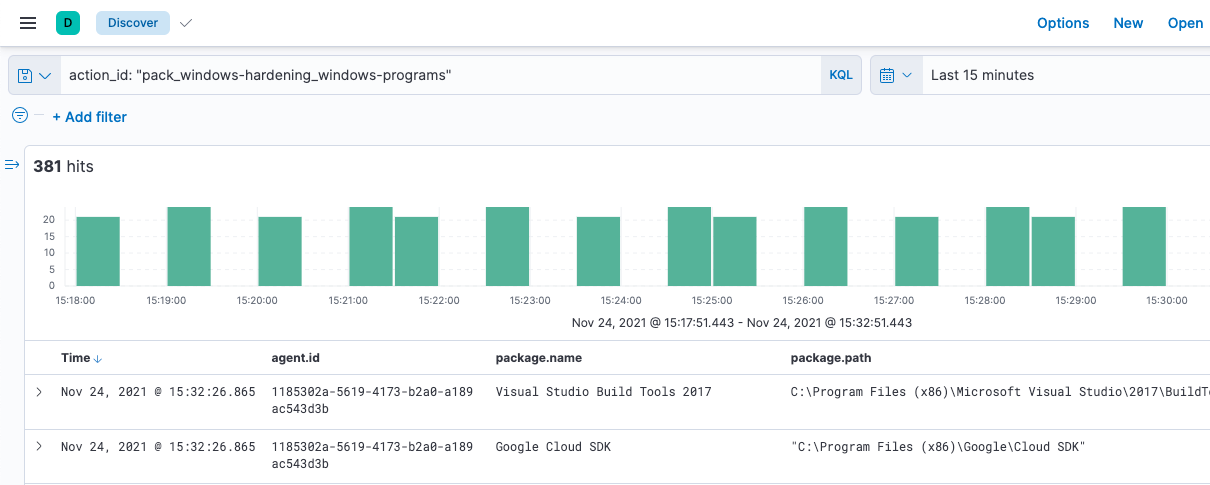
Next, create a saved search that you’ll use later to create your anomaly detection job. The search is based on the action_id of the scheduled query, which includes the pack name (windows-hardening) and the query name (windows-programs).
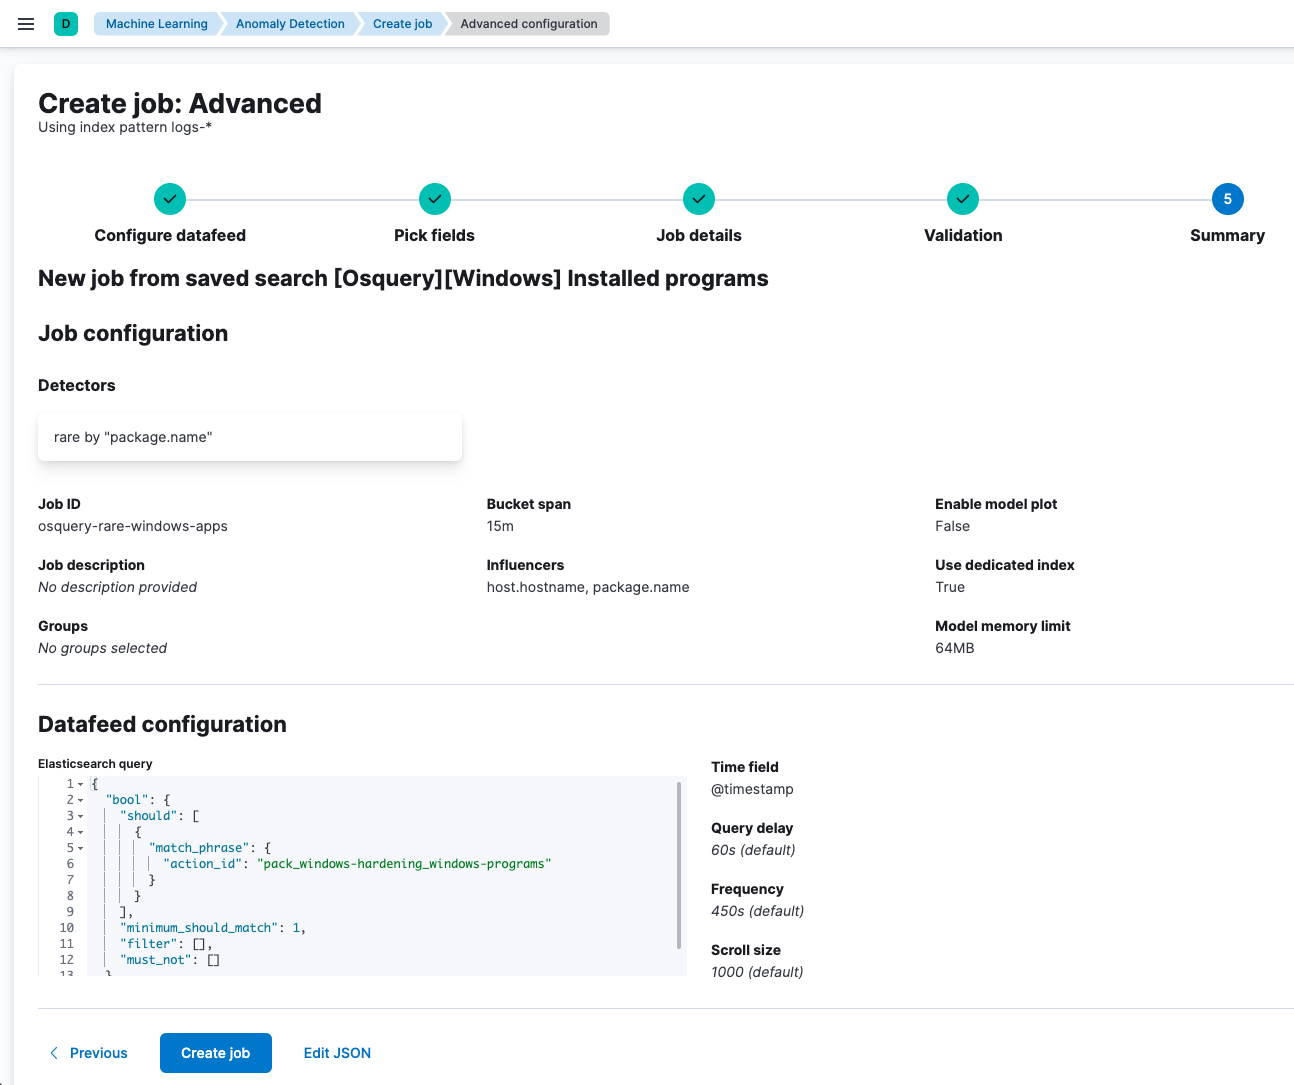
Using the saved search, you can now create a Machine Learning job that detects application anomalies in these search results. This job has a detector that looks for rare application names (package.name) in the Osquery results, and it is set to run continuously.
Running this job helps to identify potential issues across your environment — for example, to find uncommon or unexpected applications that are installed on Windows workstations.
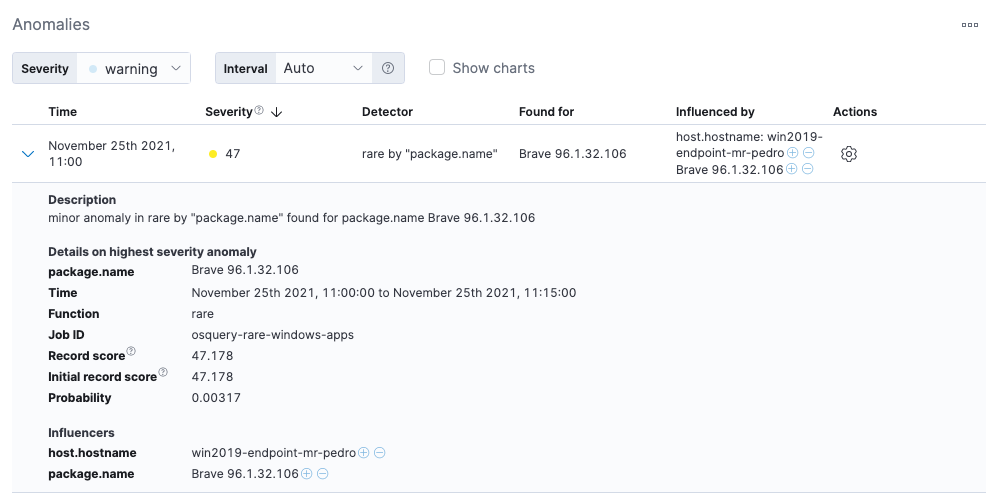
While outliers may be benign, they can also be an indicator of unwanted activity in your environment. Once you start capturing anomalies, you can write detection rules to alert on instances that merit investigation.
Give Osquery Manager a try
The Osquery Manager integration gives you greater insight into the endpoints you’re monitoring with the Elastic Security solution and helps security teams to better detect, investigate, and hunt for vulnerabilities and anomalous activities.
If you want to give all this a try and see how easy it is to deploy Osquery Manager and start running queries, you can start a free 14-day trial of Elastic. Please share any feedback on the Elastic Discuss forum or the Elastic Stack Community on Slack.Share
- Share on Twitter
Share on Twitter
- Share on LinkedIn
Share on LinkedIn
- Share on Facebook
Share on Facebook
- Share by Email
Share by Email
- Print this page
Print