Elasticsearch is packed with new features to help you build the best search solutions for your use case. Learn how to put them into action in our hands-on webinar on building a modern Search AI experience. You can also start a free cloud trial or try Elastic on your local machine now.
Know which searches drive revenue and which ones lose customers, no separate analytics pipeline required. Add search behavior as attributes to your existing application requests using OpenTelemetry (OTel), and query click-through rate, zero-result queries, and conversion funnels in Elastic and unlock modern Application Performance Monitoring at the same time. If you already run Elastic, you have everything you need. This post shows you how.
What you'll discover
In this post, you'll learn:
- The value of a comprehensive search analytics stack.
- The case for using a modern observability standard for search analytics.
- The benefits of combining search analytics and observability.
- Practical first steps for getting started.
The search analytics challenge
Your product manager wants to know which searches are driving purchases and which ones are losing customers. To answer, you have to grep through 5GB of Nginx logs, join it with a CSV of purchase data, and pray that the timestamps align. There has to be a better way.
The questions seem simple:
- Which searches lead to revenue, and which ones lose customers?
- Are users finding what they're looking for?
- Which queries are failing?
- How do you connect search behavior to business outcomes?
Getting answers is harder. Traditional approaches involve stitching together custom event pipelines, third-party analytics tools, and hand-rolled dashboards. You end up with data silos: search logs here, click events there, and business metrics somewhere else entirely.
What if there was a simpler way?
Enter OpenTelemetry (and why it fits search)
If you come from a search engineering background, you may not have crossed paths with application performance monitoring (APM), which is the practice of instrumenting your code to understand how it behaves in production. The key idea behind modern APM is the trace, a structured record that follows a single request as it flows through your system, from the initial API call through every database query and service hop. Unlike logs, which are isolated lines of text, traces connect the dots across your entire stack.
OpenTelemetry (OTel) has become the industry standard for producing these traces. Born from the merger of OpenTracing and OpenCensus, it provides a vendor-neutral way to collect traces, metrics, and logs. The core idea is simple: Instrument your code once, and send data anywhere.
Elastic has invested heavily in this standard as a contributor. Elastic actively aligns its Elastic Common Schema (ECS) with OTel Semantic Conventions so that field names are consistent across both, and it donated the Universal Profiling Agent to the OTel project to make profiling a core OTel signal.
Because of this alignment, Elastic natively understands OTel data. OTel transmits data using the OpenTelemetry Protocol (OTLP). On Elastic Cloud, the managed OTLP endpoint (mOTLP) accepts OTLP spans directly from your SDK, without requiring an intermediate collector. For self-managed deployments, the Elastic Distribution of OpenTelemetry (EDOT) Collector provides the same path. This lets you use standard OTel traces for search analytics, without any additional infrastructure.
How traces become analytics
A trace is a collection of spans, where each span represents one operation (an API call, a database query, or a search request). Each span can carry arbitrary attributes (key-value pairs that describe what happened).
This is where it gets interesting for search. Search behavior can ride on the same spans OTel already generates for APM, with no new attributes required beyond what you add to existing calls.
search.query: What the user searched for.search.result_count: How many results came back.search.result_click_position: Which result they clicked.
By extending OTel with attributes like these, we can capture rich behavioral data using the same infrastructure that powers application monitoring. You don’t need a new pipeline or a new vendor; you’re simply adding new attributes to existing spans.
A unified approach: OTel + Elastic + ES|QL
If you're building search, there's a good chance you're already running Elasticsearch. It powers search for thousands of ecommerce sites, content platforms, and enterprise applications. It’s often chosen for its speed, flexibility, and features like vector search, Learning To Rank (LTR), and query rules. What's less well-known in the search community is that Elastic also has over a decade of investment in observability. Elastic APM, logging, and infrastructure monitoring are used at scale across industries.
Running search and observability on the same platform is what makes this approach work. The same platform that runs your search engine can also analyze how people use it. Elastic natively ingests OTel data via its managed OTLP endpoint, and Elasticsearch Query Language (ES|QL), Elasticsearch's piped query language, makes it easy to explore and aggregate that data in Kibana.
Together, they offer a compelling approach to search analytics:
- Instrument once: Add OTel attributes to your search requests and user interactions.
- Store centrally: Traces flow to Elastic via mOTLP alongside your other application telemetry.
- Query flexibly: Use ES|QL in Kibana to calculate metrics, slice by any dimension, and explore patterns.
You don’t need a separate analytics pipeline or a dedicated click-tracking service. You just need your search application with the proper instrumentation.
What you can measure
With the right instrumentation in place, you can answer the questions that matter:
Search quality metrics
- CTR: What percentage of searches result in a click? Low CTR might indicate poor relevance or unappealing result presentation.
- Mean Reciprocal Rank (MRR): When users click, how far down the results list do they go? An MRR of 1.0 means every click is on position 1. If everybody clicks on the second position result, your MMR would be 0.5. Higher is better.
- Zero Results Rate: What percentage of searches return nothing? These are your content gaps or query parsing failures. Every zero-result search is a missed opportunity.
Query-level analysis
Beyond aggregate metrics, you can drill into specific queries:
- Top queries by volume: What are users actually searching for?
- Queries with low CTR: Where is relevance failing?
- Zero-result queries: What content is missing from your index?
- Click position distribution: Are clicks concentrated at the top, or are they scattered?
Business impact
Search doesn't exist in a vacuum. By tracking the journey from search to conversion, you can connect relevance to revenue:
- Which searches lead to add-to-cart events?
- What's the conversion rate for searches versus browsing?
- Which queries drive the most revenue?
Training data for machine learning
The same click data that measures search quality can also train models to improve it. Click positions and frequencies can be transformed into judgment lists for LTR models, turning user behavior into relevance signals.
Search analytics dashboard example in Kibana
Here's what this looks like in practice. This Kibana dashboard is powered entirely by OTel traces and ES|QL, with no custom pipeline or separate analytics service:
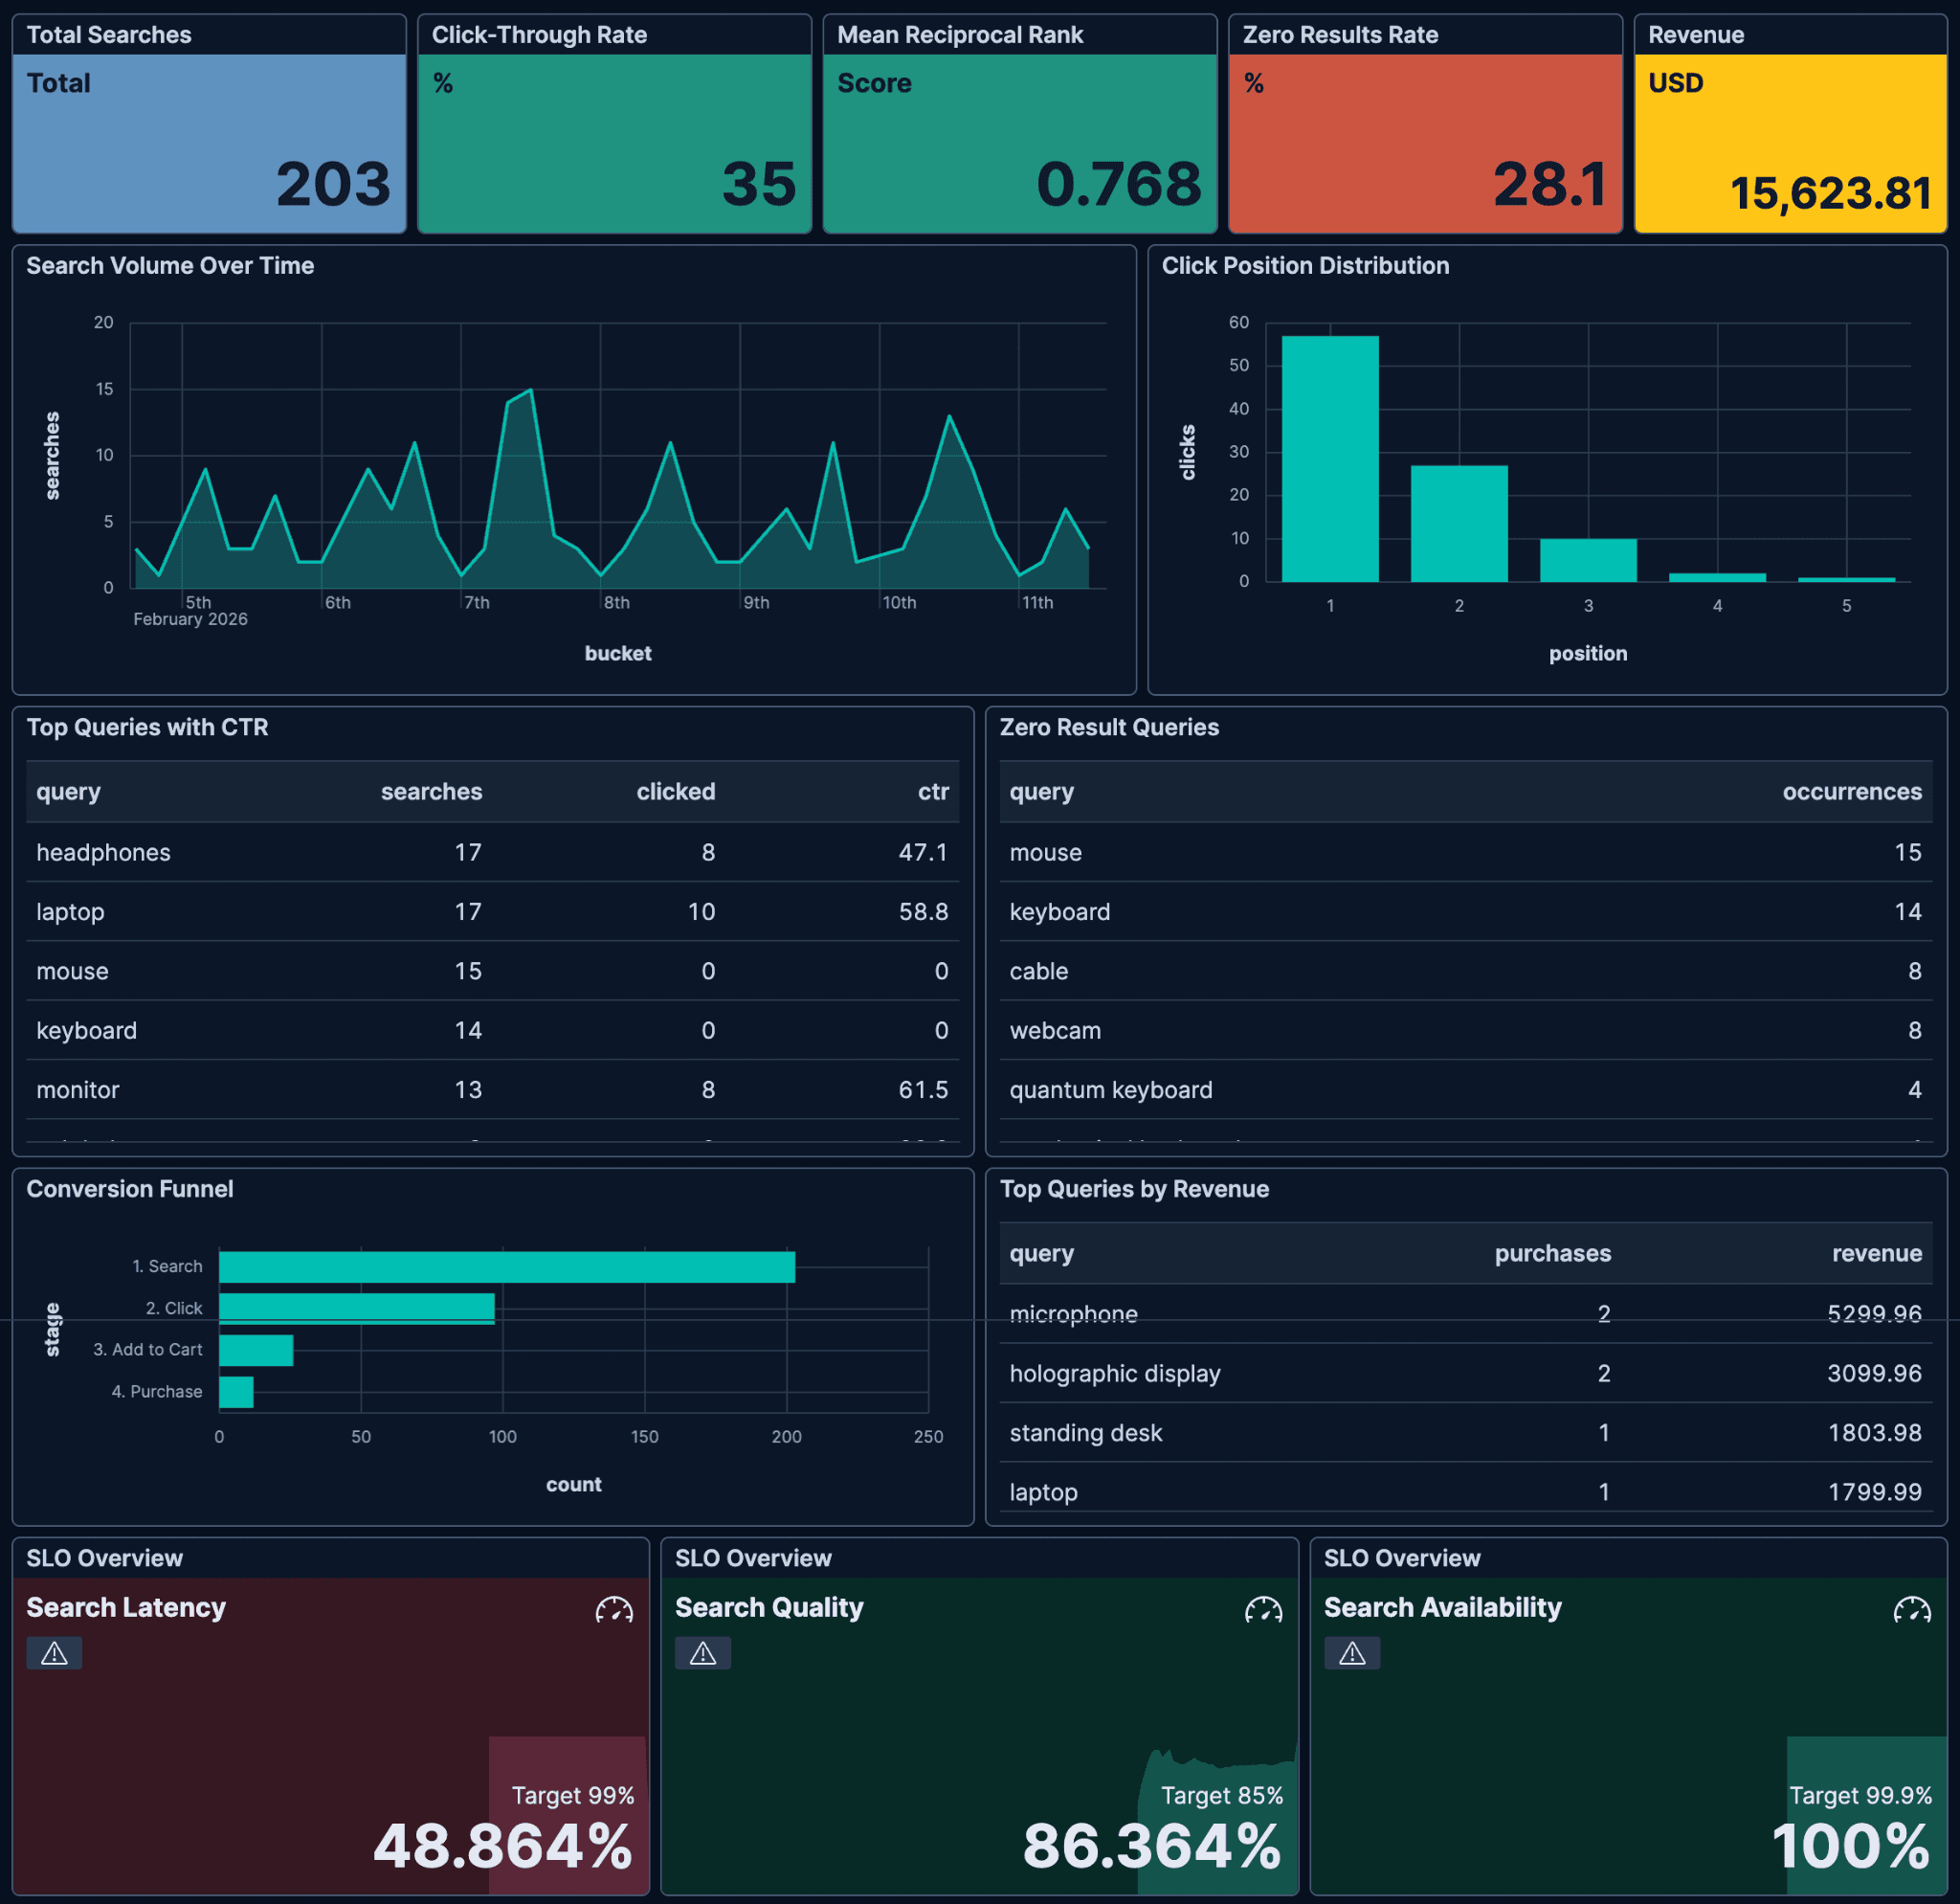
Every panel on this dashboard comes from the same index. The headline metrics use value-based coloring to surface health at a glance: CTR and MRR are green (healthy), while the Zero Results Rate is red (needs attention). Below, you can see which queries drive the most clicks, which ones return nothing, and how searches convert through the funnel to revenue.
Notice the SLO cards at the bottom, with targets like "99% of searches under 250ms" that let you track reliability as a measurable commitment. That's a hint at something bigger.
How does search analytics data flow into Elastic?
The data flow is straightforward:
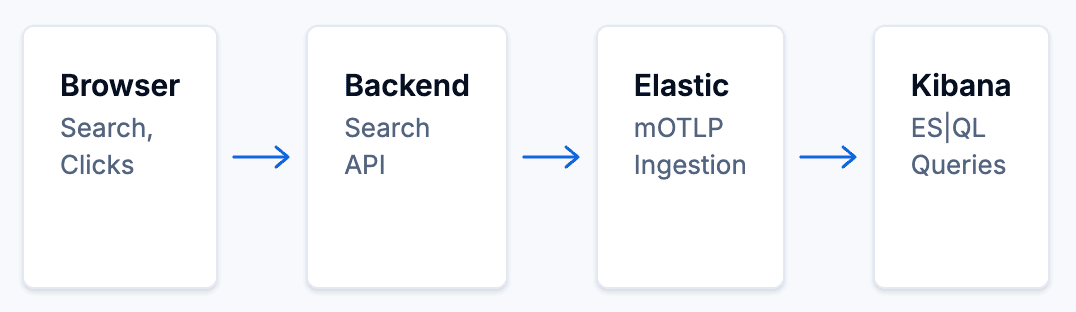
- Browser: User searches and clicks. The front end can send events directly via OTel or relay them through the back end.
- Back end: Your search API, instrumented with OTel. Each search request becomes a span, with attributes like
search.query,search.result_count, andsearch.query_id. - Elastic (mOTLP): Receives and stores the OTel traces via the mOTLP endpoint. Point
OTEL_EXPORTER_OTLP_ENDPOINTat your Elastic deployment withApiKeyauth. This doesn’t require a collector or transformation. - Kibana: Where you explore and visualize your data. Use ES|QL in Discover to run ad hoc queries, use the APM UI to inspect individual traces, build dashboards for ongoing monitoring, and set up alerts when metrics degrade.
How OTel attributes become queryable data
Before we query, you need to understand how Elastic stores these OTel attributes, because it affects how you write your ES|QL.
With OTel-native ingestion, custom attributes are stored directly under attributes.*, and their original dot notation is preserved. There’s no underscore translation and no type splitting, and strings, numbers, and booleans all live in the same namespace.
| OTel attribute | Type | ES|QL field |
|---|---|---|
| `search.query` | string | `attributes.search.query` |
| `search.result_count` | number | `attributes.search.result_count` |
| `search.first_click` | boolean | `attributes.search.first_click` |
This mapping is as simple as it looks: The attribute name in your code is the field name in your query. We'll cover more examples in the next post, when you're writing queries hands-on.
ES|QL: Your search data in five lines
ES|QL is Elasticsearch's piped query language. You start with a data source, and then, one step at a time, pipe it through filters, aggregations, and calculations.
Here's a single query that calculates your CTR, the percentage of searches that result in at least one click:
Reading from the top down: Pull all search spans and first-click spans from traces-generic.otel-default, count each type separately with COUNT(CASE(...)), and then divide to get CTR. We label the first click on each search with search.first_click at instrumentation time, so the query just counts it and no deduplication is needed. One query provides one counted result, which gives you the CTR.
That's the pattern. ES|QL reads from the top down, and each pipe step transforms the data. In the next post, we'll run six queries like this, including top queries, zero-results analysis, search performance, and volume over time, all against real data. Stay tuned for it!
From search analytics to full-stack observability
By choosing OTel and Elastic for search analytics, you're investing in infrastructure that serves multiple needs.
The same traces that calculate your CTR also give you operational visibility, without requiring any extra instrumentation:
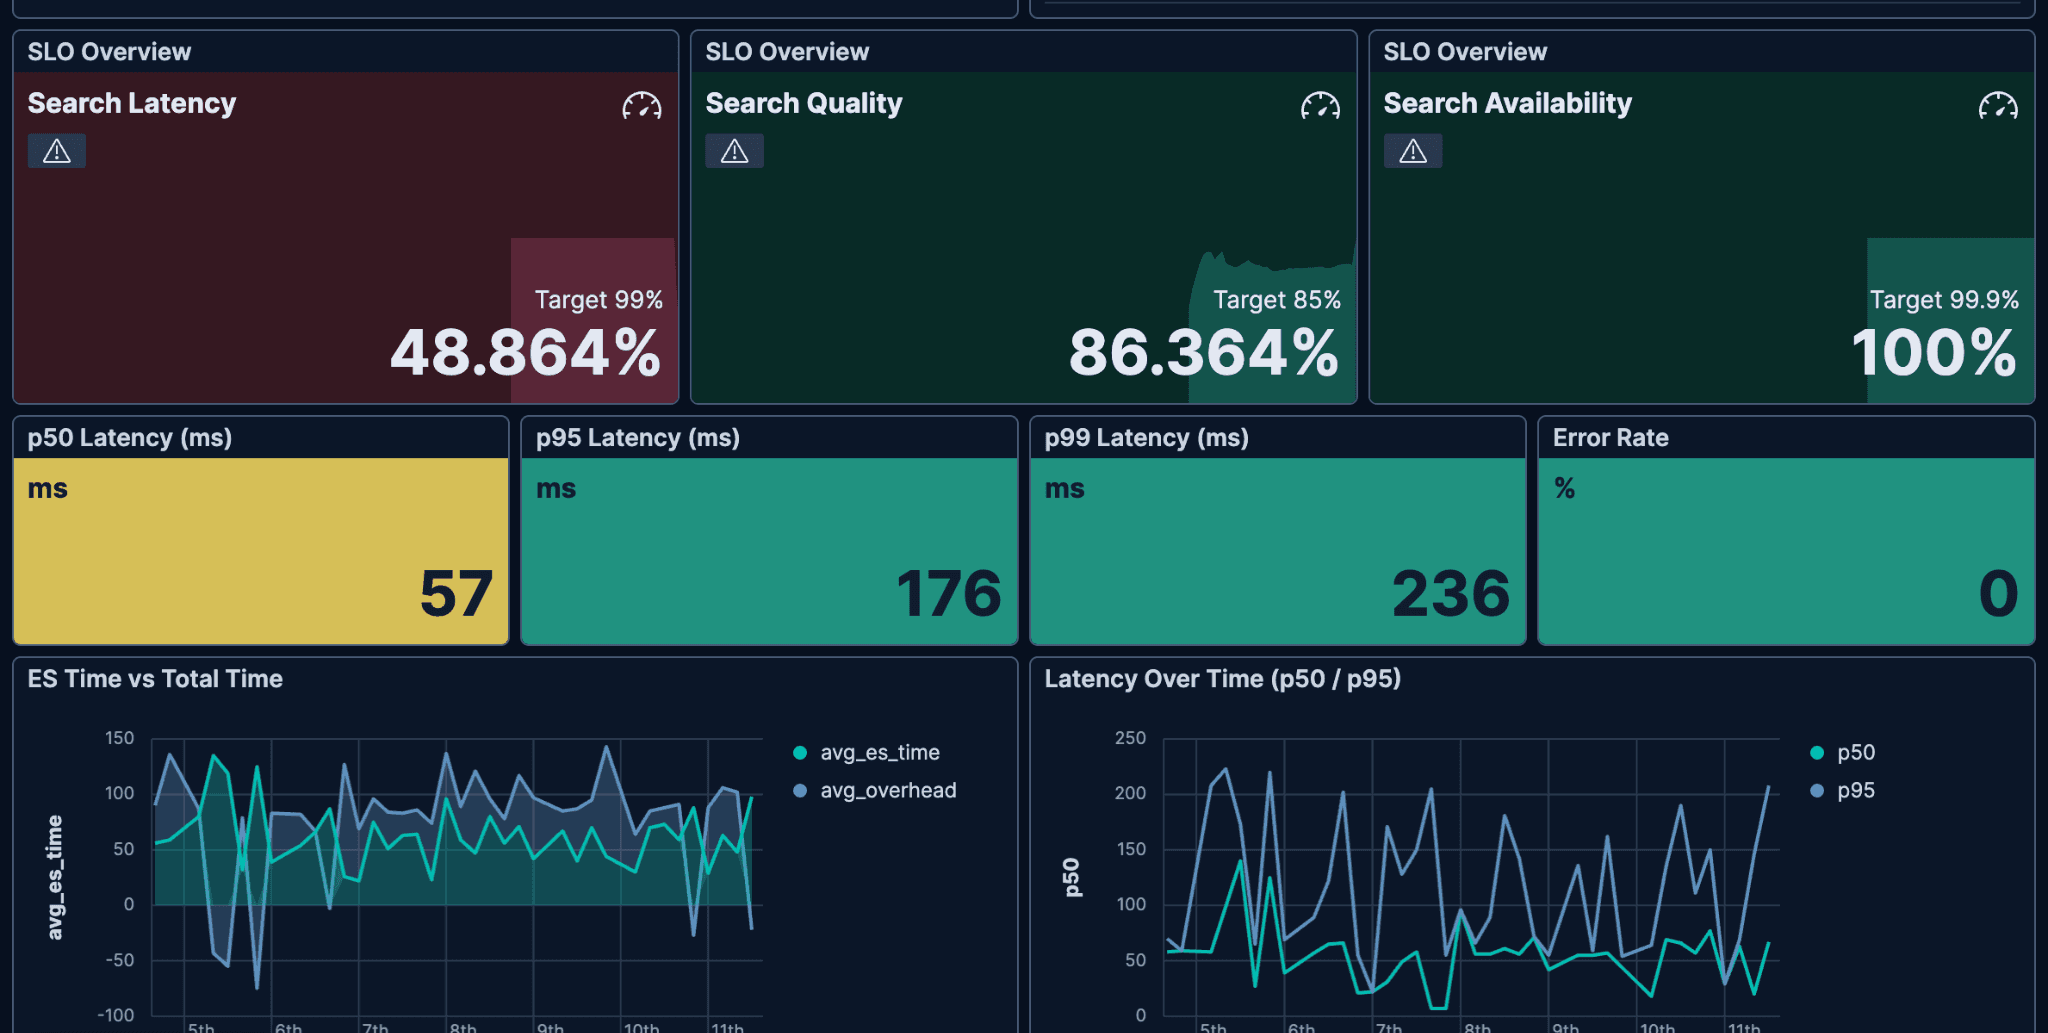
The search dashboard's SLO cards track three targets: your search latency target (99% under 250ms), search quality (85% returning results), and availability (99.9% success rate). Below them, latency percentiles use the same value-based coloring. Green means healthy, yellow means watch it, and red means needs attention.
The operational charts break down where time is spent (Elasticsearch query time versus application overhead) and how latency trends over time. All of this comes from the same search.* attributes you added for analytics, and no extra instrumentation is required.
This is the practical advantage of the OTel approach:
- Search latency: How long are queries taking? Where are the slow ones?
- Error rates: Are searches failing? If so, why?
- Dependencies: How does Elasticsearch performance affect your search API?
- SLOs: Set targets for search latency or Zero Results Rate.
- Alerting: Get notified when metrics degrade.
- Anomaly detection: Let machine learning (ML) spot unusual patterns in search behavior.
Start with search analytics, and you can extend that foundation into full-stack observability. It’s a single instrumentation investment that results in multiple returns.
What OTel attributes do you need for search analytics?
To get started, you'll want to capture a few key attributes on your search spans:
| Attribute | Type | Purpose |
|---|---|---|
| `search.query` | string | The user's search terms |
| `search.result_count` | number | How many results returned (0 = zero-result search) |
| `search.query_id` | string | Unique query identifier (derived from trace ID) |
| `search.result_click_id` | string | Which result was clicked |
| `search.result_click_position` | number | Position of the clicked result (1-indexed) |
For click tracking, add these attributes to click event spans:
| Attribute | Type | Purpose |
|---|---|---|
| `search.result_click_id` | string | Document ID that was clicked |
| `search.result_click_position` | number | Position in results (1-indexed) |
| `search.action` | string | Event type: click, impression, add_to_cart, purchase |
| `search.query_id` | string | Links this interaction back to the originating search |
| `search.first_click` | boolean | `true` on the first click per search (for CTR without deduplication) |
We use the search.* namespace following OTel's convention of domain-specific prefixes (http.*, db.*, messaging.*). While OTel doesn't yet have standardized search conventions, search.* is self-describing and vendor-neutral. Our naming is informed by the User Behavior Insights (UBI) standard, which defines a detailed schema for search events. We reference it for event structure without coupling our instrumentation to it.
If you don't have APM set up yet, you can capture the same search.* attributes as OTel log records instead of spans. The analytics concepts are identical; you just query logs-generic.otel-default instead of traces-generic.otel-default, and the attributes.* field paths are the same. See the OpenTelemetry logs with Elastic documentation for setup details.
What's next in this search analytics series
This post introduced the concept of using OTel instrumentation and ES|QL queries to build search analytics on Elastic. The rest of the series goes from concept to production. Stay tuned for it!
Get started with search analytics on Elastic
Ready to add search analytics to your application?
- Reference project: Clone, configure, and have search analytics flowing in 10 minutes.
- OpenTelemetry and Elastic: How to send OTel data to Elastic via the managed OTLP endpoint.
- ES|QL documentation: Learn the query language.
- Elastic Observability: The broader platform.
This is the first post in a six-part series on search analytics with OpenTelemetry and Elastic. Next up: Instrument your search API: Add search attributes to your back end, and run your first ES|QL queries.
Contenido relacionado

56% faster, up to 50% better retrieval performance: What's inside Jina's new 600 million parameter listwise reranker
Jina Reranker 3.5 beats v3 by 50%+ on case law, closes the gap with models 7x its size on legal, medical, and financial benchmarks, and beats them outright on structured data. It's a drop-in replacement for v3, with no API changes.
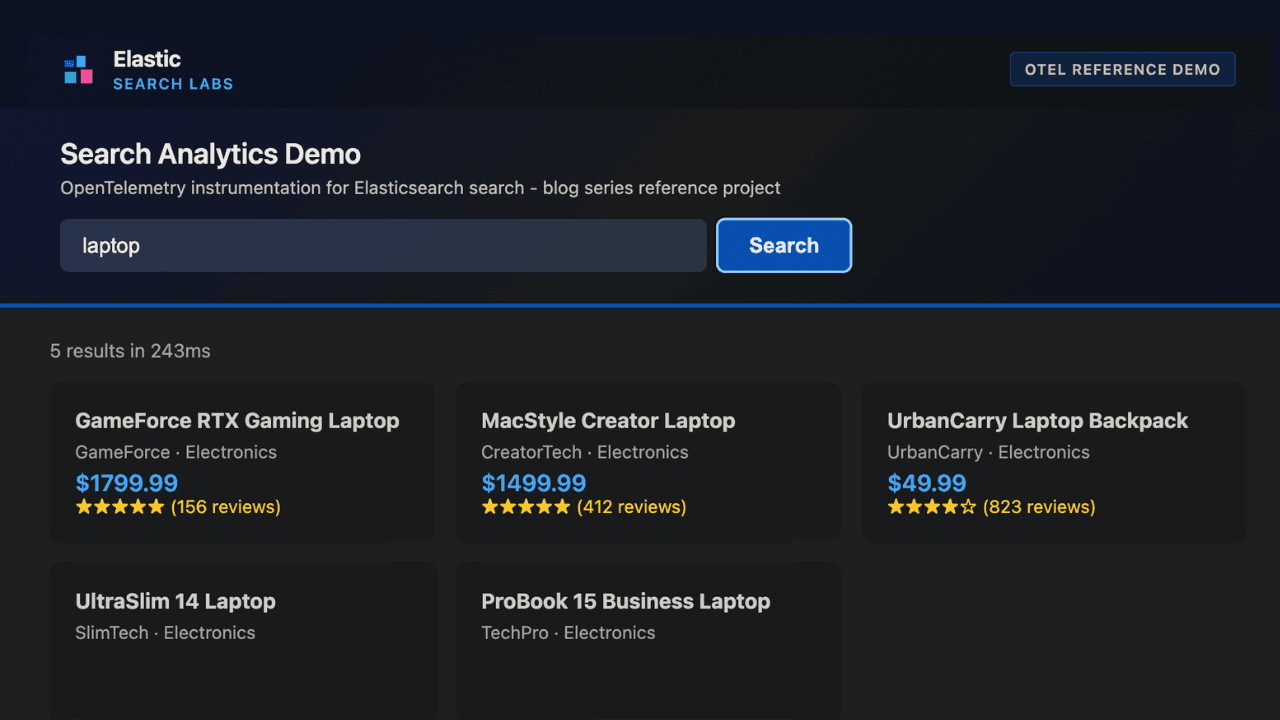
How to instrument your search API with OpenTelemetry and query it with ES|QL
Add custom attributes to OpenTelemetry spans and run six ES|QL queries that reveal your top searches, zero-result rate and slowest queries.
20 de julio de 2026
AI shopping agents: Why context comes before the query
AI shopping agents that guess at your vocabulary make expensive mistakes. Pre-computed catalog context stops the guessing before the first tool call.
16 de julio de 2026
A picture is worth 1.5x the words: What we learned benchmarking product search embeddings
We benchmarked two embedding models on 5,000 real products and found that combining image and text beats either alone by up to 50%. Here's the data and the model that won.

9 de julio de 2026
Why Elasticsearch is becoming a columnar database
Elasticsearch is becoming a first-class columnar database. Columnar Mode ships in 9.5, storing data once alongside the existing modes and cutting storage footprints while speeding up analytical queries.