SLO Articles

Kubernetes observability: SLO templates that turn alerts into error budgets
Two bad rollouts burned 88% of a 30-day error budget while the SLI still read 99.56%. This post adds four SLO templates that bring burn-rate tracking to the OTel-based alert rules from Part 1, no new instrumentation required.
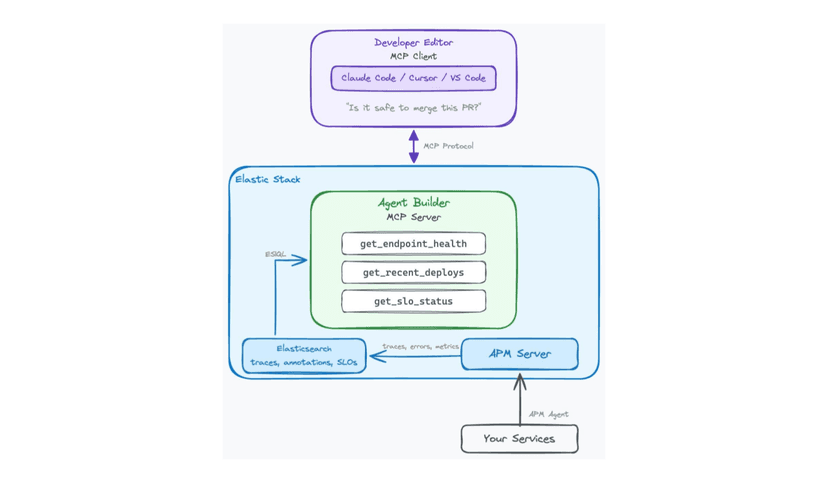
Contextual AI: Stop pinging the SRE: three MCP tools that turn Elastic Agent Builder into your team's runbook
Build three MCP tools in Elastic Agent Builder that read endpoint health, recent deploys and SLO burn rate directly in your editor. Encode your platform team's runbook once; every developer gets self-serve production context without pinging an SRE.

Build better Service Level Objectives (SLOs) from logs and metrics
To help manage operations and business metrics, Elastic Observability's SLO (Service Level Objectives) feature was introduced in 8.12. This blog reviews this feature and how you can use it with Elastic's AI Assistant to meet SLOs.

How to enable Kubernetes alerting with Elastic Observability
In the Kubernetes world, different personas demand different kinds of insights. In this post, we’ll focus on alerting and provide an overview of how alerts in Elastic Observability can help users quickly identify Kubernetes problems.

Monitoring service performance: An overview of SLA calculation for Elastic Observability
Elastic Stack provides many valuable insights for different users, such as reports on service performance and if the service level agreement (SLA) is met. In this post, we’ll provide an overview of calculating an SLA for Elastic Observability.