ES|QL Articles

Skip writing alert rules: 6 ready-made ES|QL templates ship inside the NGINX OTel integration
Elastic integrations come with alerting rule templates, each one an ES|QL query with a threshold already set. Create Elasticsearch alert rules in minutes, tune them to your traffic, and catch silent data streams early.

Common ES|QL queries for Kubernetes monitoring
Copy-paste ES|QL queries for Elasticsearch that turn memory pressure and error spikes into a five-minute diagnosis.
Bringing Fire to Elasticsearch: Adding Native Prometheus API Support
Query Elasticsearch directly from Prometheus-compatible clients via native PromQL, discovery, and metadata endpoints. Send data to Elasticsearch with Prometheus Remote Write.

From averages to any percentile: Elasticsearch ships native exponential histogram support in ES|QL
Query any percentile at any time. Elasticsearch natively stores OTel exponential histograms and lets you analyze distributions in ES|QL without fixed buckets or lossy conversions.
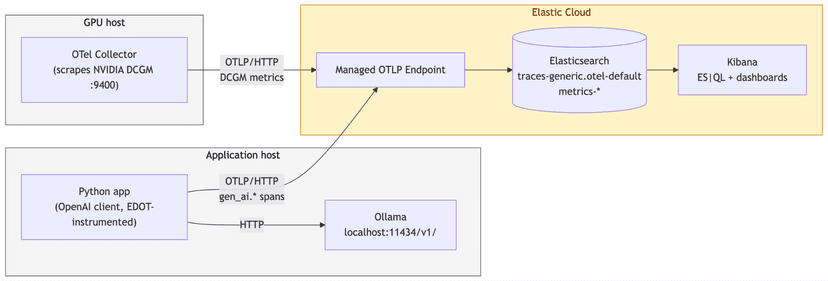
ES|QL queries for debugging LLM latency, cost and GPU saturation
Learn how to investigate LLM latency, token cost and GPU saturation using ES|QL against OpenTelemetry traces and get a root cause, not just a symptom.

30x faster than Prometheus: how we rebuilt Elasticsearch as a leading columnar metrics datastore
Elasticsearch now stores OTel metrics at 3.75 bytes per data point and queries them up to 30x faster than Prometheus. Here's how we rebuilt TSDS and ES|QL.

Piping Hot: Bringing ES|QL to Your Grafana Dashboards Using the Elasticsearch Plugin
You can now write ES|QL queries in Grafana with the Elasticsearch plugin. Learn how to enable it and write pipe-based queries directly in the Grafana UI.

Investigate Kubernetes infrastructure issues with PromQL in Elasticsearch & Kibana
Walkthrough of a Kubernetes fleet-wide CPU investigation in Elastic Observability, from cluster to namespace to the noisy pod, using PromQL in Elasticsearch and Kibana.

Exploring metrics from a new time series data stream in Discover
Discover helps you see and understand the metrics in a time series stream, with no manual work required. Once you see that your metrics data is flowing, you're ready to build dashboards, alerts, SLOs, and more.

Query Prometheus Metrics in Elasticsearch with Native PromQL Support
Elasticsearch now supports PromQL natively as a first-class source command in ES|QL. Run familiar Prometheus queries on your time series data directly in Kibana.

Your PromQL queries now run in Kibana!
With PromQL now natively supported in Kibana, write and execute PromQL for analyzing metrics in Discover, in Dashboards visualizations, in alerting rules and wherever else ES|QL is supported. PromQL is currently available in Tech Preview for common metrics analytics use cases.

Turn Dashboards Into an Investigation Tool with ES|QL Variable Controls
Learn how to use ES|QL variables in Kibana to turn a dashboard into an investigation tool, applying value and structure controls to uncover problems.