How the Elastic InfoSec team uses Elastic Security
At Elastic, we internally use, test, and provide feedback on all of our products. For example, the Information Security team is helping the Product team build a stronger solution for our customers.
The InfoSec team is an extremely valuable resource who acts not only as an extension of Quality Assurance/Testing, but also as a data custodian. In fact, our internal detections team utilizes internal Elastic InfoSec data to help build and test detection rules that ultimately find their way into the Elastic Security product.
Last month, I was afforded the wonderful opportunity of “riding along” with our InfoSec team to better understand how we use Elastic internally. Over the course of three days, spread across three weeks, I saw the underbelly of our internal systems, how they are used, and how the team uses Elastic Security every day.
[At the time of this ride-along, version 7.12 of the Elastic Stack had been released and running in the wild for well over a month. However, the InfoSec team usually runs several minor iterations ahead of general availability.]
Day one: Lay of the land
On day one, I learned about all the tools InfoSec uses to keep Elasticians safe.
These include, but are not limited to, Case Management (Hive), Identity Management (Okta), various Threat Intelligence feeds, Slack, and Elastic Endgame. Internal Elastic data sources that are being pulled into Elasticsearch range from cloud-specific logs (AWS Cloudtrail, Azure Activity/Diagnostic Logs, GCP Stackdriver) to network-specific logs (load balancer, proxy, web server, Github, VPC Flow, authentication, and vulnerability) to more host-specific (Auditbeat/Filebeat, Endpoint Protection and Telemetry).
With all this data stored and available for searching, one key area of functionality the InfoSec team requires that is used every day is cross-cluster search. With this setup, a single cluster serves as the search head, which can query and alert on events across all additional clusters. All out-of-the-box detection rules (currently numbering 525+) are enabled and running against the corresponding data sources. As a best practice, InfoSec focuses on cloud detections first (AWS, Azure, GCP). Based on industry trends, they have a specific emphasis around living-off-the-land (LOLbins) detections as well.
In addition to the standard machine learning jobs, InfoSec leverages 15+ custom jobs that pinpoint rare environmental occurrences. These machine learning job types include:
- Process/Executable (Process by System/Provider/Team)
- Process arguments by Process
- Process by Execution Location
- Login Location (Geo and IP)
Currently, detection alerts are forwarded into a generalized Slack channel and might look like the following:
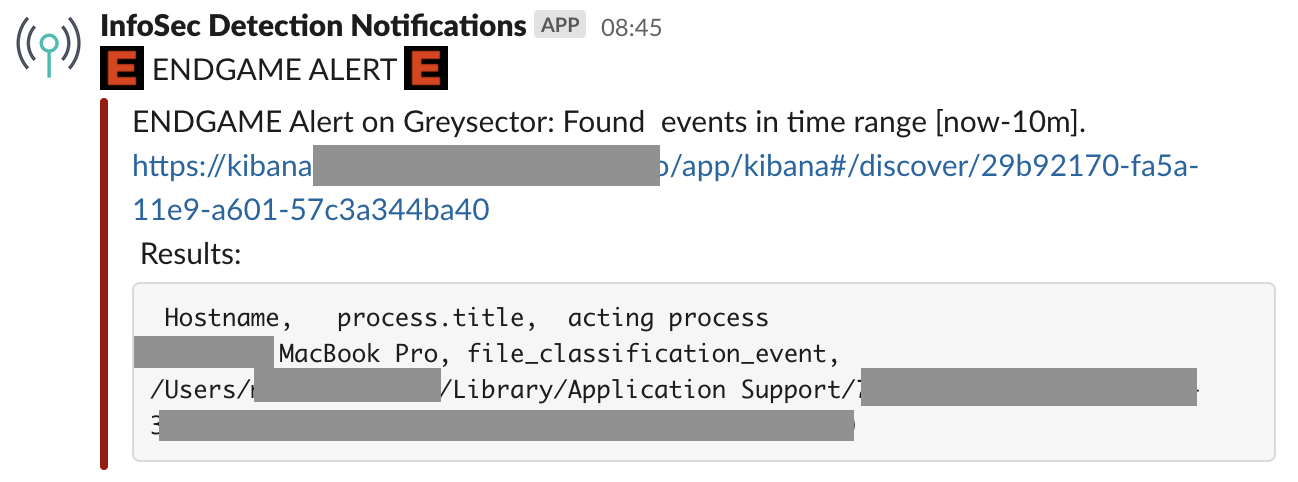
In general, this alert may consist of:
- A high-level description of the event
- Hyperlink to Kibana alert
- 3-4 information fields (offending source, acting process, etc.)
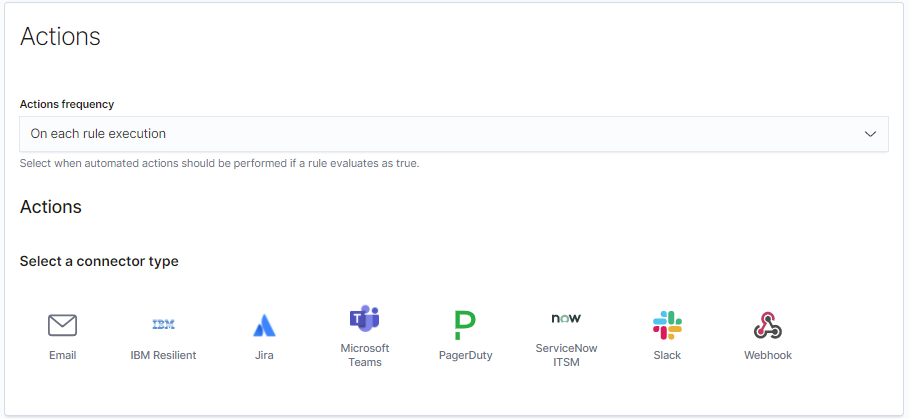
While internally at Elastic we leverage Slack for notifications, there are several alternative detection rule notification paths available for customers:
An analyst will pick up the alert, then pivot into Kibana and the Case Management tool to start their triage process. For this triage work, an analyst often walks through a process of elimination in determining what is the alert/event and what needs to be done with it. Analysts pick indicators of compromise (IoCs) to cross-reference and correlate across data sources such as VirusTotal, URLscan.io, and additional threat intel feeds. The analyst may leverage an IoC match for context and enrichment, and not necessarily strictly for alerting purposes. This helps to provide more value for the analyst to make a quicker decision on further investigative work or escalation toward proper resolution.
Days two and three: Using Elastic to protect Elastic
On days two and three, I learned about our security-specific workflows and decision-tree processes when InfoSec is engaged in responding to an alert.
The Elastic InfoSec team has a weekly standing call with our Product Management team. Considering that we are customer zero of all software build candidates, it is imperative to give proper, quick, and valuable feedback on what works and what can be improved upon. There have been several instances where our own InfoSec team helped design the vision for certain Elastic Security functionality.
One of these suggestions was the ability to include any data from a detection engine alert in the related action so that InfoSec could surface as much alert context as was available to the analysts. Prior to this, it was only possible to include some fields related to the detection rule itself — but not all the fields related to the detection.
The relationship between InfoSec and Product Management is truly symbiotic. The InfoSec team provides extremely valuable insight and feedback for our Product Management team, and the Product Management team affords InfoSec the opportunity to run a minor version ahead of the rest of the company and customers. This “first view” access means both teams get to digest new features and functions, as well as act as another layer of quality assurance.
Analysts often do things that may be unexpected during the development of a product. One example of this was in Timeline when using many “OR” conditions — resulting in not being able to see search results due to the query area taking up the entire screen. This was a frustrating usability issue that could arise when stitching together parent-child relationships. Thankfully it was an easy and quick fix for our developers.
As a part of the triage process, it may be determined that a file needs to be pulled from the offending host. In order to determine “what happened” or “what could have happened,” an analyst may need to evaluate if a file is deemed “safe” or “unsafe.” Internally, we have an Elastic-built malware sandbox that provides an opportunity to safely execute a file while collecting valuable telemetry data around the file. This, in turn, can help provide a quick turnaround to our end users on the safety of a potential attachment or file. Our Elastic Endpoint agent acts as a valuable part of this all-inclusive VM. This agent has been a part of the most recent (third) round of MITRE testing and has shown to perform effectively for both our clients as well as our own internal needs. We posted these results on our blog, and also provided a Kibana Dashboard for the public to navigate the results for their own reference.
Our InfoSec team also coordinates and helps manage the Elastic Bug Bounty Program. Info on disclosure of security issues can be found at elastic.co/community/security/ as well as the Security Announcements forum. The bug bounty program is currently being reworked and expanded to be relaunched approximately within the next month.