Alerting on Machine Learning Jobs in Elasticsearch v5.5
Editor's Note (August 3, 2021): This post uses deprecated features. Please reference the map custom regions with reverse geocoding documentation for current instructions.
Anomaly detection using Machine Learning (ML) in X-Pack is obviously extremely useful, but people often ask how to alert/notify on the anomalies. It should be of no surprise that this is accomplished with another X-Pack feature, Alerting (a.k.a. Watcher). Now, in version 5.5, ML can help you automatically create those watches to alert on detected anomalies!
The interaction between ML and Alerting is extremely flexible given the capabilities of both products. This blog will focus on both the one-click “easy” approach to alerting on an ML job, but will also touch upon the details behind creating more advanced watches. Even so, this blog only scratches the surface of the full breadth of capabilities of both ML and Alerting.
The Easy Way
As you may know, there are currently 3 kinds of jobs that can be created in ML (Single metric, Multi-metric, and Advanced). In v5.5, both the Single and Multi-metric jobs have a "Create watch for real-time job" checkbox that appears after you create the job. This allows for the creation of a new watch on the job results as it continues to run in “real-time” with live indexed data:
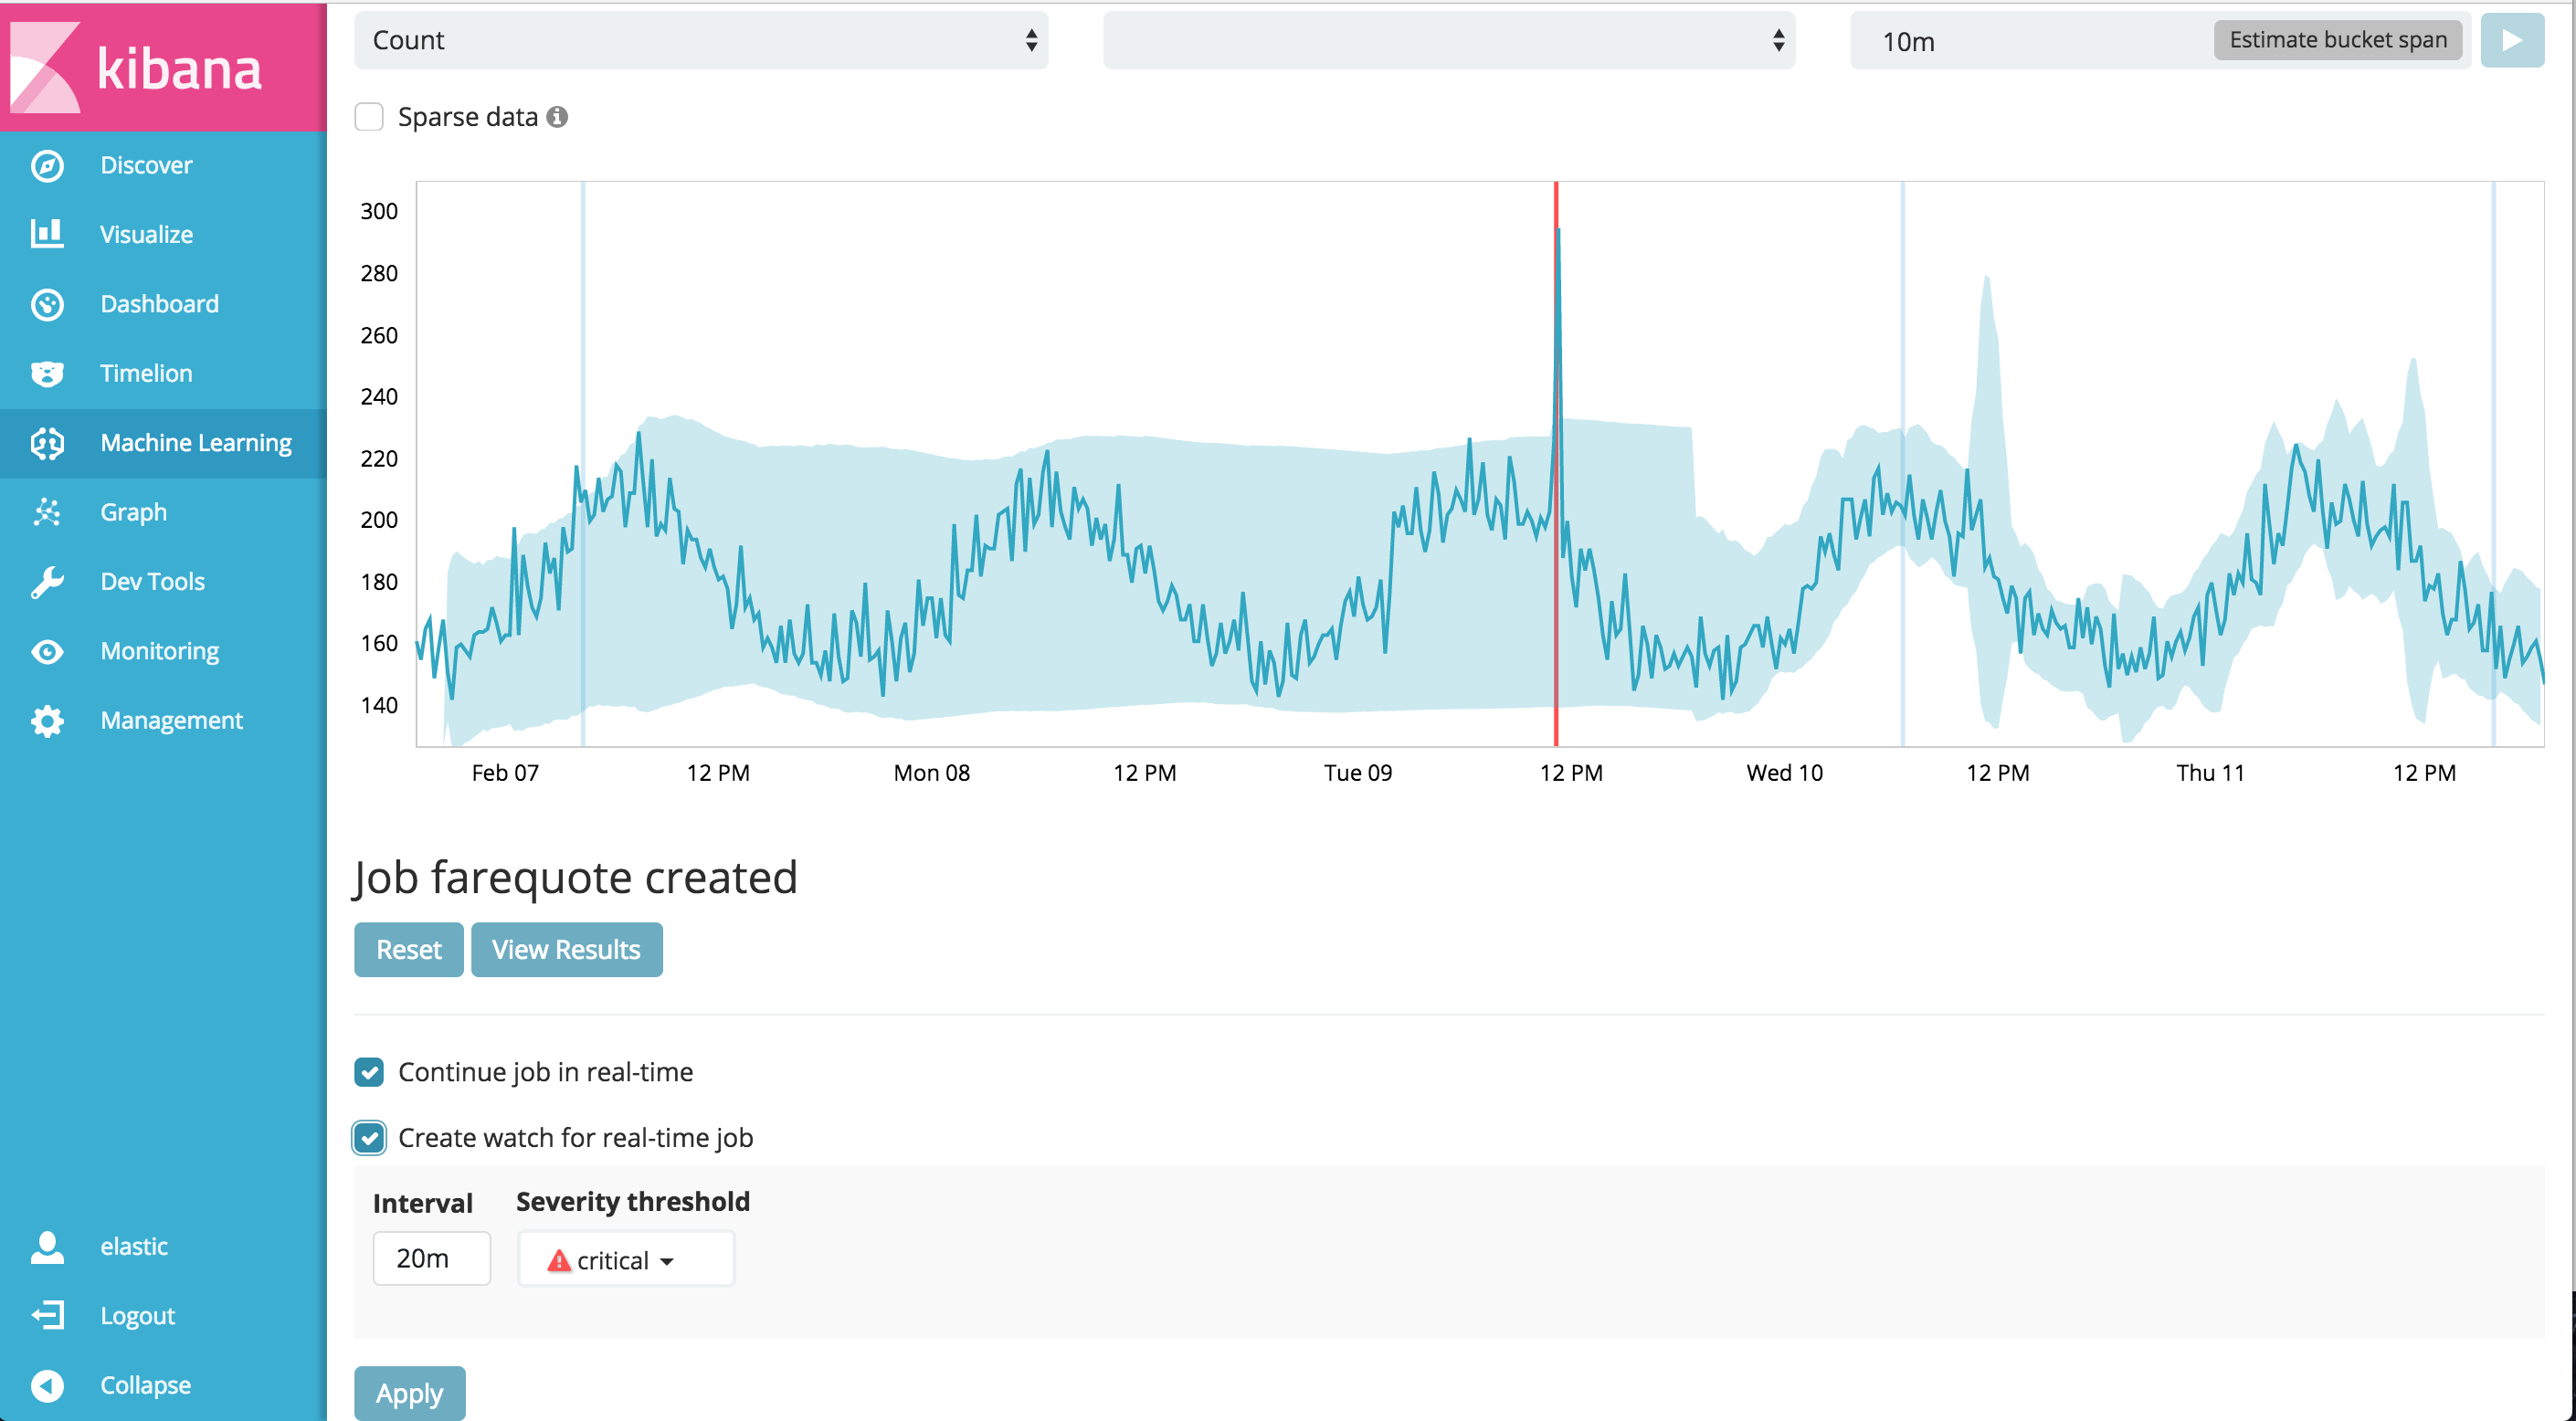
The user has two simple options: the Interval over which the watch scans for recently created anomalies that the job might generate (back from when the watch is fired) and the minimum anomaly Severity threshold that should trigger the alert. Remember that anomalies are scored on a dynamic scale from 0 to 100, so “critical” anomalies are those in the top 25th percentile with a score above 75. By default, the Interval is set equal to twice the defined bucket_span for the job. This allows for any ingest, query, and processing delays (more on this later). In general, one shouldn’t shorten this time interval from the default.
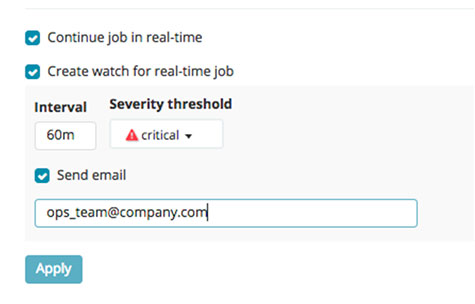
If your X-Pack Alerting setup has email enabled, then there will also be a Send email option:
Clicking on the Apply button registers the watch, and gives you a link to edit the watch for further customization:
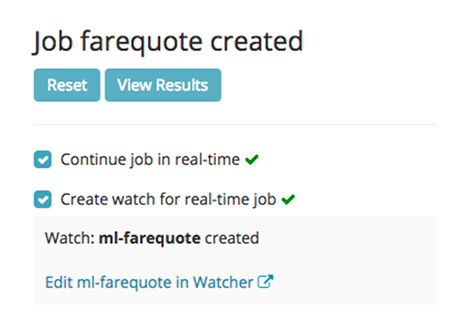
If you want to edit the watch, clicking on the link will direct you to the Watcher UI:
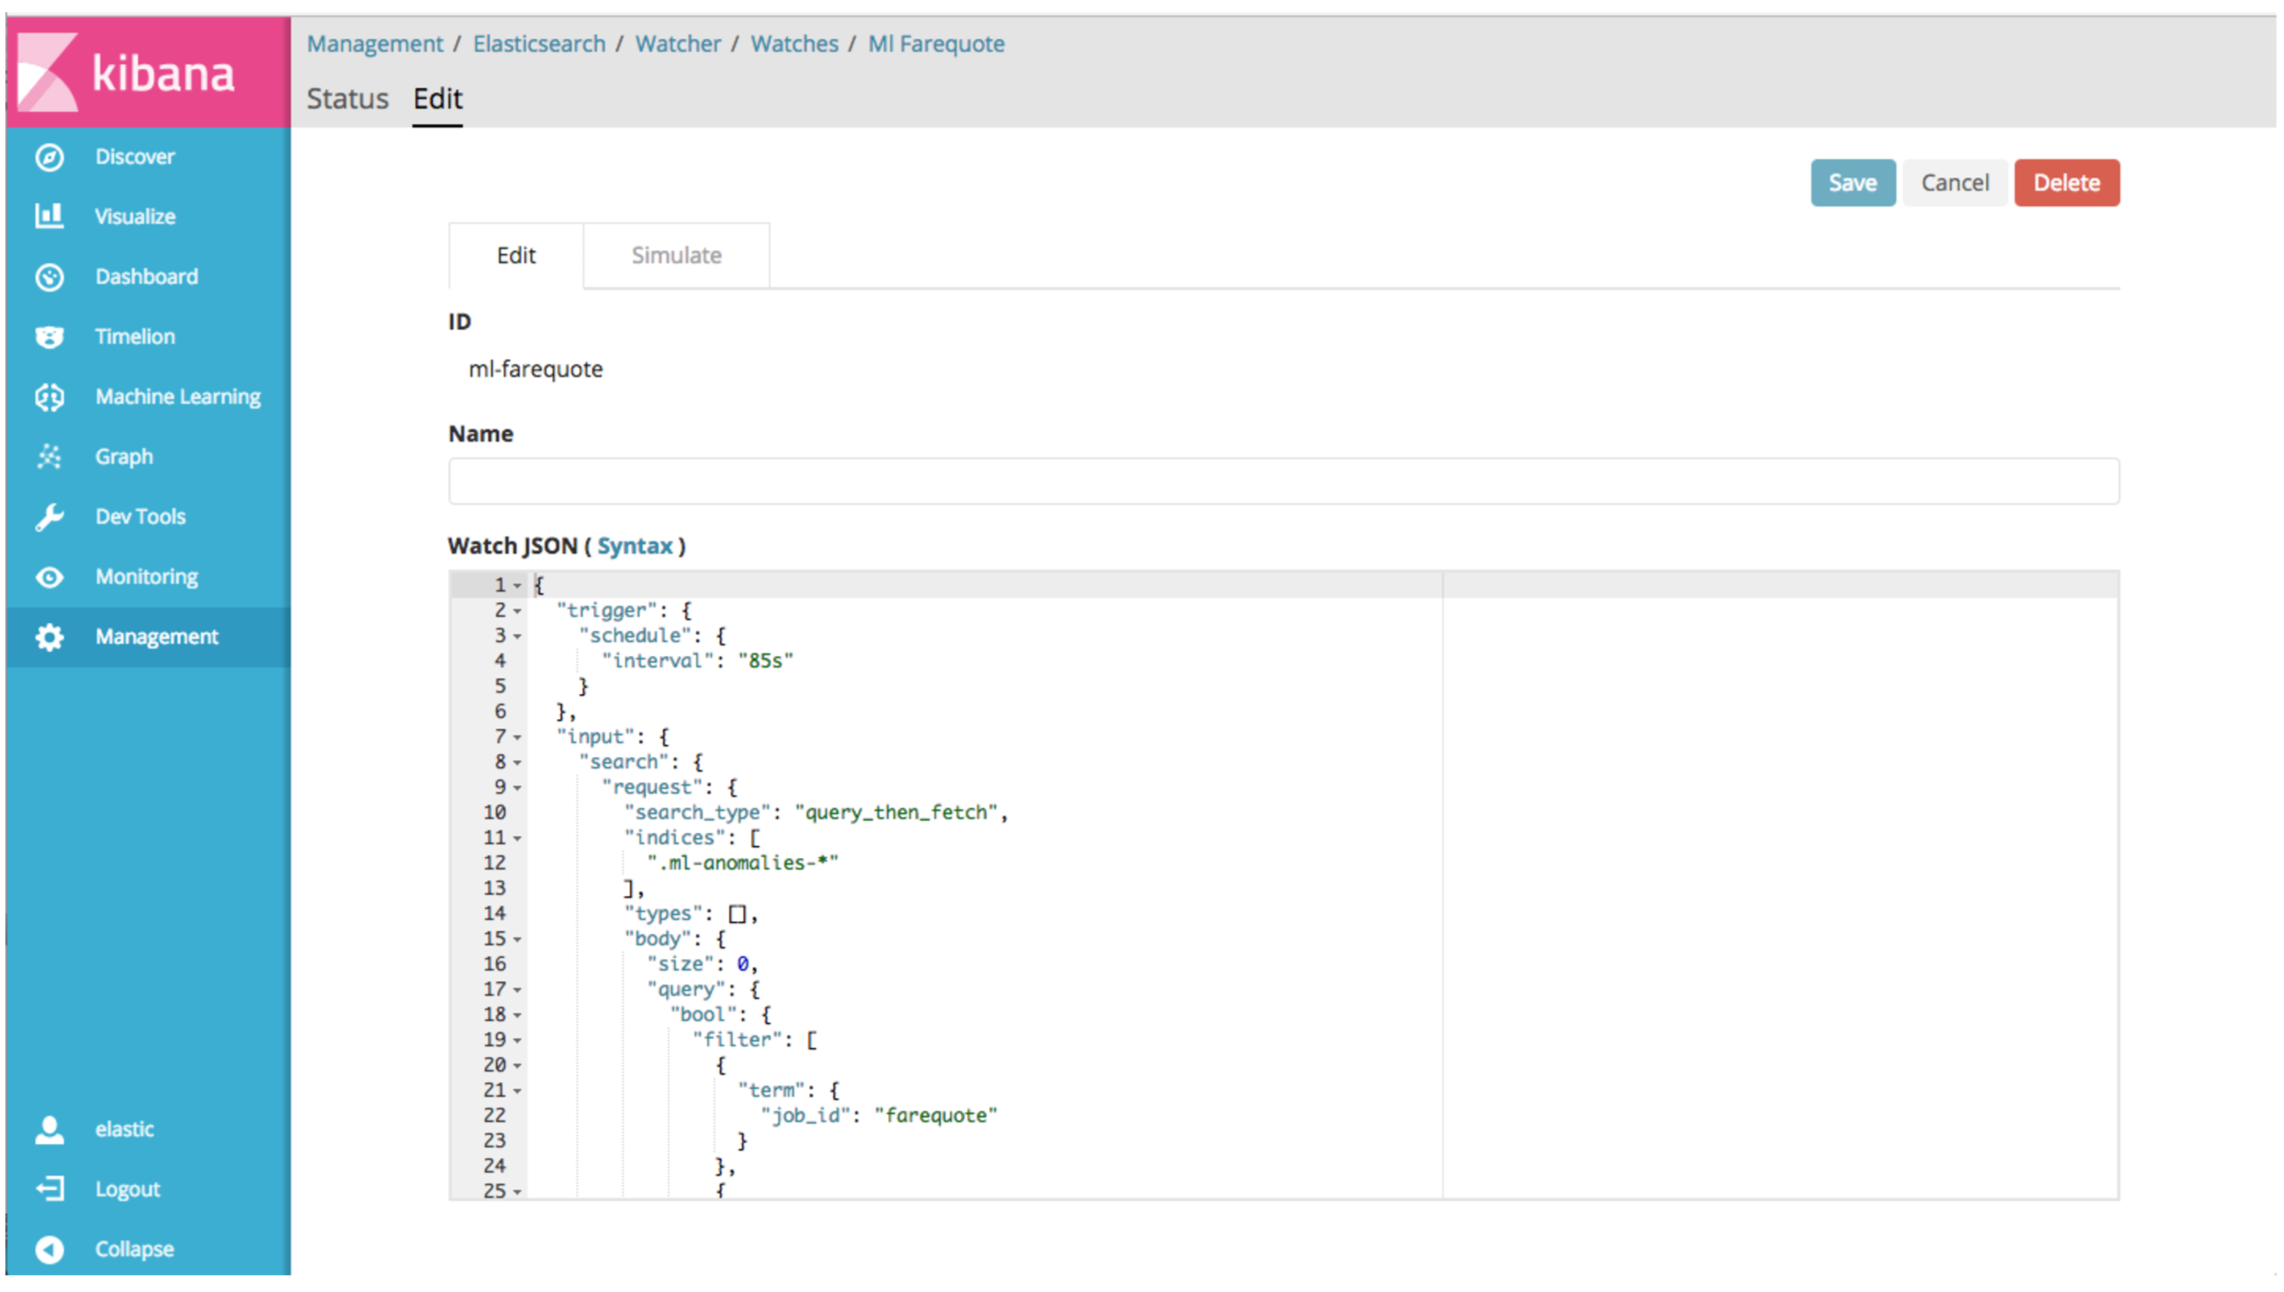
The Watcher UI is not only handy for editing the watch’s JSON definition, but you can also simulate/test the watch to see the output that the watch will return. The watch that ML creates for you always includes the logging action, even if you have chosen to use the email action. Modify this as necessary if you want to remove the logging action or if you want to have your watch initiate a different action.
If you test the watch over a time range that you know there are anomalies (by temporarily modifying the range in the input query for the watch), you could see something similar to the following in the Simulation Results:
    "actions": [
      {
        "id": "log",
        "type": "logging",
        "status": "simulated",
        "logging": {
          "logged_text": "Alert for job [my_first_alerting_job] at [2017-07-11T16:10:00.000Z] score [91]"
        }
      }
    ]
  },
There you have it - a simple watch created for your ML job!
The Advanced Way
Perhaps you’re the type that isn’t satisfied with just the basics - you like to roll your sleeves up and customize things further. If so, read on! But, before we get too far along, let’s take a step back and first understand that ML’s results are "presented" at 3 different levels:
- The "bucket" level
- Answers: "How unusual was the job in a particular bucket of time?"
- Essentially, this is an aggregated anomaly score for all detectors, all splits, etc.
- The "record" level
- Answers: "What individual anomalies are present in a range of time?"
- All the detailed anomaly information, but possibly overwhelming in big data
- The "influencer" level
- Answers: "What are the most unusual entities in a range of time?"
Secondly, you have 2 ways that you can "get at" the results
- The ML /results API
- Direct querying of the
.ml-anomalies-*indices
Which method (API or ES query) is preferable? There's no "official" answer on this, but personally I like querying the ES indices directly because there's more flexibility. Now, depending on what you're trying to accomplish with the alerting, you'd choose the appropriate query at either the bucket level, the record level, or the influencer level.
I’ll strongly recommend avoiding only querying for anomalies at the record-level, especially for big, diverse data sets. Machine Learning is already smartly aggregating the results of anomaly records at the bucket and influencer levels so that the resulting information is rate-limited and easier to manage for big data.
Over at our public examples repo on github, I’ve created two example custom watches - one that queries for results at the bucket level, and another that gives detailed anomaly record information, but only if the aggregated score at the bucket level is sufficiently high. This is accomplished via the usage of the chained input feature of a watch.
I won’t repeat the details of those watches here, but instead I would like to use the rest of this blog to convey some key points about ML and watches:
Note that if a watch is created using the ML user interface, the watch will still exist even if you later delete the ML job. Manually delete the corresponding watch after deleting the ML job.
In the ML user interface, you cannot (as of the writing of this blog) create a watch from an existing job. However, you could easily copy a watch from an ML job that was created via the ML user interface, then just simply change the job_id in the watch JSON to match the job for the new watch.
In general, keep the interval over which you have your watch looking for recently created anomalies to be no shorter than the equivalent of twice the bucket_span. If you try to customize this and make the interval too short, your watch may inadvertently miss newly created anomalies. This is because the timestamp of an anomaly written to the index is equal to the beginning time of the bucket. So, the ML job currently processing the bucket of data between 11:55 and 12:00, will be indexed any anomalies found in the timeframe with a timestamp of 11:55 (obviously this is a 5-minute bucket_span job). The clock time at which this anomaly record is indexed could be as late as around 12:01 due to the default 60s query_delay parameter of the datafeed and any other time associated with processing that data. As such, a watch triggered at 12:00 (clock time) which looks back for anomalies with timestamps as early as 11:55 will not see anything because the anomaly record hasn’t even been indexed yet (and won’t be for another 60 seconds). This is why keeping the interval to a width equivalent to twice the bucket_span will ensure that anomalies won’t be missed by your watch.
The watch created by the ML user interface will also have a default trigger interval (how often it fires) roughly around 60 seconds (plus a little randomness for spreading things out). This means that if the watch is running about every minute, but looking over a span of time of equal to twice the bucket_span, it is possible that subsequent watch invocations are going to match (and alert) on the same anomaly. As such, investigate the usage of throttle_period in the watcher documentation to limit repeat notifications.
Summary
To sum it up, v5.5 of Machine Learning has made it quite easy to create simple Alerting watches for you directly from the UI. You can always edit and customize these watches, or you can just create watches from scratch if that’s your thing.
Happy detecting!
If you would like some other getting started material, please check out our ML tutorial video series:
Or, for a limited time, we’re offering our complete online training course for Machine Learning for free!