Aftershock Therapy with Elasticsearch and CSV Data Import
Hey! Before you start reading, I just want to properly set expectations. We (Elastic) have other blogs about using Elasticsearch and Kibana for visualizing earthquake data, and this one is — by far — the most entry-level. For something more in-depth, you may want to check out Earthquake Data with the Elastic Stack blog by Kosho Owa and Mark Walkom. It’s a great piece created by people who know a lot more about using the Elastic Stack than I do. A lot more.
That said, I hope this blog can help prove you don’t need to be an Elastic expert (like Kosho and Mark) to do some really cool stuff with the Elastic Stack. So if you’re already a master of geo_point visualizations, this may not be the blog for you. But if you’re still a bit of a novice, or stumbled upon this blog via some sort of internet clickhole, enjoy. And if you want, you can skip the intro and jump straight into the tutorial.
Elastic is a distributed company, which means I can work from pretty much anywhere with an internet connection. It’s a pretty great setup most of the time. Really, the only time it’s been a problem has been when working from a living room situated less than ten miles from the epicenter of a 7.0 earthquake.
I live in Chugiak, Alaska, a small town just north of Anchorage. And around 8:30 a.m. on November 30 — while in the middle of a 1:1 video call with my manager — my whole house started shaking. Not like it was being hit by an earthquake (common here), but like it was being shelled by heavy artillery. Once I realized it was a really big quake, I jumped up from the couch (Bluetooth earbuds still in) and ran down the vibrating hallway as loud cracks and booms echoed throughout the house. Then my girlfriend and I hunkered down for a minute and a half of violent reverberation, hoping the whole time that the house wouldn’t split in two.
When the shaking had ended, we surveyed the damage. Our cupboards, shelves, and refrigerator had been emptied onto the floor, but luckily, there didn’t appear to be any structural damage or gas leaks. It was a bad day to be a wine glass or ceramic tchotchke, but things could’ve been a whole lot worse. After that I called my boss — who watched the house shake before the internet dropped — to let her know that we were ok. She promptly gave me the day off.
Just as my nerves started to calm, another quake hit, this time a 4.8. And then a 5.7. And then a 4.0. When the aftershocks slowed, I made some calls and then headed out to check on friends. No one was hurt (not even our friend that was driving 65 on the highway during the 7.0), and no one’s home took any major damage. Sighs of relief all around.
Once internet was back I hopped onto Slack to touch base with my team. I logged in to find a few dozen messages from people throughout the company, all checking in to see if we were ok and asking if we needed any help. (There were also multiple inquiries into the condition of our cat, who at the time was hiding under a blanket with no intention of ever coming out again.) I’m the only Alaskan Elastician, so I’m not sure what they could’ve done, but just knowing that my Elastic fam was there as a remote safety net started to make me feel a little better. And then the electricity went out.
Losing power is a tad stressful. Losing power in the winter in Alaska is a tad more stressful. Losing power in the winter in Alaska while aftershocks shake the house every few minutes is really stressful.
When the power came back a few hours later, I hopped onto internet to survey the damage and see how many aftershocks we’d felt. There had been over 100 aftershocks within the first 8 hours following the quake, ranging from 2.5 to 5.7. And apparently, the aftershocks were coming from two key places. The first was Anchorage, just southwest of us. And the second was Big Lake, just northwest of us. So we were only a few miles east of ping ponging aftershocks, meaning we got to feel all of them. How exciting. That first night after the earthquake was a real miserable night’s sleep. Waking up to a 4.1 the next morning wasn’t that great either.
In the days directly following, the aftershocks were relentless. It didn’t seem like there was an end in sight, and that uncertainty was steadily driving my stress levels through the roof. But then I realized that there was a way to see the end from where I was standing. If I could just visualize the magnitudes, frequencies, and locations of the quakes, I could (hopefully) understand what was going on beneath me. Enter the Elastic Stack. You know, for sanity.
Importing CSV earthquake data into Elasticsearch
As I said at the top of this post, this is a super basic tutorial for analyzing data with the Elastic Stack. No Beats, no Logstash, no ingestion pipelines, no Python scripts, no development background. This is quick and simple approach with a CSV file and a new feature within Elastic machine learning. But I still think it’s cool.
The first thing I needed to do was get USGS earthquake data as a CSV, and then import it into Elasticsearch. To do this import, I used the data import functionality that was introduced into the File Data Visualizer in Elastic Stack version 6.5.
Step 1 - Download and scrub USGS earthquake data
Rather than doing this yourself, download this CSV of Mat-Su Valley (Alaska) earthquake data. Here are the steps I took to make it:
- Download all USGS magnitude 2.5+ earthquakes from the past month as a CSV.
- Remove all unnecessary columns.
- Sort by latitude, and remove any rows outside of 61.1 to 61.9 (Chugiak is at 61.4).
- Sort by longitude, and remove any rows outside of -148.1 to -150.9 (Chugiak is at -149.4).
- Create a new column named loc that is "latitude,longitude" (Ex:
=C2&","&D2). - Save the CSV as quakes_data.csv.
It’s important to note that #5 is the only step that’s truly necessary for the purposes of this example, and that’s only due to how to the data is presented by the USGS. Elasticsearch can slice and dice data however you want, no matter the size of your data set.
Step 2 - Start a free Elasticsearch Service trial on Elastic Cloud
This is not a sales pitch, I promise. This is just the easiest way to do what we’re about to do (File Data Visualizer is a free feature through our Basic subscription). The alternative would be to download the latest versions of Elasticsearch and Kibana and install them yourself (free, as always). That method is also very easy, but the Elasticsearch Service is even easier (and also free for 14 days, no credit card required).
- Sign up for a free trial of the Elasticsearch Service.
- Log into Elastic Cloud to access your free trial (you’ll receive an email with login instructions when you start your trial).
- Click Create Deployment.
- Configure a new Memory Optimized deployment (since we don’t need much disk space).
- Click Create Deployment at the bottom.
- Save a copy of your Username, Password, and Cloud ID while you wait for the deployment process to complete.
- Once the instance is running, navigate to Kibana on the left side menu.
- Under Endpoints, click Kibana.
- Log into Kibana with the username and password from Step 6.
- When prompted, choose Explore on my own.
Step 3 - Import the USGS data from CSV
Ok, now that we have data to analyze and an Elasticsearch cluster that can do the analyzing, we need to import. We’re going to keep this simple. No index templates, no aliases, no best practices. Just import.
- Within Kibana, click on Machine Learning.
- In the subnav, click on Data Visualizer.
- Under Import Data, click Upload File.
Note: This feature is new in 6.5. If you find any issues while using it, please let us know in our Discuss forum. - Drag and drop the quakes_data.csv file (provided earlier) into the importer.
- Scroll through the list of contents. Notice that the loc field is importing as text. We will update this to be geo_point data in the next step. Click Import.
- In the Import Data window, switch to Advanced:
- Index name: quakes
- Create index pattern: unchecked (this is very important, as we’ll be importing an index pattern in the next set of steps)
- Index pattern name: blank (and uneditable)
- Under Mappings, manually change loc from “keyword” to “geo_point”.
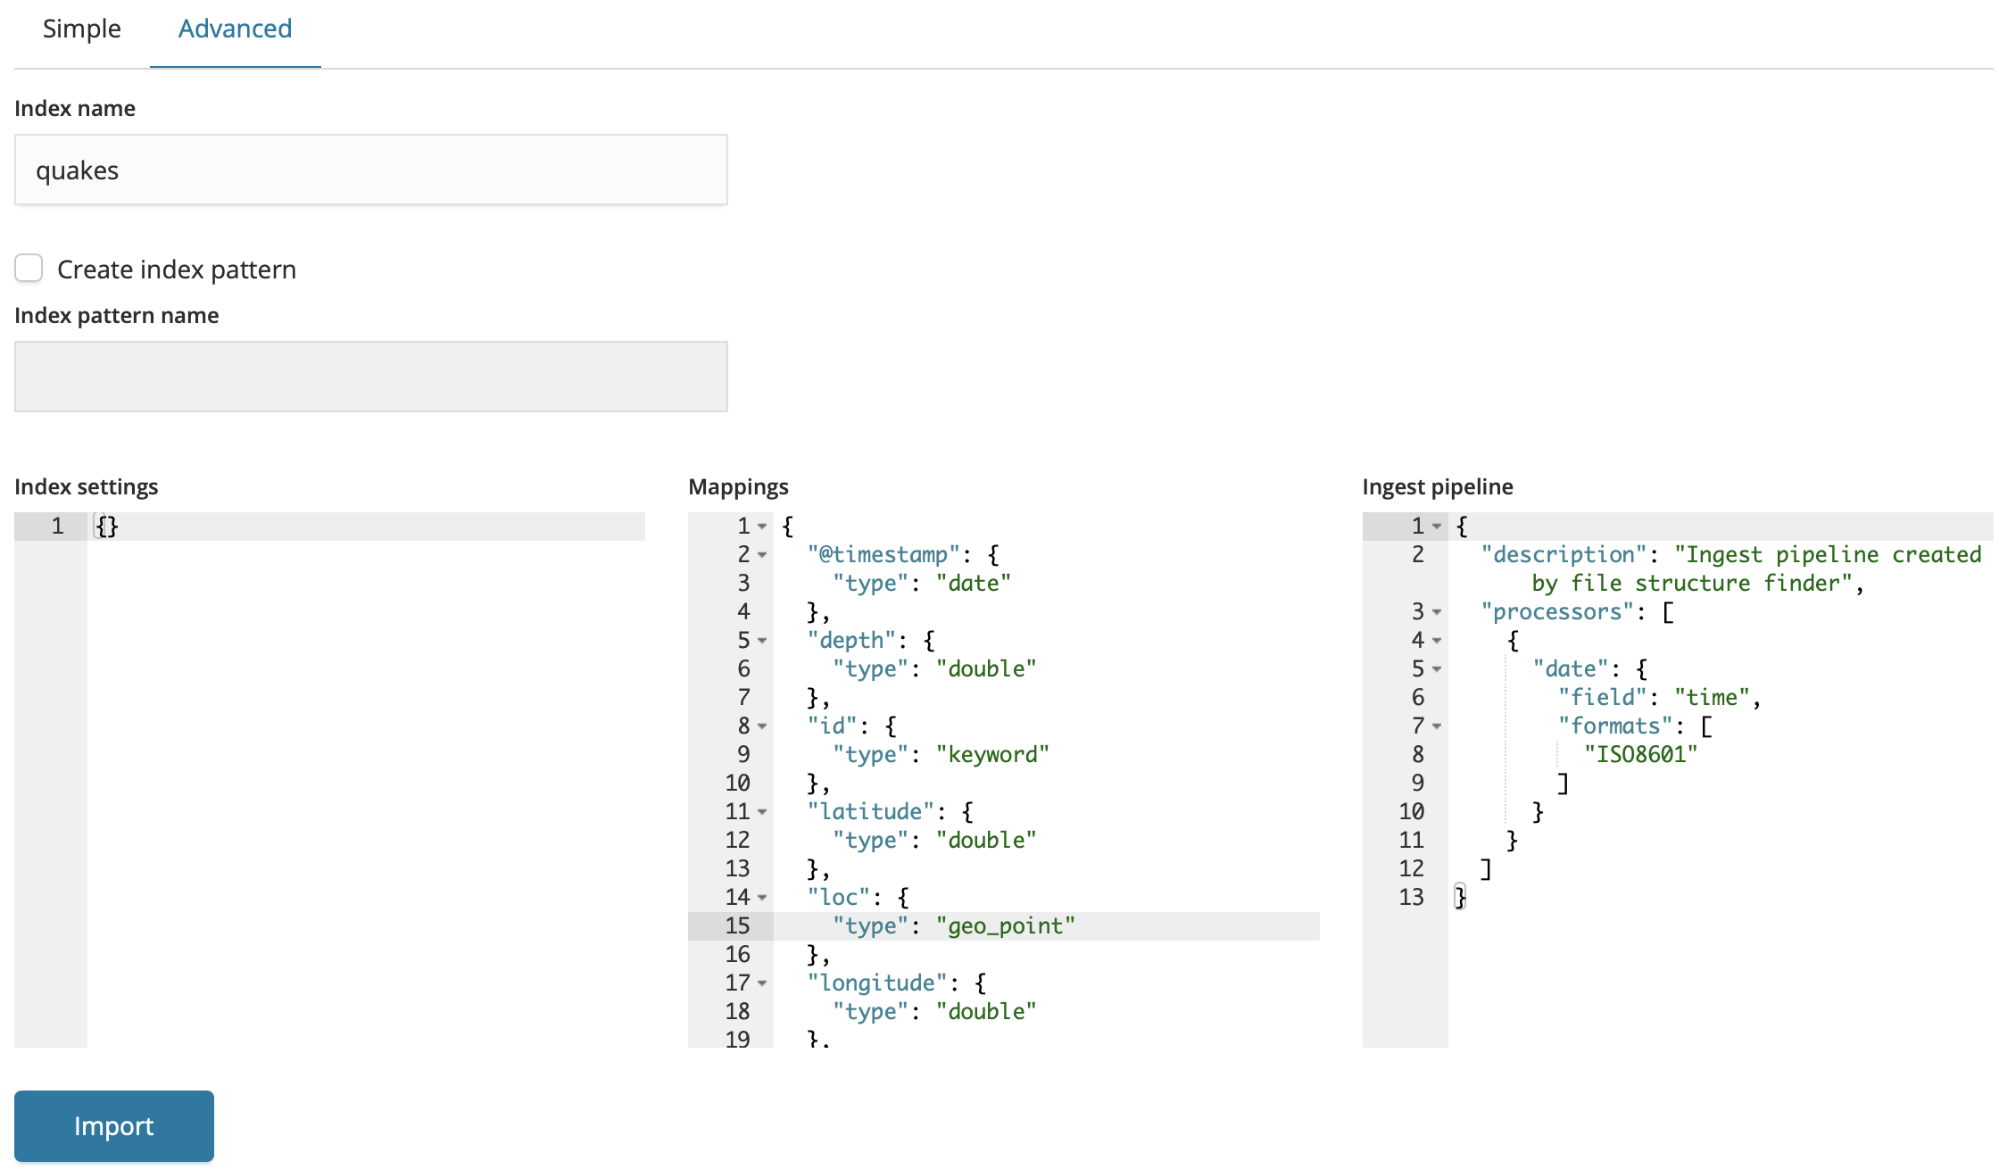
- Click Import. You’ll see that 902 documents have been imported.
Step 4 - Create Kibana visualizations using quake data
Kibana offers a variety of ways to slice, dice, and visualize data. This blog is not going to cover creating visualizations and dashboards from scratch. Instead, we’ll walk through importing some visualizations I’ve already built and saved as a downloadable json file.
- On the left side navigation, click on Management.
- Under Kibana, click on Saved Objects.
- Click Import from above the object list.
- Click Import and choose quakes_objects.json.
- Click the Import button. You’ll see 11 objects were imported.
At this point, we can start playing with visualizations in Kibana.
Step 5 - Visualize the ground shaking
Now the fun part.
- On the left side navigation, click on Dashboard.
- Click on the Quakeboard dashboard to see:
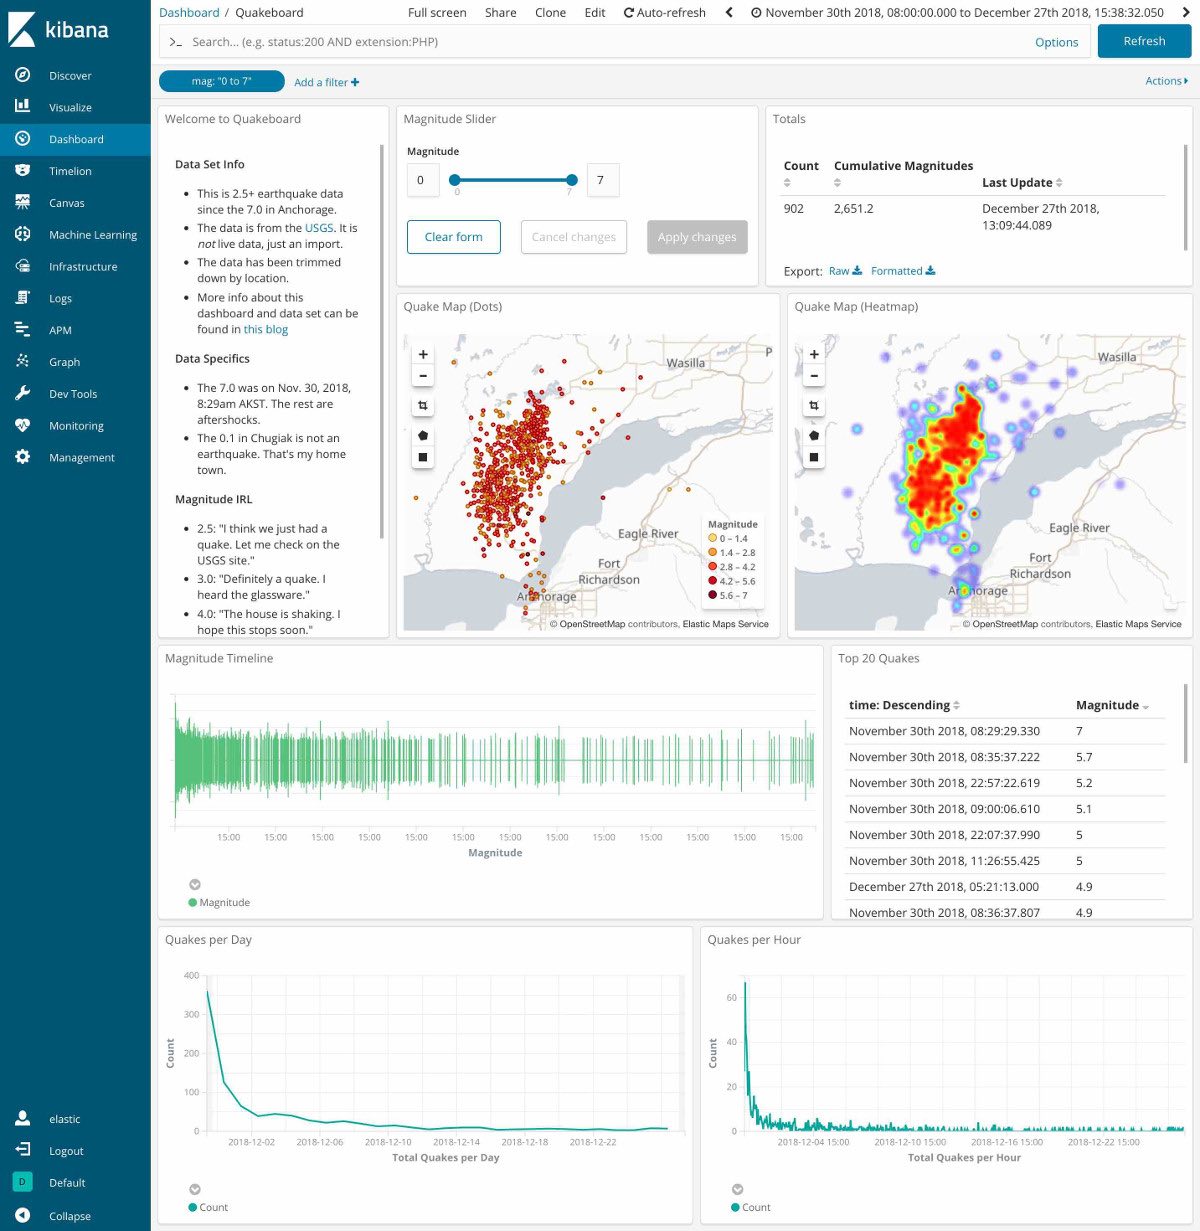
There are a variety of visualizations within this dashboard. There are two different maps showing quake locations, a Richter scale, a list of the top quakes, and two line graphs of frequencies. Up at the top right, you can see a time picker, and above the first map you can see a magnitude slider. Go ahead and play with both of them to watch the earthquakes come and go.
To adjust those different visualizations, click on Visualize within the left side navigation. This will display all the different visualizations that are on that dashboard. Explore their configurations, and don’t be afraid to break them. You can always re-import.
|
Note: Your Magnitude Timeline visualization looks a little different from the one in the screenshot. This is because I tweaked a setting past its recommended value, which could potentially cause Kibana to run out of available memory. To duplicate my visualization in your non-production environment:
|
Finding the end of the quakes with Kibana
Once I had everything loaded into Elasticsearch and visualized in Kibana, my unreasonable fears that the aftershocks were never going to end started to fade. Using the Time Picker, let’s go through the timeline of aftershocks (2.5 magnitude and higher):
24 hours later - 420 aftershocks
Crazy, right? You’d think with that many quakes, my little town would crumble into the Knik Arm (the waterway between Chugiak and the epicenter), but it hasn’t. And it probably won’t. There was a famous 9.2 back in 1964, and Chugiak is still standing. (For perspective, an 8.0 is 10x stronger than a 7.0, and 9.0 is 10x stronger than an 8.0.)
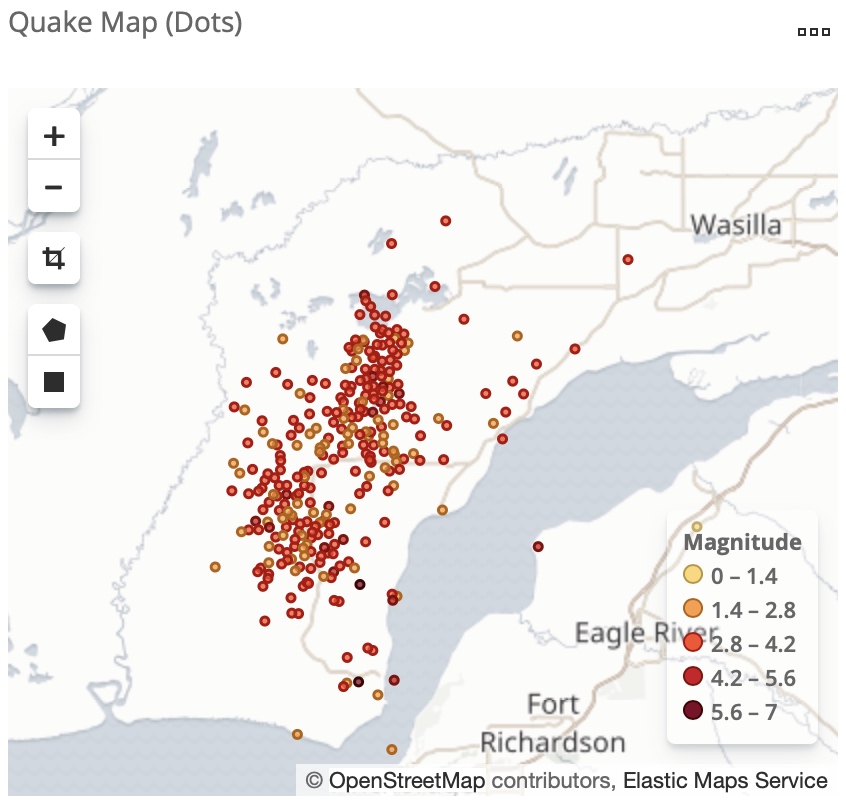
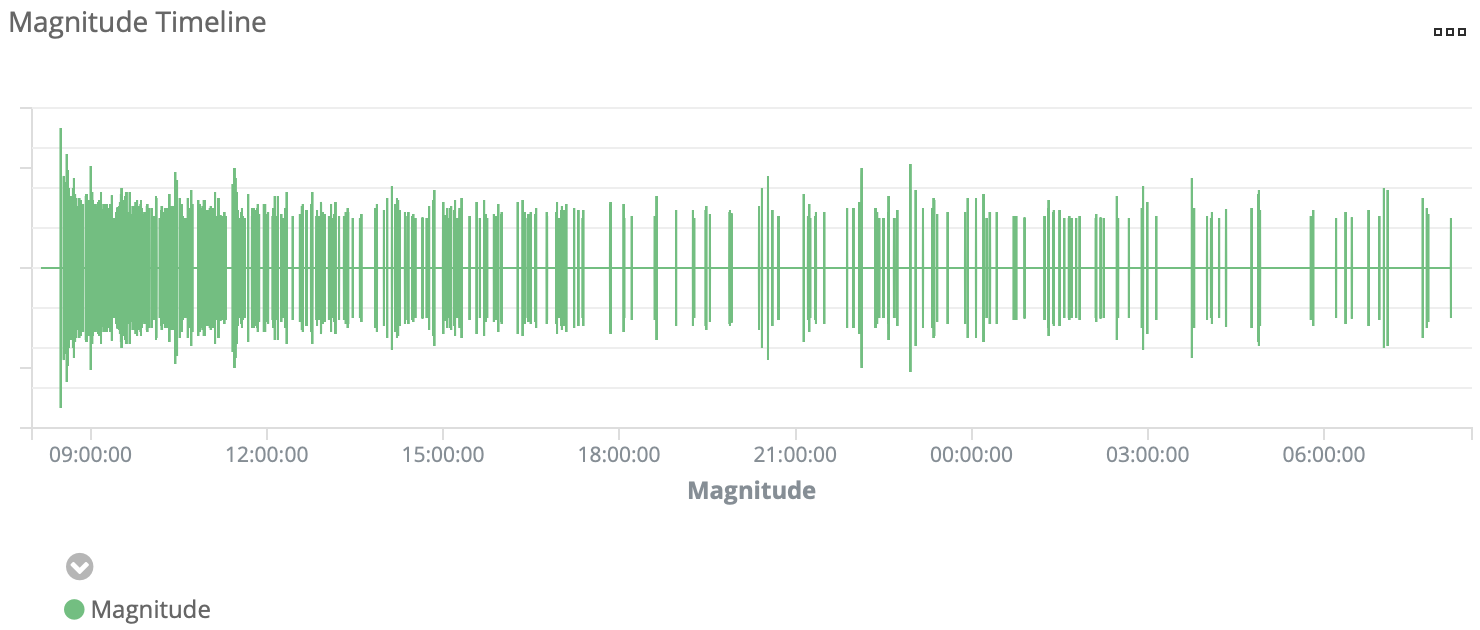
Digging into the data a bit more, the Quake Map and the Magnitude Timeline did not have a calming effect:
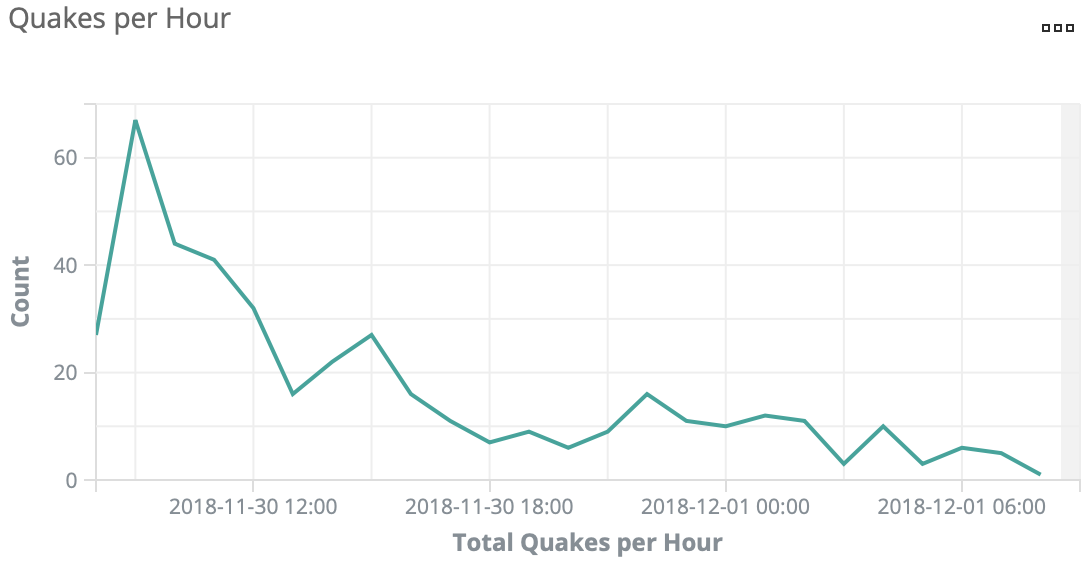
But the Quakes per Hour chart was showing positive signs:
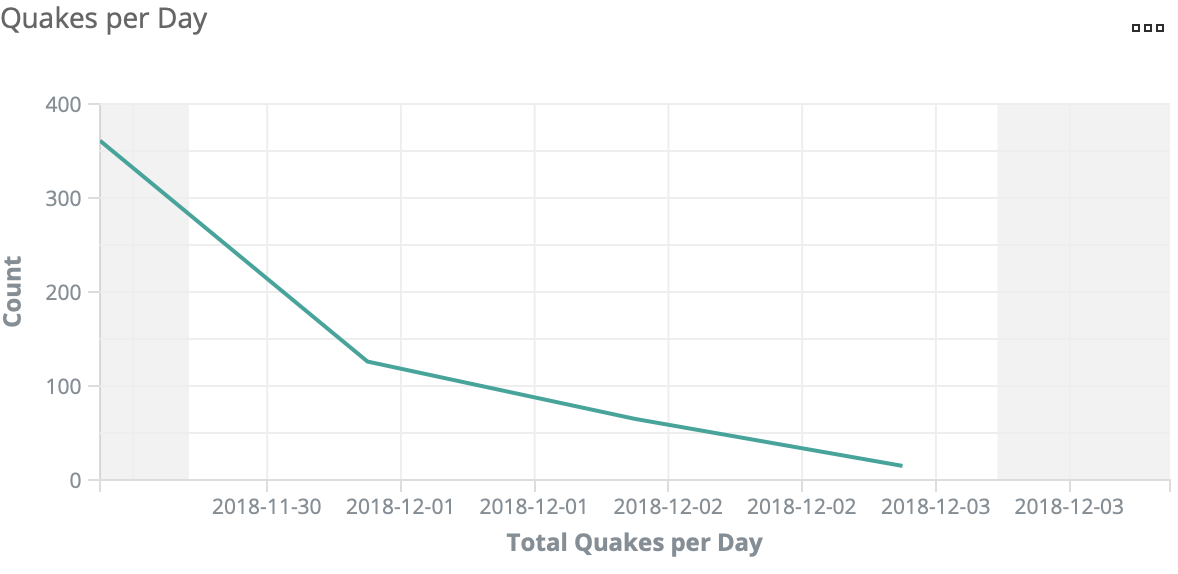
3 days later - 565 aftershocks
The maps were still filling in, but the Quakes per Day chart was trending downward quite nicely:
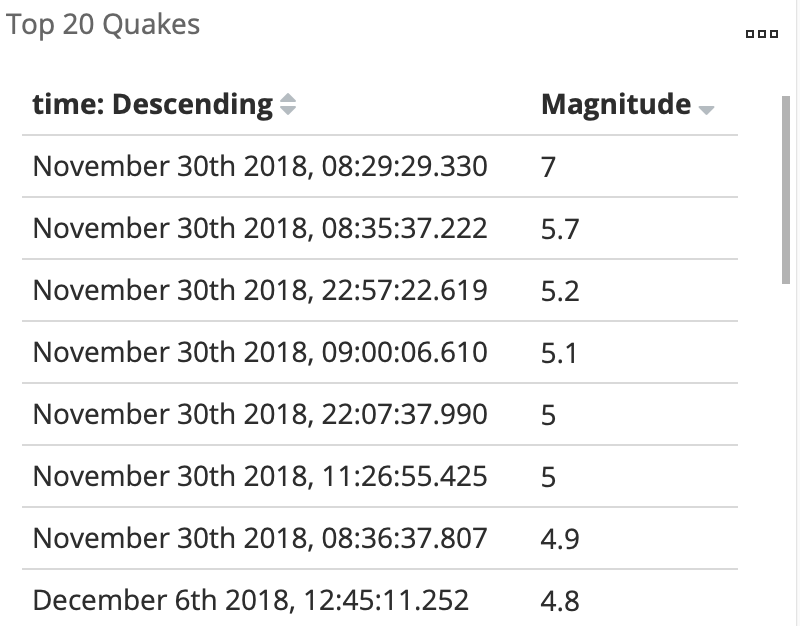
1 week later - 707 aftershocks
Everything was still trending download, but even more importantly, they seemed to be losing intensity. On the Top 20 table, only 4 quakes were from after the first 24 hours.
(Nearly) 1 month later - 900 aftershocks
All signs are pointing to this eventually ending. The cumulative heat map may look hot, hot, hot:
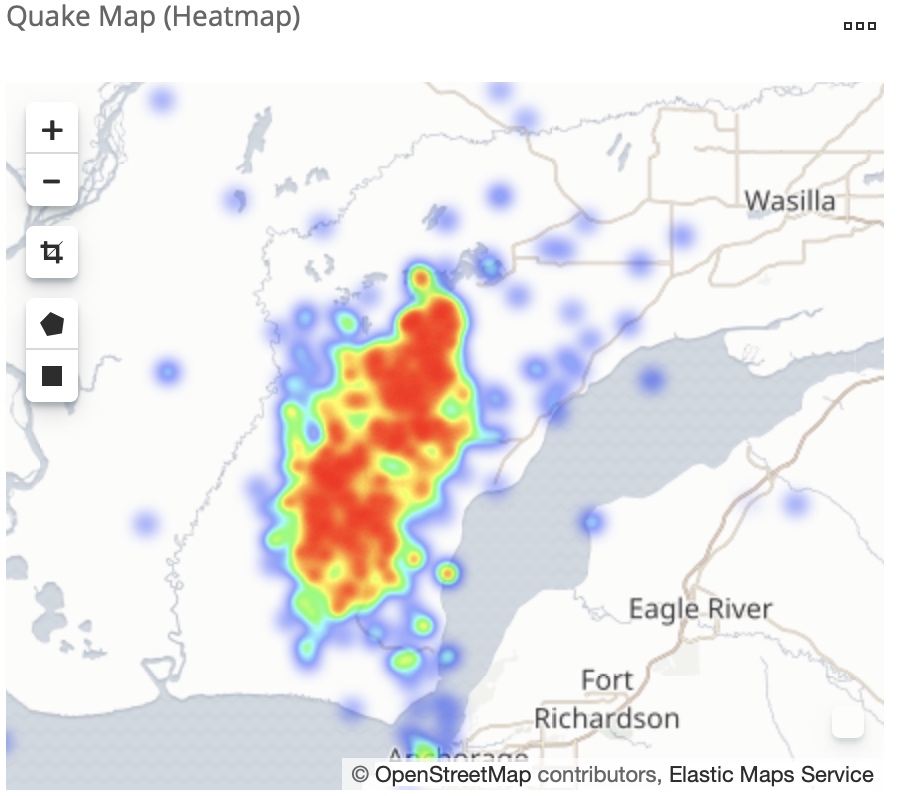
But by looking at each week following the quake, we can see the heat map getting cold as ice:
Still rocking, even if the ground’s still rolling
And there you have it. While the aftershocks still haven’t completely stopped, watching their frequency steadily decline has definitely helped me sleep easier. So easy, in fact, that I didn’t even stir during the 4.9 that rattled the house at 5:30am on Dec 27th. I think it’s safe to say that my constant fear of aftershocks has finally been quelled. Up next, sharks. (Sike! I’ll never not be scared of sharks! Numbers be damned!)
If you have interest in learning more about some of the cool stuff you can do with geo data in the Elastic Stack, check out the State of Geo in Elasticsearch talk from Elastic{ON} 2018. And if you’re interested in just learning more about how to use Elasticsearch and Kibana, I’d strongly recommend the Elasticsearch Engineer I and Kibana Data Analysis training courses. You’ll be amazed how at quickly you can go from n00b to proficient. I was, at least.