Why does Elastic Support keep asking for diagnostic files?
If you’ve worked with Elastic Support, you may have been asked to run the Support Diagnostic tool and provide the output in your support case. This is a common practice, but a lot of you out there may not know why. While the short answer is "it depends", this blog is going to explain why we keep asking for diagnostic files (as well as what’s in them).
Simply put, the Support Diagnostic helps Elastic Support understand the state of your cluster. For example, it helps with:
- Isolating cluster performance issues
- Optimizing cluster configuration
- Troubleshooting field mapping issues
- Collecting general information about the state of the cluster
Running a Support Diagnostic will usually not be the single “ultimate” solution to every Elasticsearch issue, but we hope the following demonstrates why it is an important step in the troubleshooting process.
Data privacy and security as a priority
Before we get started, a quick note about privacy. The Support Diagnostic outputs run-time information about the health of your nodes and other cluster metadata. It does not collect the actual source event or document data stored in your cluster. You may have known that, but we just want to be extra clear, as privacy is a top concern here at Elastic (and probably for you too).
Later in this blog, we’ll outline how these files can be sanitized even further by scrubbing out metadata that you may also consider sensitive (IPs, hostnames, index names, etc). If you want to jump straight to it, check out the “Scrubbing Capability” section below for more information. Otherwise, let’s get started.
Run a lot of API calls with a single command
Elasticsearch provides many APIs that can be queried for operational cluster information. So when we’re troubleshooting an issue, it’s extremely helpful — and convenient — to dump out as much information as possible from those APIs instead of running them manually. And the Support Diagnostic lets us do just that.
Running the single Support Diagnostic command prevents users from having to collect the output from dozens of different individual API calls. Compressing this output into a single zip archive allows Support to quickly cross-reference results from different commands with internal tools. We can then use these files to diagnose sharding issues, performance bottlenecks, field mapping problems, and much more. And any user can use the output zip to diagnose cluster issues or share with other team members.
And since it’s a Java application, the diagnostic has no operating system requirements, so it can run almost anywhere with a Java Virtual Machine (JVM) installed. It does have a few basic requirements which are documented in the README.
In the diganostic’s simplest form, a command like the following...
./diagnostics.sh
or
.\diagnostics.bat
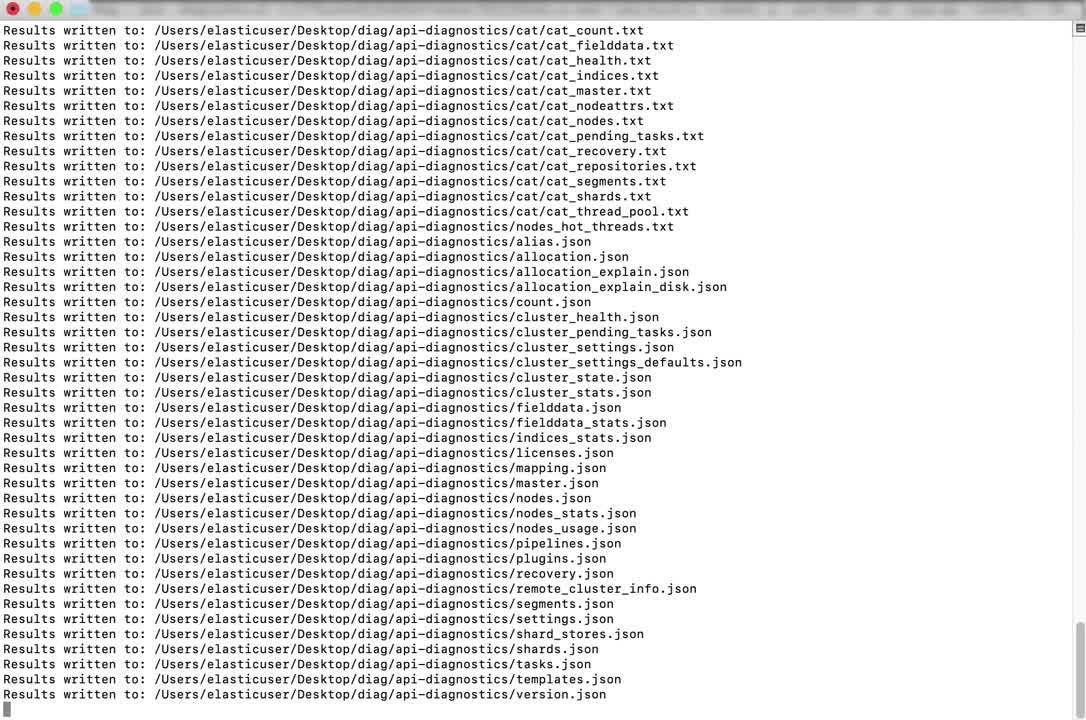
...will prompt for some user input and query multiple Elasticsearch APIs to produce a compressed zip archive of text and json files. You can see the full list of files it creates, and the API’s that populate them in the Support Diagnostic .yml file. Here's a short video to show you exactly how the tool works:
If you’d like to learn more about the API’s that create these files, see the REST API documentation.
At this point, you’ll be left with an output zip that will likely be several MB’s in size, representing the configuration and state of the Elasticsearch cluster at the point in time the diagnostic was executed.
Diagnostics in action!
Let's take a look at some examples of what we can do with that simple command we ran up above.
“Slow searches” example
When searches against the cluster are reported to be “slow”, we can look at the cat thread threadpool output (cat_thread_pool.txt) to see the amount of requests queued and rejected on the search threads:
node_name    name      active    queue    rejected
Node1        search    5         10       2567
Node2        search    4         16       2345
Node3        search    6         29       2865
Based on that, we might look at the cat indices (cat_indices.txt) or cat shards (cat_shards.txt) outputs to see that this 3 node cluster contains tens of thousands of small shards — quickly identifying an “over-sharded” scenario (and we have guidance for that).
Logstash ingest example
Some events sent from Logstash are not arriving in the Elasticsearch cluster. A Support Diagnostic from Logstash may show that in the node stats (logstash_node_stats.json) API output that events are entering a grok expression in the pipeline, but never being output. This may indicate an incorrect grok syntax issue, calling for a review of the Logstash error log and pipeline config:
"name" : "grok"
}, {
"id" : “some_numeric_component_id",
"events" : {
"duration_in_millis" : 191628932,
"in" : 16910264125,
"out" : 1367
},
These are a few basic examples from the wide range of issues a Support Diagnostic can help us diagnose, and not all investigations will be the same. Diagnostic analysis will often identify other information needed to address an issue, like additional logs or configuration files.
Other ways to execute: Interactive vs command-line, local vs remote, and more
The diagnostic has different runtime modes you can choose. In the previous command above, the diagnostic ran in interactive mode, which is useful if you prefer to be prompted for input and don’t want to construct a full command-line of parameters yourself. But there is another other command-line mode we’ll look at, where you have the ability to specify how and where the diagnostic executes via the parameters you choose. Later, we’ll look at an example of executing the diagnostic remotely in command-line mode while discussing the difference between executing locally and remotely.
Running “local” vs “remote”
Even if you don’t have the ability to install the diagnostic directly on an Elasticsearch node, you may still be able to execute it remotely and gather useful information. From version 8.0.0 and up, the diagnostic collects the same artifacts in local and remote modes.
Both local and remote modes collect REST API calls from the Elasticsearch cluster, error logs from the Elasticsearch node that is targeted, and available system calls like the following (will vary by operating system):
top— monitor processes and system resource usage on Linuxiostat— monitor system I/O device loading, like disk, on Linuxnetstat— monitoring both incoming and outgoing network connections
Note: Support Diagnostic versions before 8.0.0 behaved differently, where remote executions did not collect the system data or logs that a local execution did. We recommend users run the most current version of the Support Diagnostic, which is what is described in this blog post.
Remote Command-line example
Let’s construct a command-line example of executing remotely, because we don’t have the ability to install the Support Diagnostic on the node we’re troubleshooting, and we want to specify some runtime parameters up front. We’ll execute the Support Diagnostic from a different host to connect to an Elasticsearch node over the network, and specify command-line parameters to establish the “trust” level required to run on that host:
./diagnostics.sh --host 10.0.0.20 --type remote --remoteUser someuser --remotePass --trustRemote --sudo
Multiple command-line parameters are specified in the example, including --remoteUser and --remotePass. Remote mode establishes an SSH session to the targeted Elasticsearch node, and these parameters determine the required user credentials needed on the host to collect the diagnostic data. The --sudo command is used in case the remote user does not normally have the required permissions to obtain files on the host, like the Elasticsearch error logs.
More explanation of the various options for executing remotely and on the command-line can be found in the usage documentation.
What if your cluster is secured with user authentication and TLS encryption, as it should be? Or if you run a cluster in Docker containers? Or if it’s behind a proxy server? We’ve got options for those too:
Secured cluster example
With the right parameters, you can connect to a secured cluster that uses both Elasticsearch user authentication and TLS encryption. Let’s update the command from the last “remote” example to specify credentials for an Elasticsearch user that has access to the cluster, and tell the diagnostic to use HTTPS encryption to connect securely:
./diagnostics.sh --host 10.0.0.20 --type remote -u elasticuser --password --ssl --remoteUser someuser --remotePass --trustRemote --sudo
The addition of the -u, --password, and --ssl parameters will prompt for obfuscated password input of the Elasticsearch user specified, and connect to the cluster using TLS encryption.
You can read more about other available options and use cases in the diagnostic’s Github repository.
Scrubbing capability
For some of you, metadata privacy may be just as important as operational data privacy. If that’s the case for you, the diagnostic can obfuscate specific terms or “tokens” with generated terms in its output that are consistent within the output files. Simply define the terms you wish to scrub in a list of tokens within a yml file, and execute the scrub command:
Example tokens in a yml file
tokens:
  - 'node-[\d?]*'
  - 'cluster-630'
  - 'disk1'
  - 'data-one'
Example scrub command
./scrub.sh -a /path/to/my/diagoutput/diagnostics-20180621-161231.tar.gz -o /home/adminuser/sanitized-diags -c /home/adminuser/sanitized-diags/scrub.yml
The diagnostic will replace each token found in the diagnostic with a generated literal term. For example the term data-one in the tokens list will become some_string_value_1 throughout the diagnostic output. More file sanitization options can be found in the File Sanitization section of the diagnostic’s repo.
Don’t forget Logstash!
Like we showed earlier, the diagnostic tool is not just for Elasticsearch clusters — it can also execute against Logstash to produce run-time metrics about memory utilization, pipeline inputs/outputs (with event counts), and a summary of other Logstash Stats API options.
A Support Diagnostic against Logstash can also be executed locally or remotely, by using either the logstash-local or logstash-remote --type values. In this example we execute the diagnostic on the same host as Logstash with --type logstash-local and against a non-standard port value of 9610:
sudo ./diagnostics.sh --host localhost --type logstash-local --port 9610
A different set of files will be produced in the zip, capturing much of the content from the Logstash APIs mentioned above. Feel free to review the specific output files on the following page.
What about Elastic Cloud Enterprise (ECE) diagnostics?
ECE users may have noticed that everything so far is related to the publicly available Support Diagnostic for Elasticsearch clusters and Logstash instances. An additional Support Diagnostic exists for ECE to collect information about ECE containers and components.
The ECE diagnostic can efficiently collect logs and metrics from things that ECE uses behind the scenes to orchestrate, like allocators, proxies, Zookeeper, even the error logs from the Elastic Stack components being hosted.
The Support team will often request both the traditional, cluster-level Support Diagnostic (as discussed in this blog) as well as an additional ECE diagnostic from ECE instances. Since the ECE Support Diagnostic is a totally different utility, it’s important to note the difference between a Support “cluster” diagnostic and an “ECE diagnostic” in this scenario.
Anything else?
Yes! The Support Diagnostic is a “living” utility that is always being updated. Try to use the most recent version in order to access content from new API calls, tinker with experimental features like the new Monitoring Data Export, or just benefit from general improvements as they’re made.
Hopefully this helps explain what the Support Diagnostic is, what you can do with it, and how it aids Support in ensuring your cluster is running at its optimal performance. Explore its APIs further, offer feedback in the repository, or use it for your own Elastic troubleshooting purposes.