Review testing methods for Elastic integrations using the elastic-package tool

 Share on Twitter
Share on Twitter

 Share on LinkedIn
Share on LinkedIn

 Share on Facebook
Share on Facebook

 Share by Email
Share by Email

 Print this page
Print
As observed products and services evolve or their authors introduce new features, it’s essential to preserve compatibility between the product and the corresponding integration and detect inconsistencies as soon as possible.
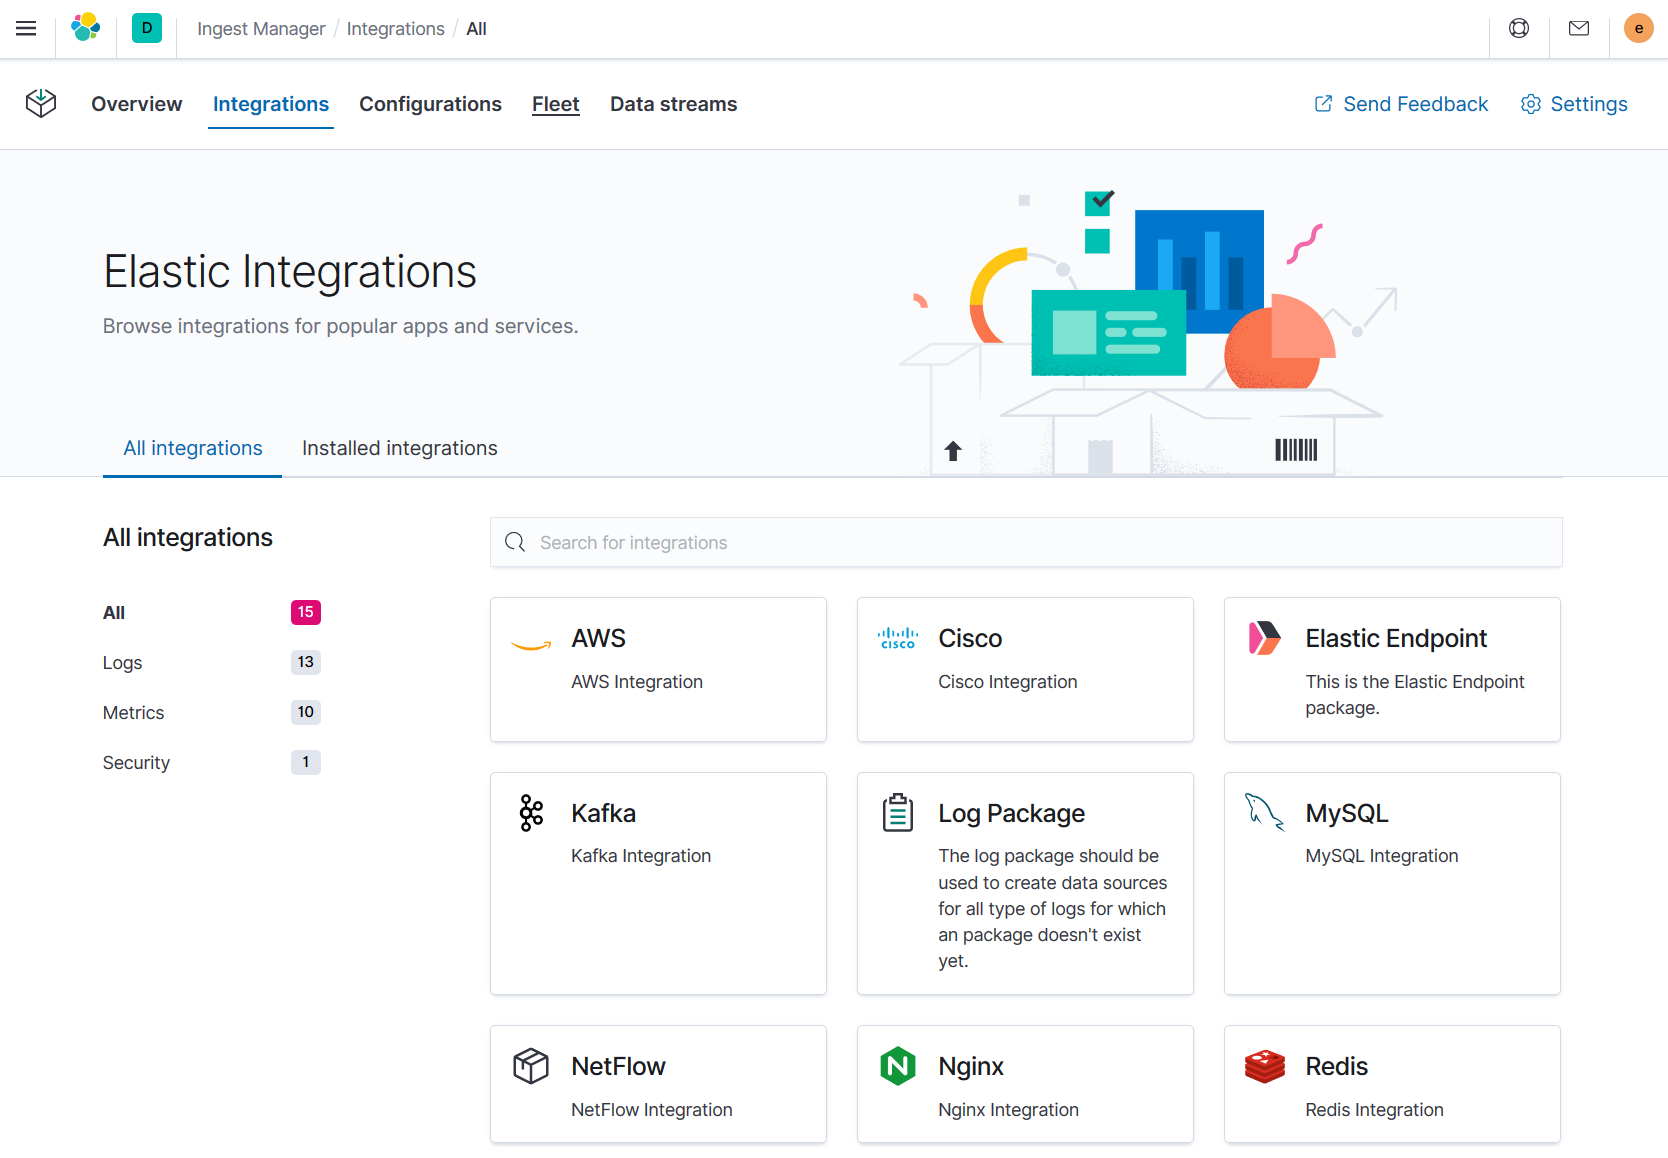
At Elastic, we use the elastic-package on a daily basis to create and maintain integrations. Today, we'll review existing testing methods for integrations and learn how to verify integrity between Elastic Agent and observed products.
Review following testing methods and adopt them in your integrations to increase test coverage for pipelines, manifests, fields, etc. Adopting at least a few of them will prevent hours of manual testing and bug hunting.
Preparation for tests (cheatsheet)
All testing methods require the Elastic stack to be present for testing. Boot up the stack with the command:
elastic-package stack up -dIf you want to reload the content of Elastic Package Registry (EPR), use the following command:
elastic-package stack up -d --services package-registryKeep in mind that reloading makes sense only when you have rebuilt the package and would like to expose it with the EPR. It’s quicker than restarting the entire stack, but may be insufficient if Kibana caches the package revision (name and version).
The test runner also requires environment variables to point to the stack endpoints (Kibana, Elasticsearch). Use this eval to populate these variables:
eval "$(elastic-package stack shellinit)"Asset tests: verify if your integration can be installed successfully
The first described testing method is asset testing. The test runner uses an active Kibana instance to perform an installation procedure of the package. Build the package:
elastic-package buildNext, staying in the package root, boot up the Elastic stack or reload the Package Registry.
Asset testing can be performed with the following command (verbose mode):
elastic-package test asset -vHere is the sample output of asset tests running for NGINX Ingress Controller:
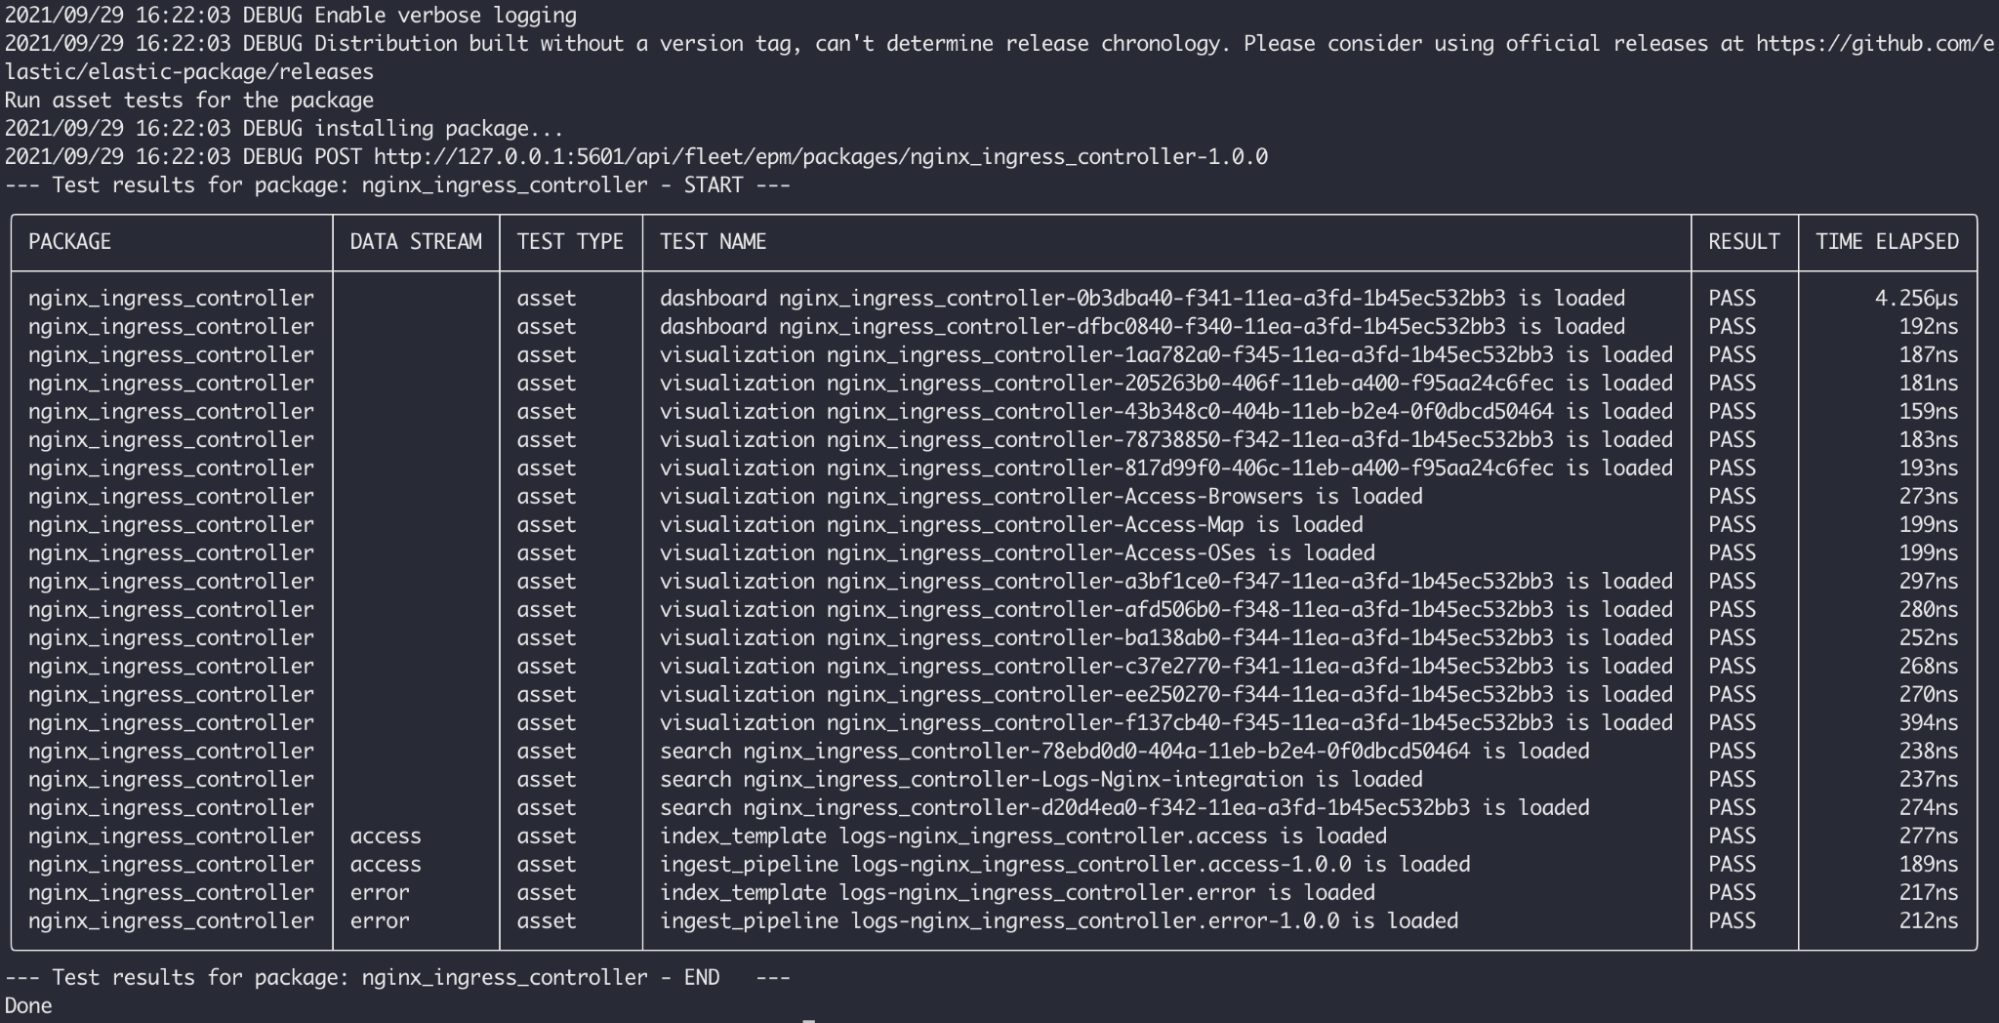
As you can see, the elastic-package installed the appropriate package first in Kibana (POST call) and then performed a set of checks to verify that all package elements are available. It can check different parts, especially Kibana saved objects (e.g., Kibana dashboards and visualizations), ingest pipelines or index templates (field mappings).
Asset tests are relatively fast and can give you an ultimate answer whether your package is installable. You could achieve same result with manual clicking through Fleet UI, but it's definitely doing this with the elastic-package and nearly impossible to miss any package components that should be installed.
Pipeline tests: unit tests for Elasticsearch ingest pipeline
If you're dealing with log files requiring additional transformation before storing them in the Elasticsearch, it's a good habit to prepare all representative files (including different formats) and use them to exercise the ingest pipeline.
A single pipeline test case contains a single input log file with an optional test config and expected output (documents ready to be stored in Elasticsearch). Let's review pipeline tests written for the NGINX Ingress Controller integration, the error data stream (error logs):
tree nginx_ingress_controller/data_stream/error/_dev/test/pipeline
.
├── test-error-raw.log
├── test-error-raw.log-config.yml
└── test-error-raw.log-expected.json

The test-error-raw.log file contains a small, representative sample of application logs:
I1215 14:15:13.816334       8 main.go:256] "Trying to discover Kubernetes version"
I1215 14:15:13.816854       8 round_trippers.go:449] Response Headers:
F1215 14:16:33.326604       8 main.go:294] Error while initiating a connection to the Kubernetes API server. This could mean the cluster is misconfigured (e.g. it has invalid API server certificates or Service Accounts configuration). Reason: Get "https://127.0.0.1:443/version?timeout=32s": dial tcp 127.0.0.1:443: connect: connection refused
Refer to the troubleshooting guide for more information: https://kubernetes.github.io/ingress-nginx/troubleshooting/
goroutine 1 [running]:
k8s.io/klog/v2.stacks(0xc00000e001, 0xc0004fc6c0, 0x1cd, 0x228)
        k8s.io/klog/v2@v2.3.0/klog.go:996 +0xb9
k8s.io/klog/v2.(*loggingT).output(0x28fb700, 0xc000000003, 0x0, 0x0, 0xc000344770, 0x28499eb, 0x7, 0x126, 0x0)
        k8s.io/klog/v2@v2.3.0/klog.go:945 +0x191
k8s.io/klog/v2.(*loggingT).printf(0x28fb700, 0x3, 0x0, 0x0, 0x1c19509, 0x13f, 0xc00009ff08, 0x1, 0x1)
k8s.io/klog/v2@v2.3.0/klog.go:733 +0x17aA good representative sample should contain different candidates for ingestion - lines with timestamps and columns, multi-line entries, empty lines, etc. The more different log lines will be covered with pipeline tests, the higher support level will be achieved and more logs will be consumed successfully.
The test-error-raw.log-config.yml file enables extra features which can change behavior of the test runner:
multiline:
  first_line_pattern: "^[A-Z]{1}[0-9]{4} "
fields:
  event.timezone: "GMT+1"
  "@timestamp": "2020-12-16T11:39:15.954Z"
  tags:
    - preserve_original_event
dynamic_fields:
event.ingested: ".*"For example it can define a first_line_pattern for multiline logs, additional fields to be added to input logs or mark some fields to be dynamic (can't be statically asserted).
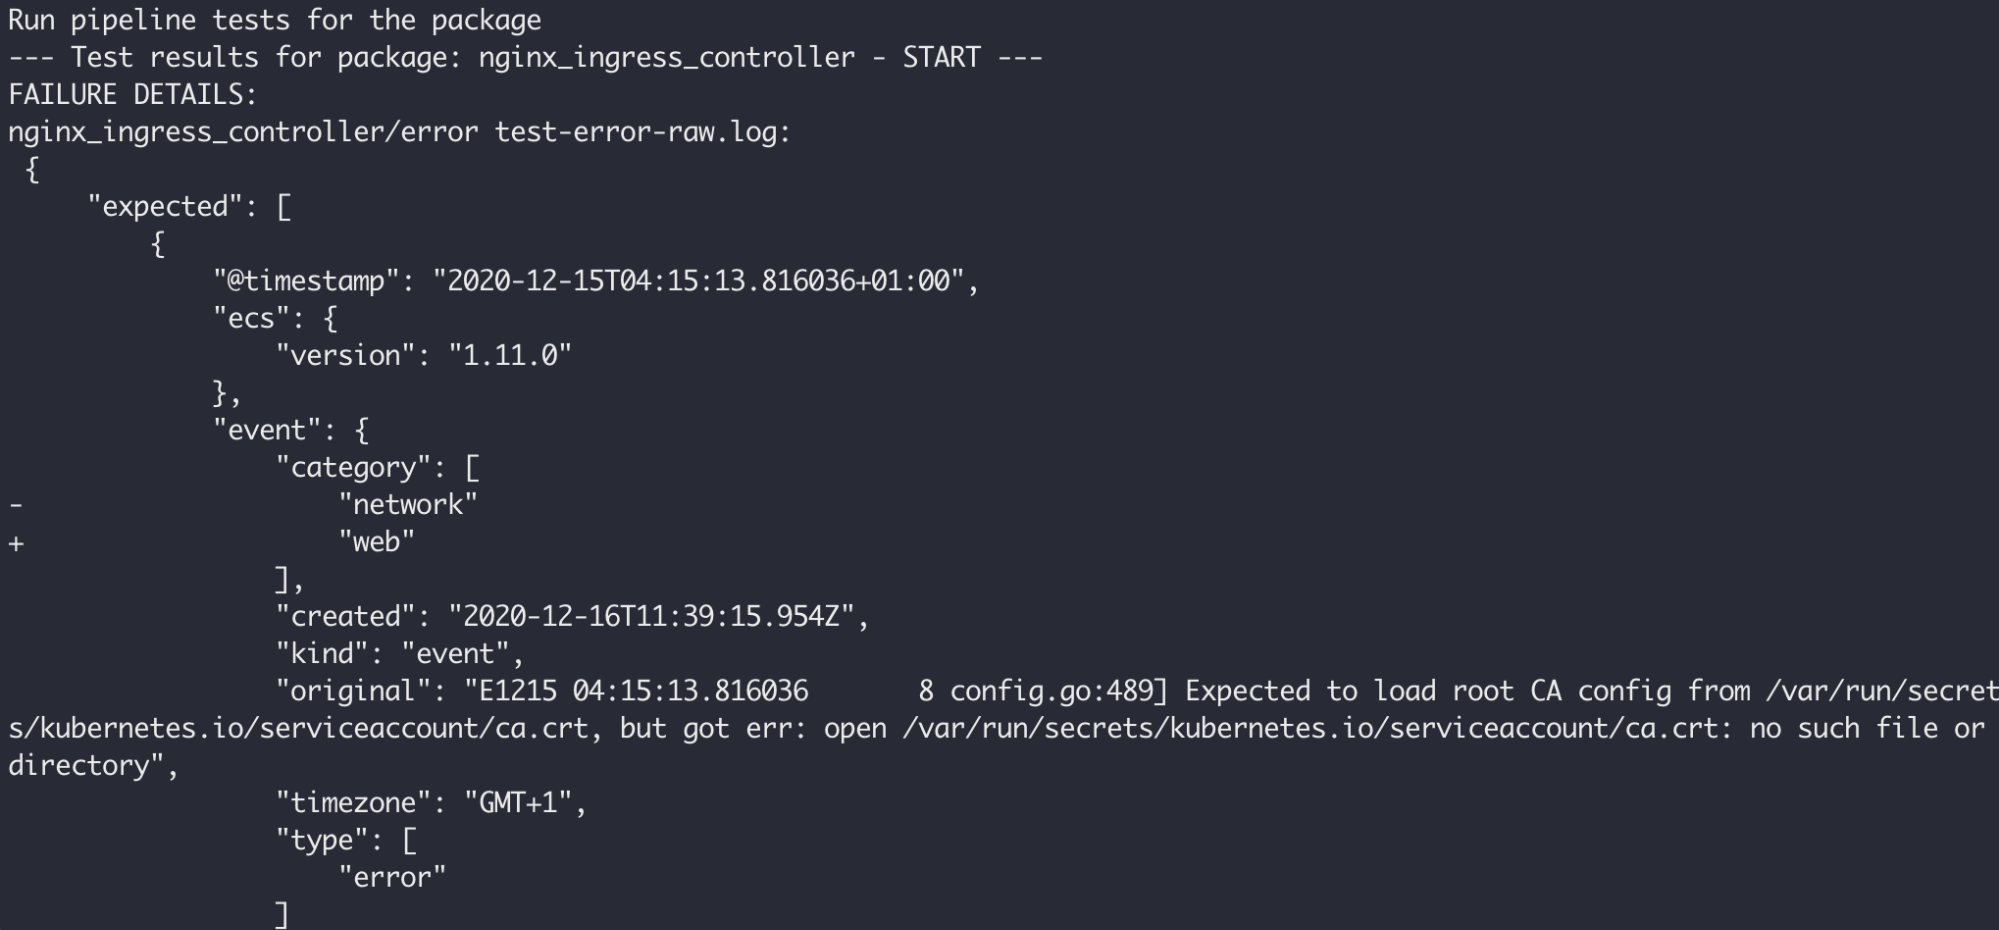
The last and mandatory file, test-error-raw.log-expected.json, stores expected results for a single pipeline test. The content of the file reflects documents to be collected and stored in Elasticsearch once is processed by an ingest pipeline:
{
    "expected": [
        {
            "nginx_ingress_controller": {
                "error": {
                    "thread_id": 8,
                    "source": {
                        "line_number": 489,
                        "file": "config.go"
                    }
                }
            },
            "@timestamp": "2020-12-15T04:15:13.816036+01:00",
            "ecs": {
                "version": "1.11.0"
            },
            "log": {
                "level": "E"
            },
            "message": "Expected to load root CA config from /var/run/secrets/kubernetes.io/serviceaccount/ca.crt, but got err: open /var/run/secrets/kubernetes.io/serviceaccount/ca.crt: no such file or directory",
            "event": {
                "ingested": "2021-06-09T12:42:49.083062900Z",
                "original": "E1215 04:15:13.816036       8 config.go:489] Expected to load root CA config from /var/run/secrets/kubernetes.io/serviceaccount/ca.crt, but got err: open /var/run/secrets/kubernetes.io/serviceaccount/ca.crt: no such file or directory",
                "timezone": "GMT+1",
                "created": "2020-12-16T11:39:15.954Z",
                "kind": "event",
"category": [It's advised to store both, input logs and expected results, under the version control system as the output of pipeline tests is represented in a form of diff:
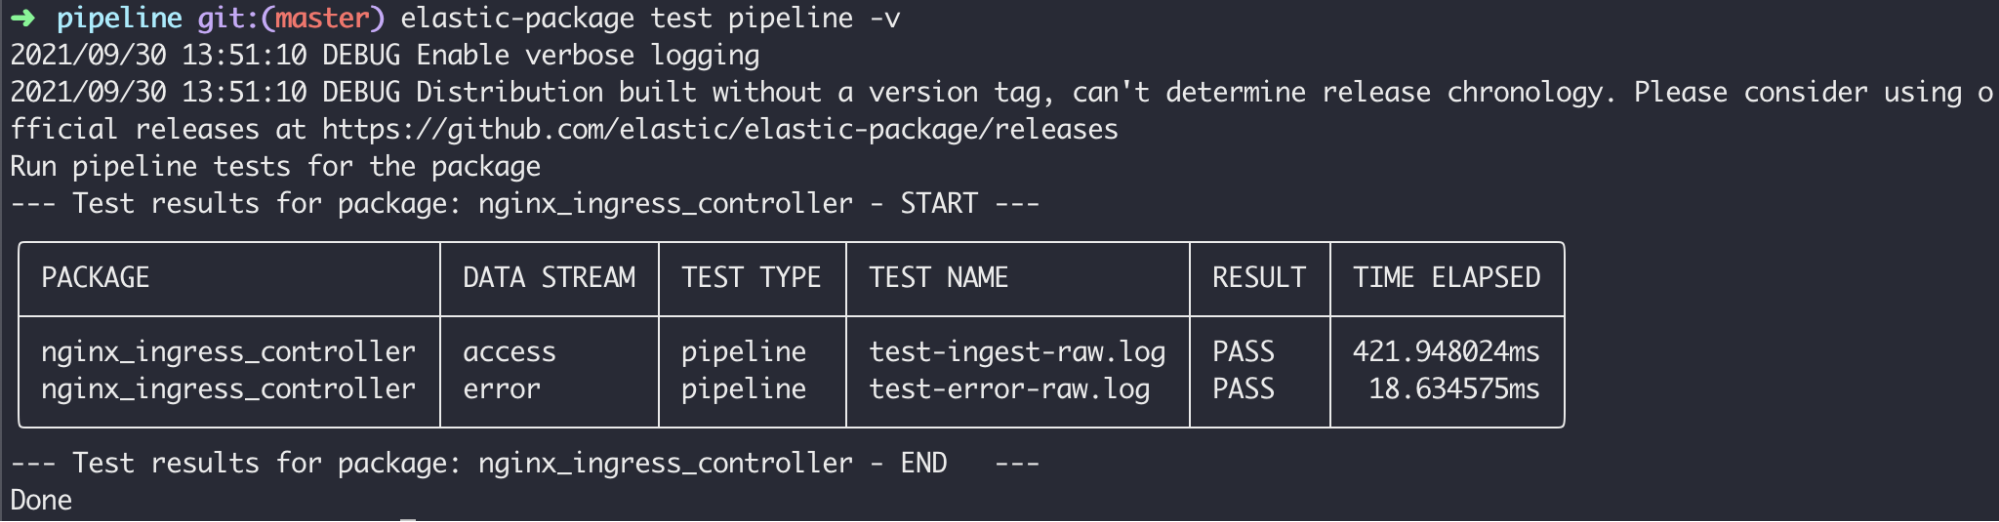
Pipeline testing can be performed with the following command (verbose mode):
elastic-package test pipeline -vHere is the sample output of pipeline tests running for NGINX Ingress Controller:
Static tests: make sure that static files are correct
The intention of static tests is verification of files not necessarily related with ingestion logic, but important from the user perspective.
At the moment of writing (September 2021) static tests involve the field validator to check if sample event files (sample_event.json) don’t expose any undocumented or incorrectly typed fields, which may confuse integration users. Field definitions are stored in data streams in fields directory (see the MongoDB integration below):
find . -name fields
./data_stream/metrics/fields
./data_stream/dbstats/fields
./data_stream/collstats/fields
./data_stream/status/fields
./data_stream/replstatus/fields
./data_stream/log/fieldsStatic testing can be performed with the following command (verbose mode):
elastic-package test static -v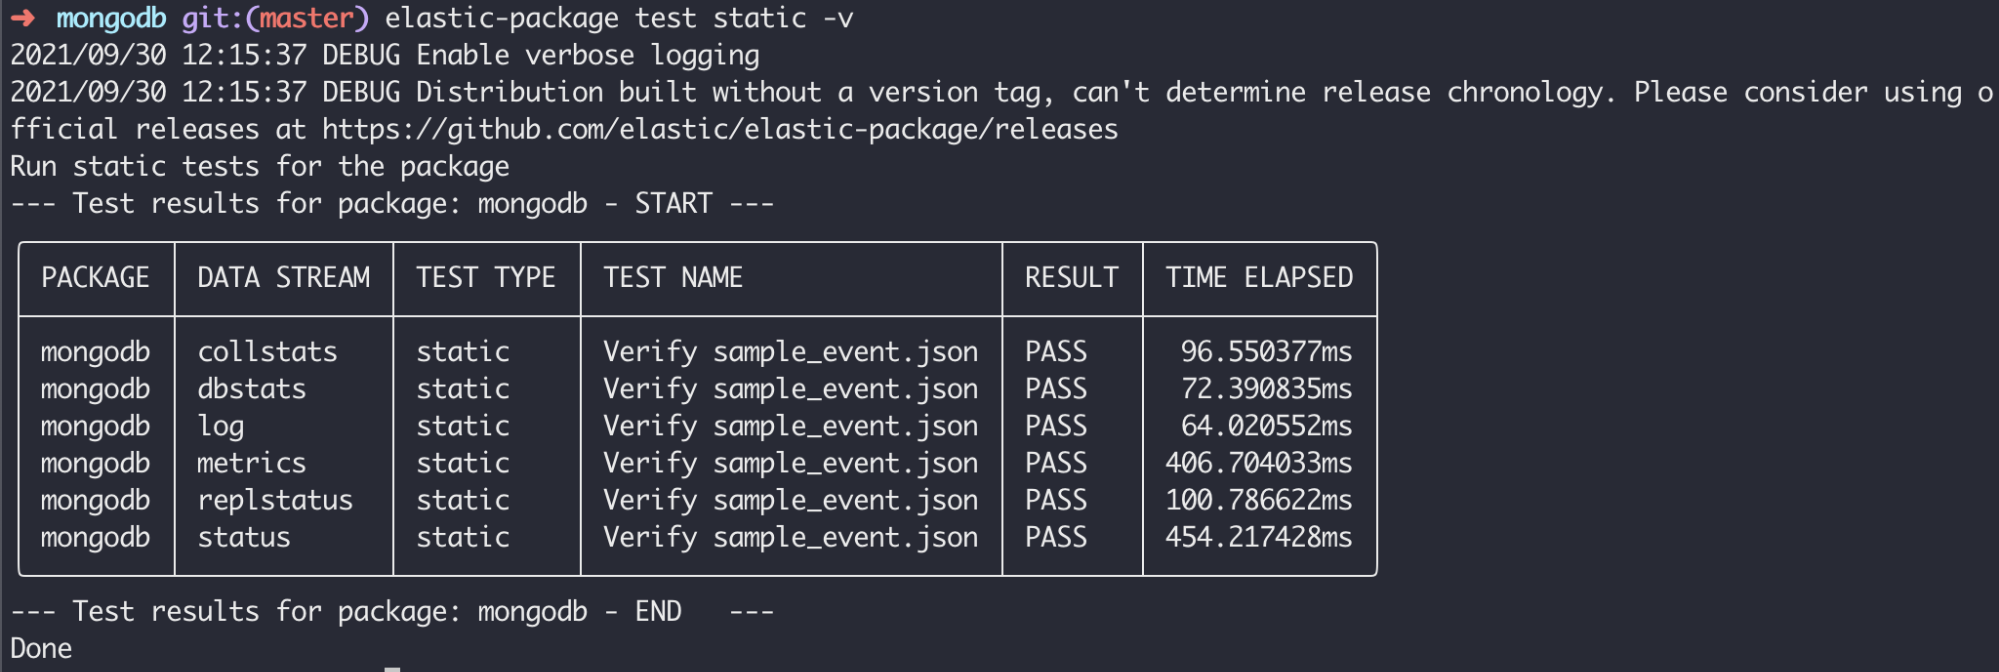
In this use case the test runner executed a set of static tests against all data streams defined in the MongoDB integration. It verified all sample_events.json files that were saved using --generate flag of the test system command.
System tests: check data collection of the integration against a real service or product
System tests are the most complicated ones compared with other available testing methods and they take time and resources to execute. The test runner simulates steps a real developer would do to enable an integration and collect data. It requires the entire Elastic stack to be up and running and connects a real service (dockerized) to the Docker stack network.
The system test runner supports different kinds of observed services. The basic one is a standard Docker Compose service defined in _dev/deploy/docker, which runs one or two Docker containers. A good candidate for Docker service is NGINX web server exposing HTTP endpoints and healthcheck.
Another kind is a Kubernetes deployment - the application is described using YAML definition files in _dev/deploy/k8s and installed by the test runner using kubectl. Apart from the Elastic stack it requires a kind cluster to be up and running. This service deployer is recommended for services deployed in the Kubernetes cluster or internal Kubernetes applications.
There are integrations that monitor cloud services that can’t be dockerized by design (e.g DynamoDB, Amazon S3) and mocking won’t give best results. For such cases the way to go is the Terraform service deployer, which can read .tf files from _dev/deploy/tf and use Terraform to apply changes.
The system test lifecycle starts with booting up observed services and waiting until it becomes healthy. Next, the system test runner assigns a new test policy to the Elastic Agent instance, based on the provided test configuration. Here is a basic configuration for the system test of the NGINX integration, stubstatus data stream:
data_stream/stubstatus/_dev/test/system/test-default-config.yml
vars:
 hosts:
   - http://{{Hostname}}:{{Port}}
data_stream:
 vars:
server_status_path: /server-statusThe sample configuration contains definitions for policy template's variables and data stream's variables. As you can see there are placeholders defined for the hosts variable, these will be replaced with the internal Docker endpoint (service host and port).
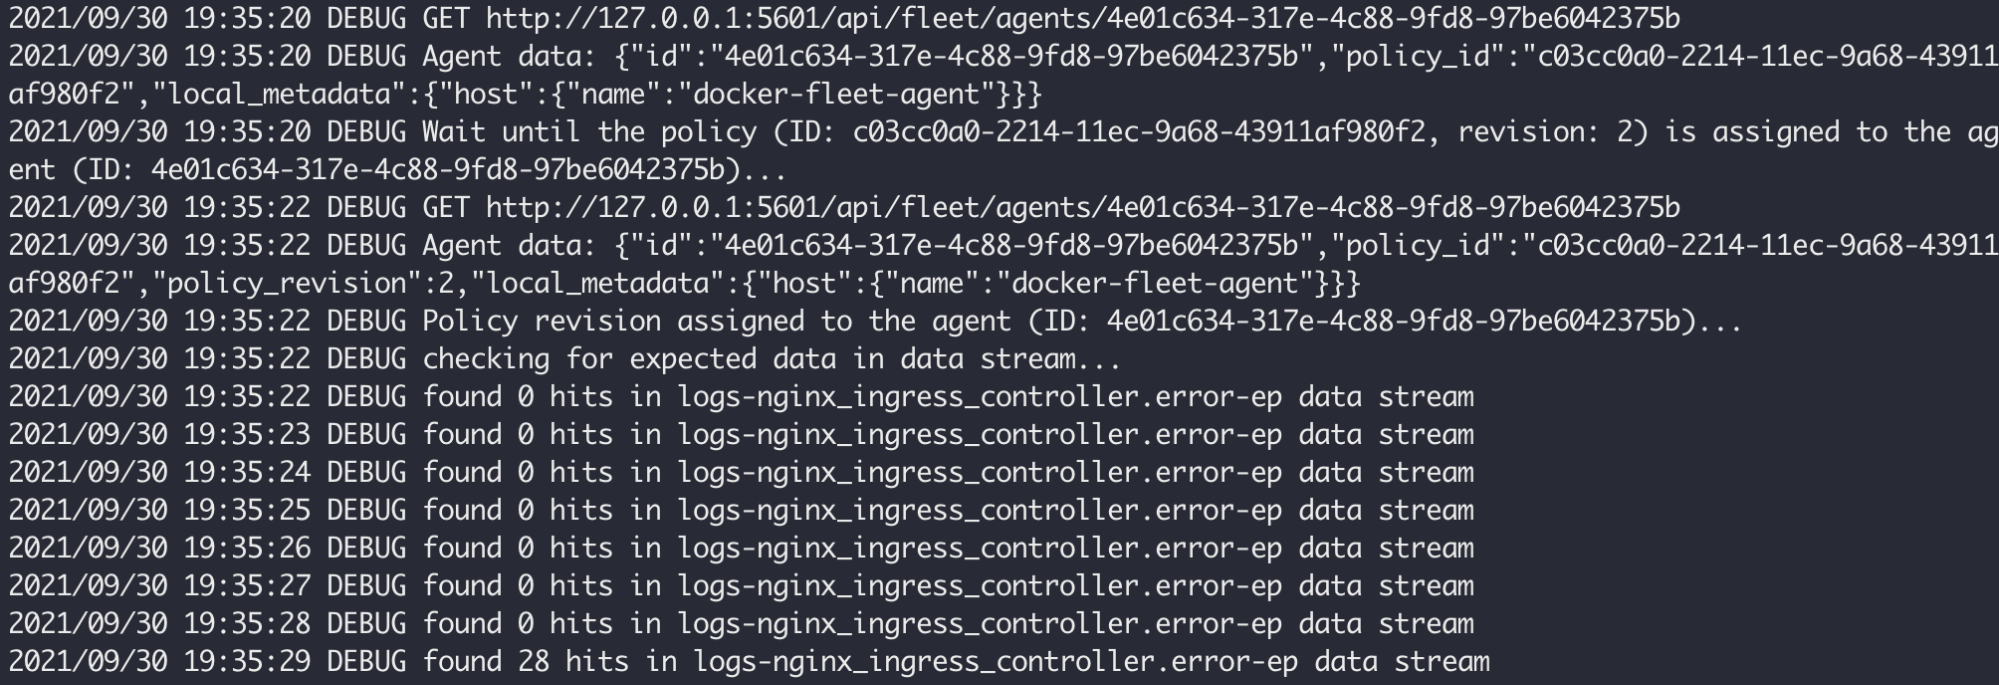
The test runner waits (and watches) until the agent instance picks up the policy and then starts observing the related data stream for new documents - this means that the agent collected some logs or metrics, optionally the ingest pipeline transformed them and data landed as documents in Elasticsearch.
The system test runner fetches the latest documents and runs static tests on them to make sure they are aligned with the field schema.
System testing can be performed with the following command (verbose mode):
elastic-package test system -v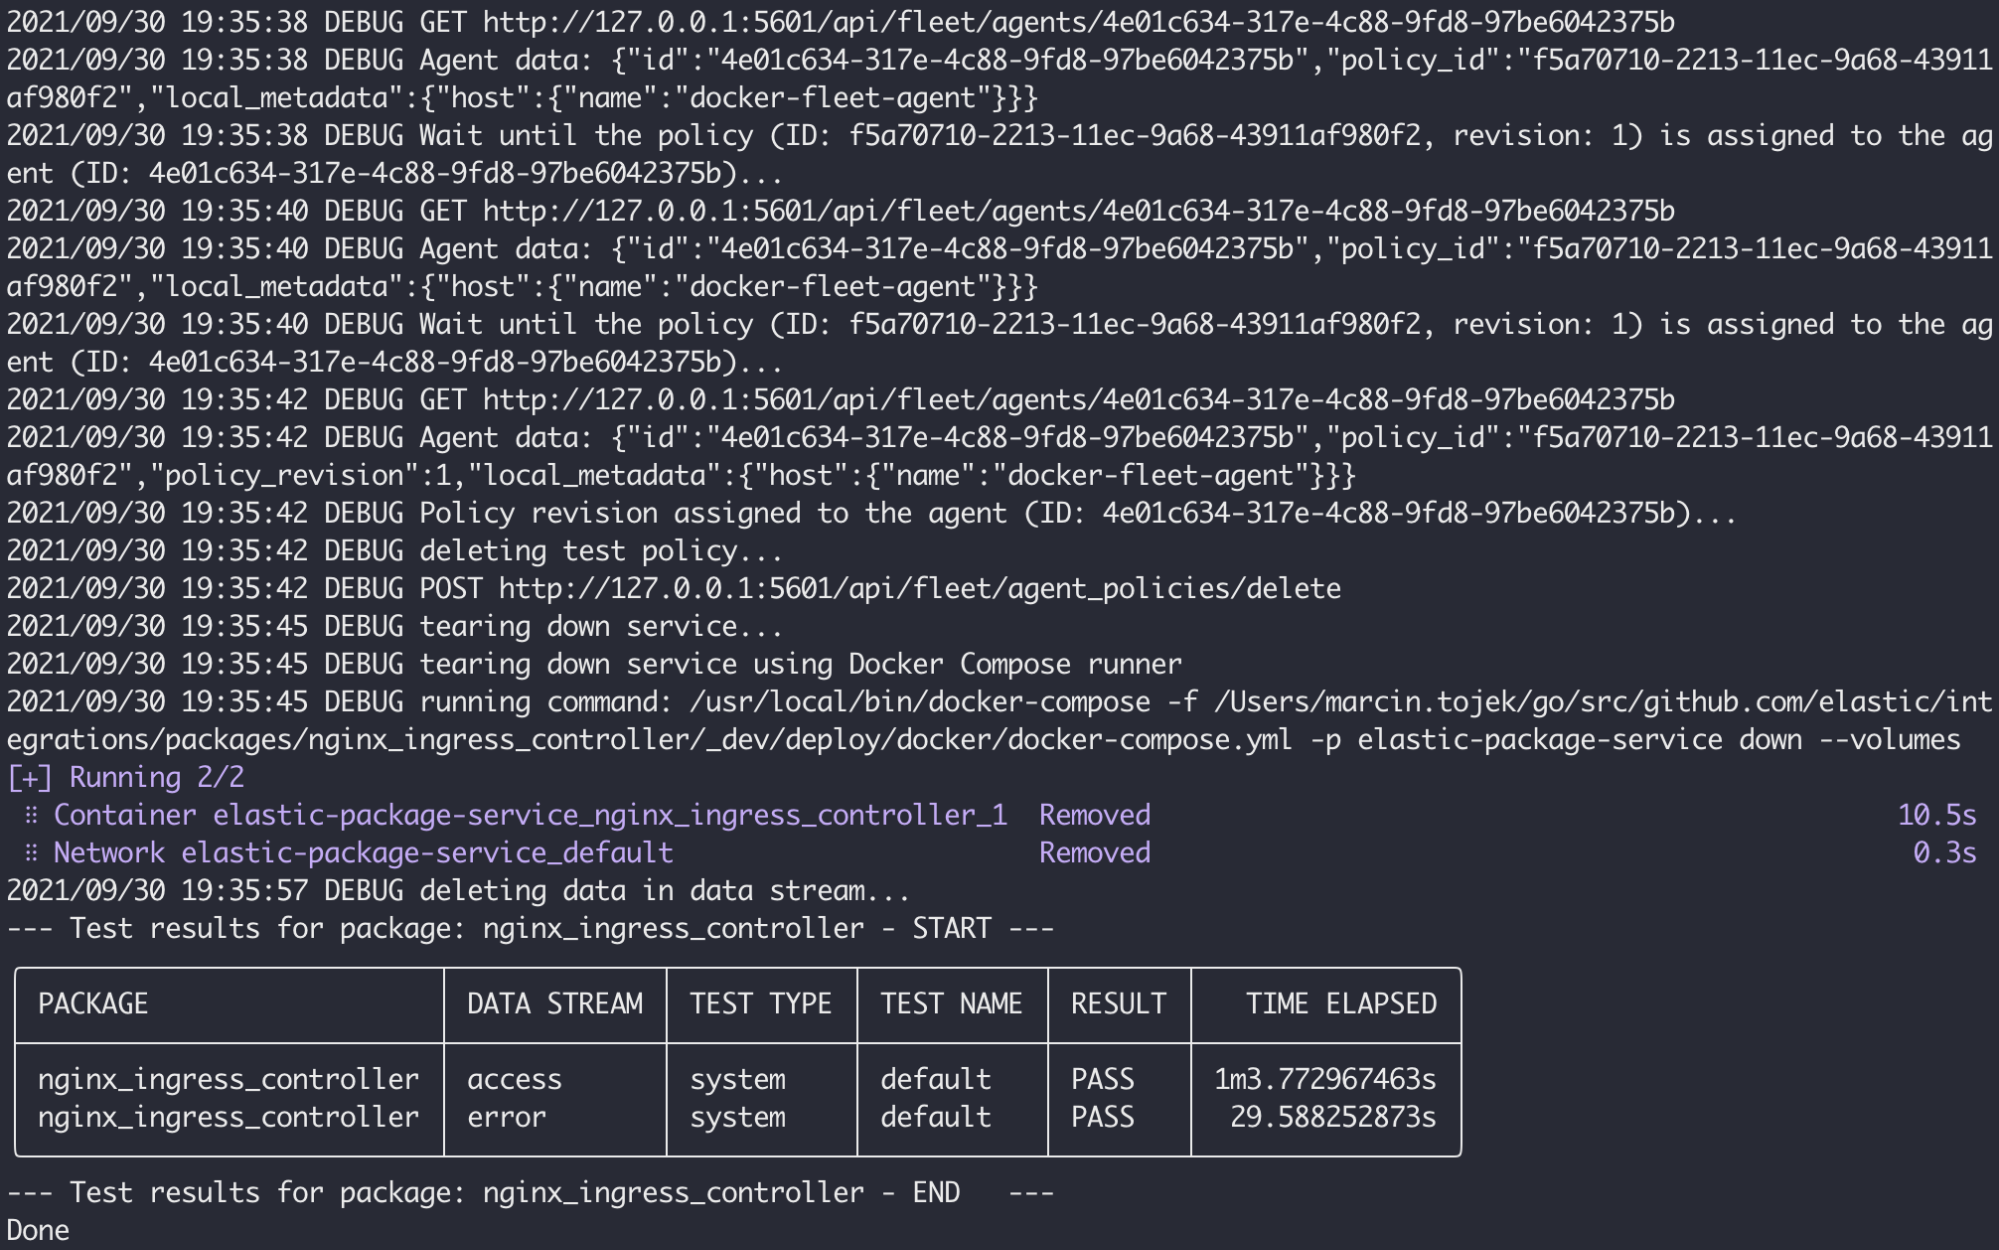
Keep in mind that it takes some time to run all system tests for all data streams if you have many ones or if the service container has long initialization. Nevertheless it's still a convenient testing method to adopt as it covers the entire end-to-end path of logs/metric data in Elastic Agent's based environments.
With described testing methods an Integration developer can cover multiple parts of a package including ingest pipelines, fields, config policies and Kibana saved objects. All these methods have been developed in the CI-friendly way and can be executed automatically without any human interaction (this is the way we run tests for Integrations in Elastic). Feel free to introduce more tests to your integrations and detect inconsistencies with an observed product as soon as possible.
Share
- Share on Twitter
Share on Twitter
- Share on LinkedIn
Share on LinkedIn
- Share on Facebook
Share on Facebook
- Share by Email
Share by Email
- Print this page
Print