Kudos: Empowering researchers with time series data and the Elastic Stack
Kudos provides a free platform that helps researchers take a more structured, evidence-based approach to communications. For research to have an impact, the people using it need to find it and understand it. This requires effective communication and reach beyond traditional academic activities such as publishing in journals and giving talks at specialist conferences. But researchers have limited time and expertise to reach these broader audiences or to provide evidence of their reach and engagement. Kudos fills that gap. We enable researchers to professionalise their communications — without needing a degree in marketing.
A key feature of Kudos allows you to create a page for your publication or project, explain it in plain language and then share it with ease. The metrics within Kudos show the views of your page and their relationship to your actions over time. For example, if you shared your Kudos publication page on Twitter, Facebook and LinkedIn, you could tell which of the channels provided the largest increase in page views.
Our original approach of using a MySQL database for events and time series data was reaching its limits given the amount of data we were processing, meaning that our visibility into the business workflows described by this data was limited and often required the engineering team time to extract.
In order to fix the deficiencies we noticed, we looked at alternative time series data stores. Here are some examples of questions we asked when searching for a new solution:
- How easy is it to scale if storage is low?
- Does the solution support metrics and events?
- Can metadata be associated with an event?
- Can the query mechanism aggregate data? Can it aggregate by date?
- How is the data sent to the time series data store? API? Log scraping? Multi language clients?
- How large and active is the community? If I have a problem will I be able to find someone to help me solve it?
- How can the data from the time series data store be visualised?
We ended up choosing the Elastic Stack, as it seemed to fit our data needs very well. Each event could be a document inside an index, with a set of data representing its entity and metadata. Also, the aggregations that we needed to do were well supported and one of the core features. The rest of the Elastic Stack also seemed a good fit for our needs: Kibana provided easy-to-use visualisation of the data and Logstash provided us with an out-of-the-box method of ingesting the data.
Once we had settled on using the Elastic Stack, the final question was hosting and cost. As we’re a small team, we wanted minimal ops work, preferably a hosted system, and at a reasonable cost. There were a couple options:
- Use Elasticsearch on AWS. This option eased the creation of a cluster but we were concerned that we may still need to manage and monitor EC2 machines, especially at upgrade time. At the time of our decision it was also not clear whether features such as security and monitoring were included.
- Use Elastic’s own hosted Elasticsearch Service on Elastic Cloud. This option provided the least operational interaction at a slightly higher cost. However, the versions of the Elastic Stack are always the latest and it’s very easy to start small, at a lower cost, and scale up.
We decided to use the Elasticsearch Service on Elastic Cloud. For a small team the reduced operational overhead was the key factor. Being able to scale the cluster up and down, or install the latest version of Elasticsearch, with just a couple of clicks on the Elastic Cloud UI saved us a huge amount of time in both learning and maintaining the system. We began by trialing the service on a small cluster with a small amount of data. This gave us a very small cost to get started and allowed us to come to grips with the system before scaling up.
Implementation
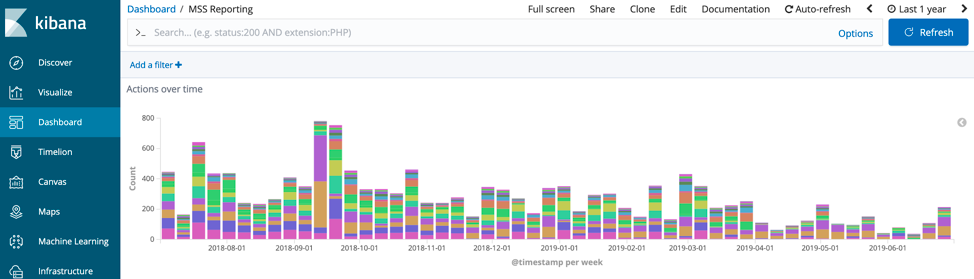
The first feature that we implemented using the Elastic Stack was to integrate with publisher Manuscript Submission Systems. This enables authors to describe their research in plain language at the time of submission of their manuscript, directly from the submission system, rather than waiting for publication and doing it from the Kudos website. This involved ingesting data feeds of those manuscripts and their plain language summaries from publishers’ Manuscript Submission Systems and processing that data over its journey to publication, which can take months. The ingestion pipeline sends events at each of the key moments of that journey, e.g., received, ID assigned, published etc. These events are sent via Google Pubsub and ingested into Elasticsearch via Logstash running on Kubernetes. We were quickly able to create a set of dashboards for the engineering team to see the flow of events over time using the Kibana visualisation builder.
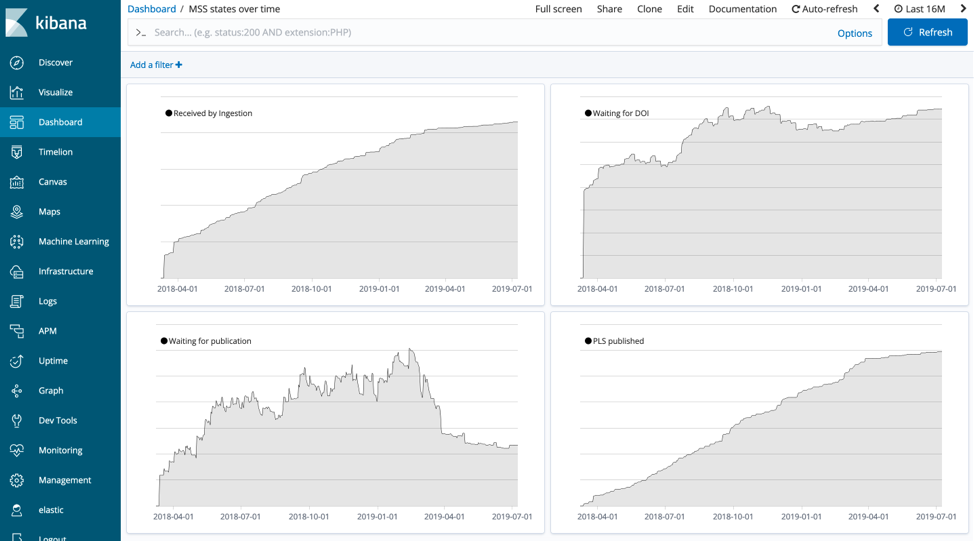
One of the key requirements was to provide visibility into how many articles are in a given state at any point in time. To do this, we count the number of events sent for a point in the workflow and subtract them from the events adjacent in the workflow. For example, we have an event called "waiting for an id," which is sent once we have processed an article, and the next event in the workflow is "id received," which is sent once the publication has been assigned an id by the publisher. To plot this difference we used Timelion to subtract the two time series. The Timelion expression looks like this:
.es(index=reporting-*, metric=count, q='action:wait_for_id').cusum()
.subtract(.es(index=reporting-*, metric=count, q='action:id_received').cusum())
.label('Waiting for id').color(#000).lines(fill=1,width=0.5)
So, looking at the Timelion series over the total time that the system has been running provides a chart of the number of articles in that state.
The Kibana dashboards have proved effective not only for the engineering team but also for account management. The account management team use a dashboard to provide our customers with insights using aggregations to roll up the events to higher level KPIs. Previously we created bespoke reports with SQL but even after the initial engineering work this often required tweaking for different scenarios, creating more engineering work. The Kibana dashboards allowed us to provide an amount of flexibility to the account management team to allow them to explore the data, and any new requests for charts were created within minutes using the visualisation editor.
Summary
The Elastic Stack has performed well and, as we have ramped up our usage, it was trivial to increase the cluster size on Elasticsearch Service. Kibana has been great for the visualisations that we need, and it’s been easy to explore the data. All in all, the team has been very happy with how it’s gone, and we’d recommend trying out Elasticsearch for your time series use cases.
If you'd like to discover more about the Kudos Engineering team then take a look at our blog.

James Bloomer is CTO of Kudos. He has many years experience in architecture, design, development and leading teams. Some of the interesting products he has worked on include CRM systems for banks, a CMS site for a world rally team and a product that processed the Twitter and Facebook firehoses. He has a PhD in Particle Physics, having worked at CERN, but has forgotten more physics than most people ever learn.