Maximize IT efficiency leveraging alert management with Elastic AI Assistant for Observability
Manage and correlate signals and alerts in Elastic Observability


 Share on Twitter
Share on Twitter

 Share on LinkedIn
Share on LinkedIn

 Share on Facebook
Share on Facebook

 Share by Email
Share by Email

 Print this page
Print
As organizations embrace increasingly complex and interconnected IT systems, the sheer volume of alerts generated by diverse monitoring tools has given rise to a critical challenge — how do we efficiently sift through the noise to identify and respond to the most crucial issues?
Event management and correlation are two indispensable pillars in the realm of IT service management. This technical blog delves into the intricacies of why these practices are not just desirable but downright essential when it comes to maintaining the health, security, and performance of digital infrastructure and services. It also analyzes how generative AI can support this discipline.
Event management: Bringing order to chaos
Event management steps in as the first line of defense. This practice involves systematic collection, analysis, and categorization of alerts from various monitoring sources. Rather than drowning in an endless sea of notifications, IT professionals can gain a structured view of the alerts landscape. This enables them to discern the critical signals from the noise and focus their attention on higher-value activities.
Event correlation: Unveiling the bigger picture
But what happens when seemingly disparate events are pieces of a larger puzzle? This is where correlation takes center stage. Correlation provides a holistic understanding of the underlying issues by identifying relationships and dependencies between different events. It's not just about reacting to individual alerts; it's about comprehending how they interconnect and impact the entire system.
The proactive advantage: Predictive insights through event management and correlation
Beyond mere incident response, event management and correlation offer a proactive advantage. Analyzing historical data for patterns and trends empowers IT teams to anticipate potential issues before they escalate into critical problems. This predictive capability minimizes downtime and enhances the overall reliability of the system.
Automation: Accelerating and enhancing response
In our journey through the intricacies of event management and correlation, we'll explore the pivotal role of automation. Intelligent tools like Elastic® that autonomously analyze, correlate, and prioritize events accelerate mean time to resolution (MTTR) and free up valuable human resources for more strategic tasks.
Join us as we go through the layers of event management and correlation, examining their technical nuances and real-world applications. From efficient incident detection to comprehensive issue resolution, these practices are not just about managing alerts — they're about fortifying the resilience and performance of IT infrastructures in the face of modern challenges.
The layers of event management
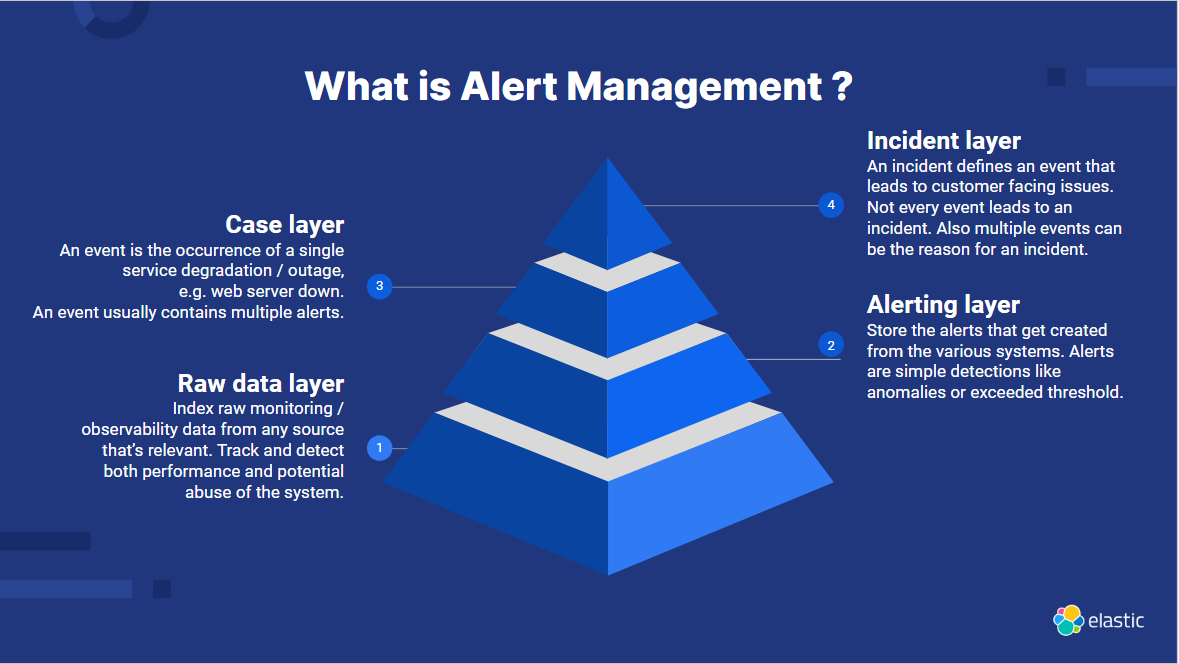
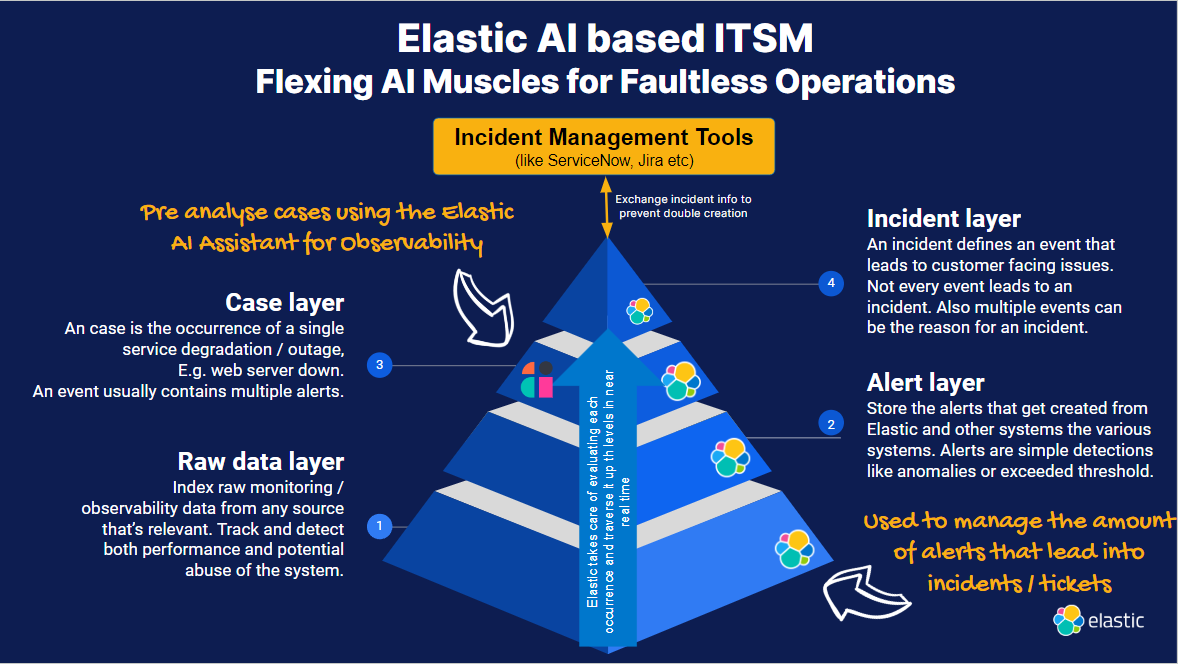
To tackle the complexities of event management, it's crucial to understand how data evolves throughout the process and its role in managing and correlating events.
To begin, we collect data from a multitude of sources, a task Elastic is adept at handling with its robust capabilities for integrating new data streams. Ideally, there should be some commonalities between these data sets — for instance, how one event, such as too high CPU usage, is also relevant in another data set, perhaps through delayed response times. This overlap allows us to establish a causal relationship — high CPU usage may be the culprit behind slowed application performance.
Moving on, we leverage Elastic to transform this granular monitoring data into actionable alerts, such as notifications for anomalously long response times for a specific application or excessive CPU loading in particular containers or virtual machines. Initially, each alert operates in isolation.
The next phase in event management and correlation is providing additional context to these isolated alerts, seeking to uncover any interconnections among them. The goal is to enable the system to group alerts likely stemming from a similar source. This crucial task is handled at the event layer, where we employ Elastic Case Management to combine related alerts into a single case, illuminating the potential correlations.
Lastly, at the incident layer, we define what qualifies an event to be escalated to an incident status. This involves considering various factors, such as scheduled maintenance windows. For example, if an alert corresponds to a period when system downtime is planned, we may disregard the event. This discernment ensures the efficient allocation of resources to the events that truly warrant attention.
Elastic is a comprehensive solution adept at managing each layer of alert management with a suite of features tailored to support the entire spectrum. In a seamless operation, certain functionalities fully automate the process.
Take, for instance, Elastic’s capability to generate every conceivable alert tied to a particular service or metric. It's a powerful feature, no doubt. Moreover, Elastic is informed about the interconnections between the APM-monitored services, thanks to its distributed tracing feature.
This knowledge about service dependencies is invaluable, and Elastic capitalizes on it. It harnesses this data, combining it with other relevant information using its graph capability to effectuate sophisticated correlation analyses.Moreover, Elastic can generate alerts and effectively monitor and manage these alerts at the level of events or Kibana cases. This ensures streamlined handling of the alerts, tying them to broader incident patterns and overarching case management frameworks, facilitating a comprehensive oversight of the entire event management pipeline.
How does it all play together?
Nevertheless, effectively matching and updating the relevant alerts with their respective cases based on dependency data requires a layer of automation logic. Within the Elastic Stack, this automation is orchestrated by Watcher. Acting as a central controller, Watcher harmonizes the collation of information, aligning it with our predefined criteria. Of course this job can also be done by Python scripts that run next to Elastic and use its APIs.
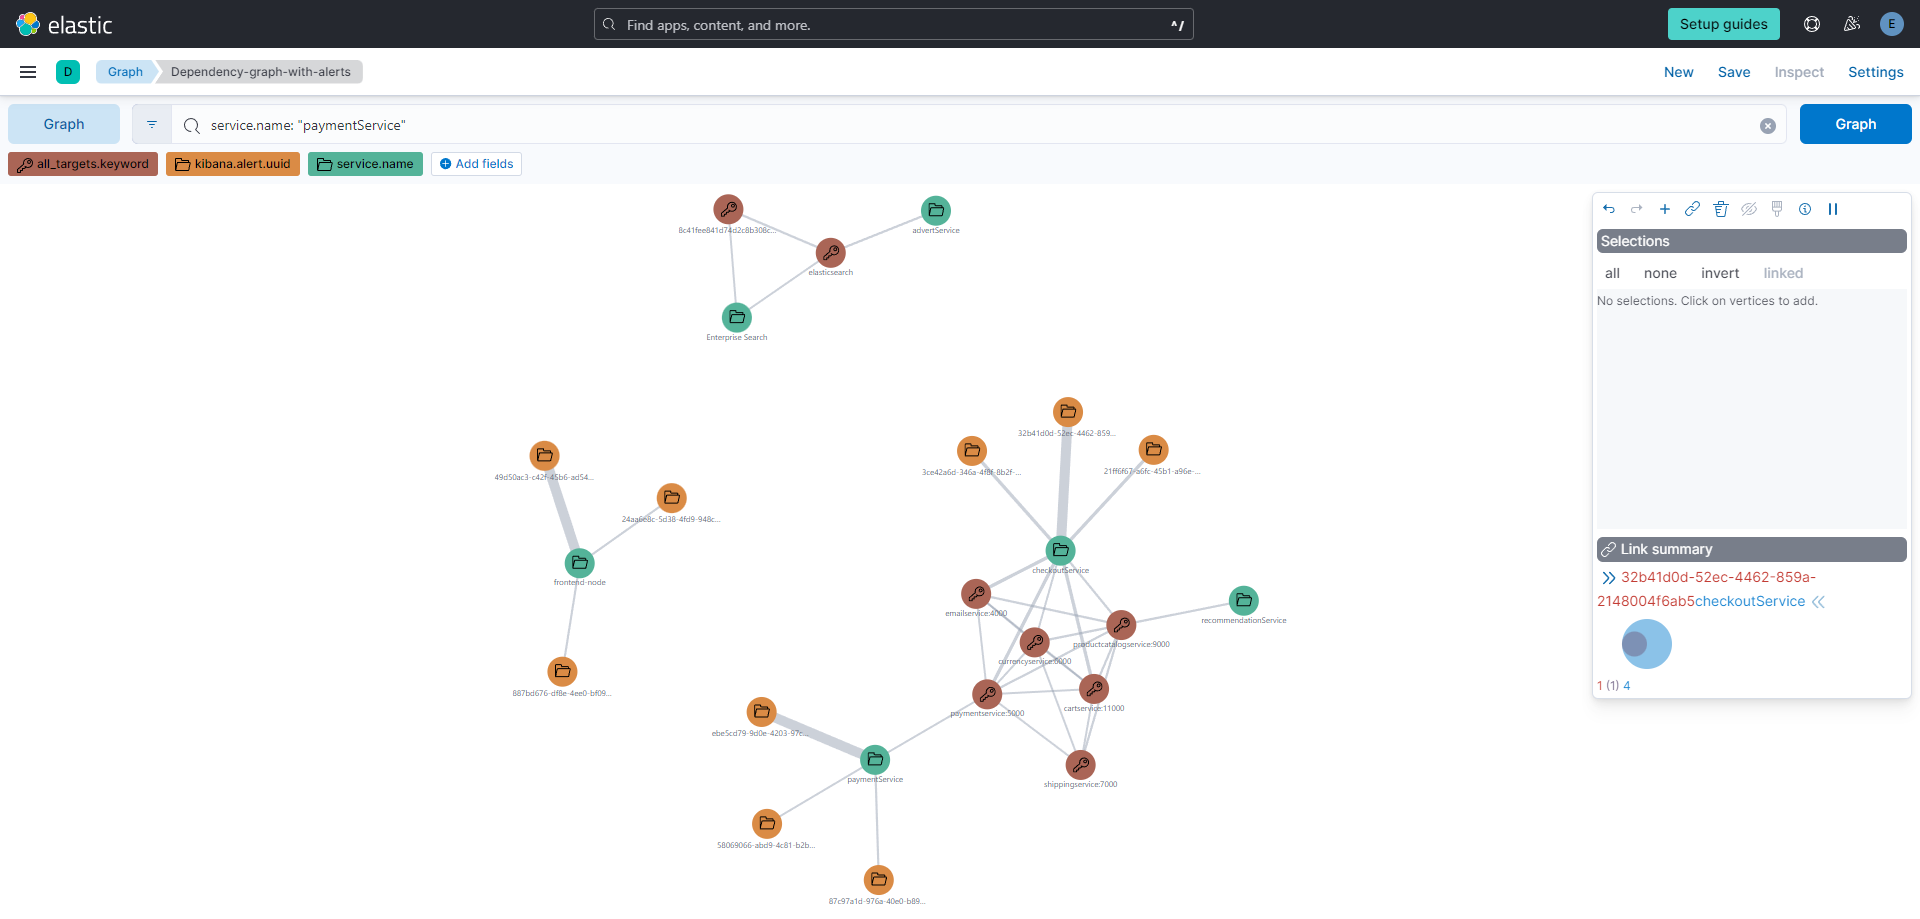
The power of graph API in visualizing connections is evident in the way it represents dependencies. Consider, for instance, a visual graph that encapsulates the dependencies among APM services. The graph API assembles this data, correlating each alert with the service it pertains to and reflecting these relationships visually. In the graph, alerts tied to a particular service are linked, forming a cluster. If there is no visual link between elements, it implies a lack of dependency among the alerts within the monitored ecosystem.
This becomes increasingly pivotal when Elastic monitors not just a single application or service but a large set of them. The ability to visually parse and understand these dependencies at a glance equips teams with the insight to manage and respond to alerts in a system-wide context, ensuring a coherent approach to alert management across the entire application landscape.
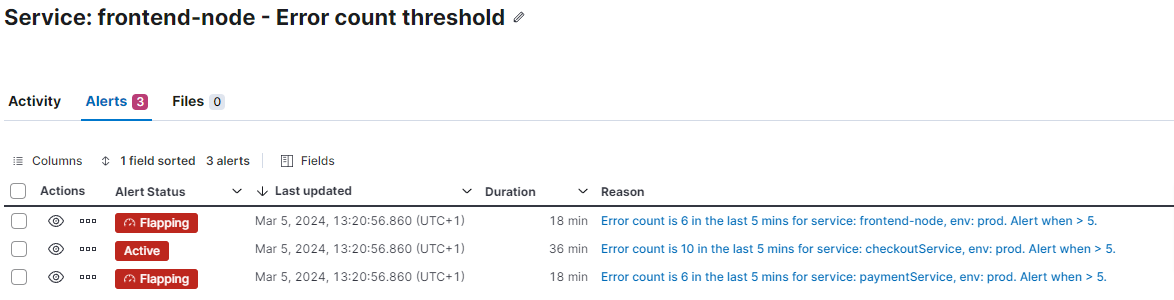
This integration culminates in aggregating related alerts within a single case in Kibana®'s Case Management system. As these alerts are associated with a case, we enhance the case with a comment encapsulating the principal details of each alert. This comment acts as a synopsis, providing a detailed yet concise understanding of the alert's core information within the case framework.
Generative AI-based analysis of automatically managed cases
Once all pertinent alerts have been combined within the case, we possess a rich data set ripe for deeper analysis. The case may contain an assortment of alerts, each seemingly disparate. The critical task at this juncture is to identify the root cause of these alerts — to pinpoint the primary issue from which others stem. Intuitively, one might attempt to determine the first alert. This approach may not always yield accurate results, given that alert rules operate on varying schedules and trigger at different intervals.
What is required, then, is a refined form of intelligence capable of discerning which alert most likely represents the origin of the issue. Such an ability would recognize patterns and probabilities for a more straightforward analysis.
This is where generative AI becomes a powerful ally. It represents the quintessential solution for this scenario, and with Elastic's AI Assistant for Observability, we have an advanced tool at our disposal. The Assistant employs generative AI to sift through the cluster of alerts, evaluate the complexities, and deduce the root cause with a high level of precision, transforming a daunting task into a manageable one. This helps users contextualize information orders of magnitude more quickly, helping them get to root causes, resolve the issue, and move on to the next set of alerts.
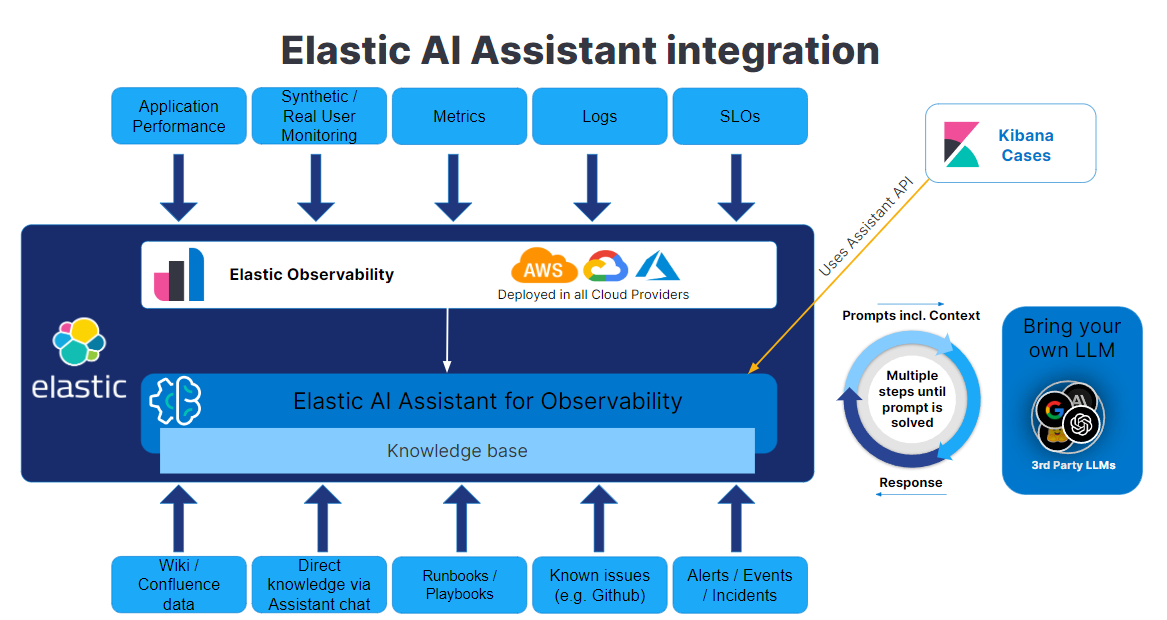
Let's demystify how the AI Assistant simplifies issue resolution. Imagine it as a digital detective with keys to every room in the Elasticsearch® database, capable of accessing any piece of data. However, its access can be tailored for security reasons through Elastic's different data access levels.
Beyond mere data retrieval, the Assistant has a knowledge base that can contain a playbook or reference guide or just documentation about the observed services. This knowledge base guides the Assistant's responses, helping it to determine the best approach to address the user's query. It assesses whether there is existing guidance or a method commemorated that could inform its analysis.
This knowledge base isn’t just a static repository; it’s dynamic. It can be updated manually or automatically fed by typical Elasticsearch data sources, such as Wikis, GitHub, or incident management systems.
On the one hand, the Assistant stands ready to scour through the entirety of observability data within Elasticsearch autonomously. On the other hand, we have a case brimming with high-level issue data yearning for analysis. Uniting these two — data and the Assistant — into a singular workflow empowers observability engineers to trace the root causes of issues more rapidly and work toward minimizing the MTTR effectively. So, let's put this plan into action!
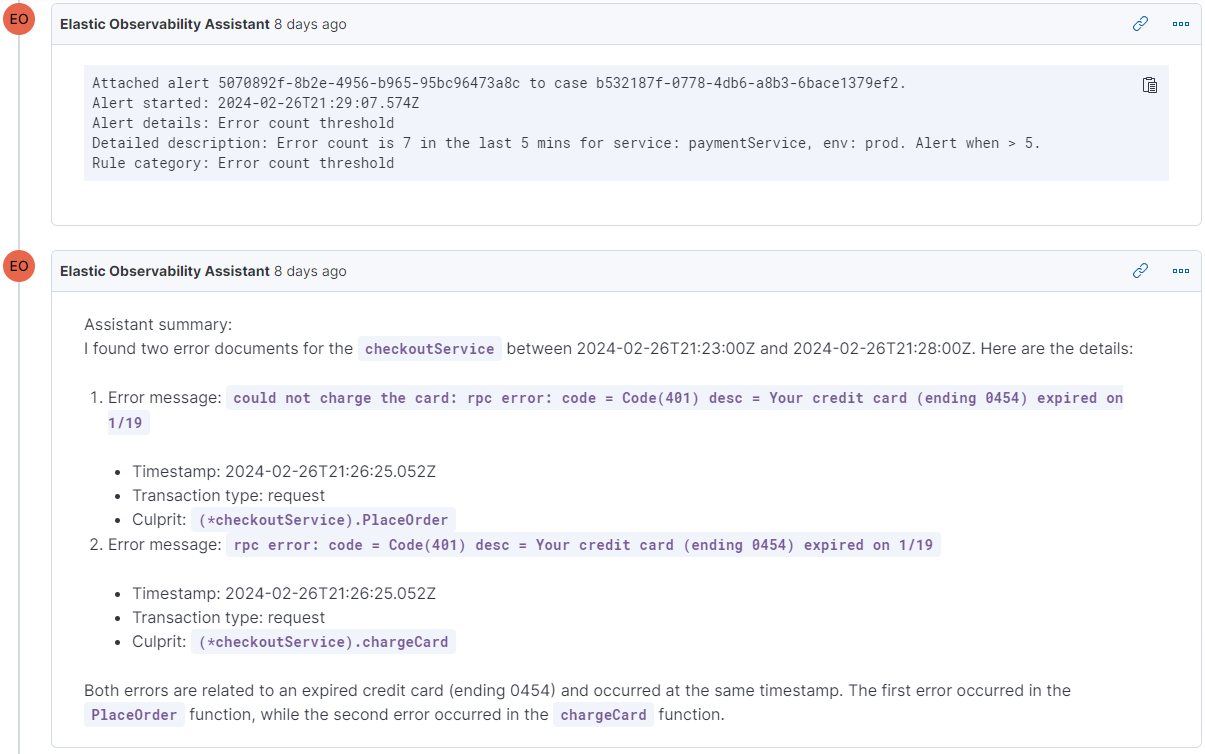
Looking at a snippet from the case, you'll notice how the assistant automatically grasps the case's current status and generates a synopsis of the discoveries. In this scenario, such an ability is enormously beneficial in dissecting the alert. While an alert might vaguely indicate a surge in error logs, the assistant supplies crucial context. This enriched insight swiftly directs us closer to the root cause or grants us enough information to promptly determine the next steps for resolving the case.
Rise above the noise: Overcoming alert fatigue
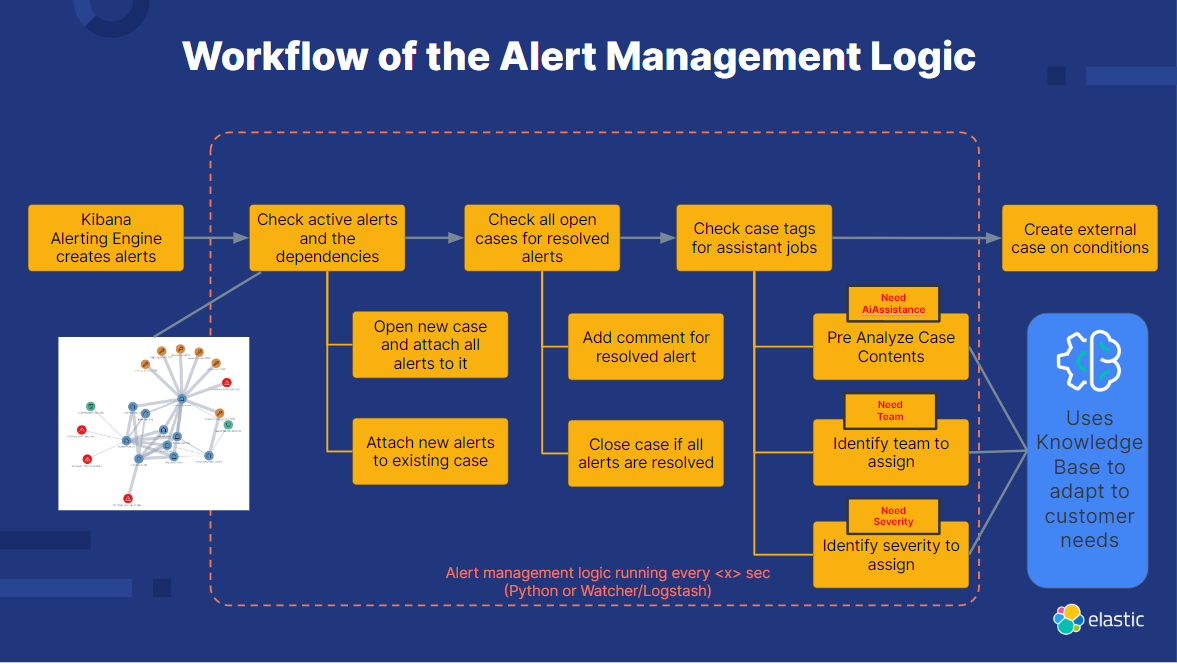
To encapsulate this blog's concept on the art of alert management, let's revisit the critical steps in the process. It all begins with Kibana generating alerts, each inherently linked to specific services, hosts, or other pieces of infrastructure. By analyzing the intricate web of data connections, we unearth dependencies that, in turn, help us craft comprehensive cases. As the lifecycle of each alert progresses — whether resolved or ongoing — this status is mirrored in its related case. A case may even automatically close once all associated alerts are cleared.
Our Assistant takes action when active cases contain a certain tag such as NeedAIAssistance, NeedTeam, or NeedSeverity to drive tailored actions. Depending on the tag present, the Assistant dynamically interacts with the data within Elastic, consulting the knowledge base and applying different prompts as needed to inform its analysis.
By adopting this model, we achieve a high degree of automation and repeatability in our fault management practices and maintain significant flexibility for the user.
Let’s draw the whole idea on a single slide. We have seen what event management and correlation is and that Elastic can help to traverse possible issues through the layers with its built-in features. We’ve also learned that the Assistant is able to summarize the information from a single case and provide deep insight without human interaction. It's even possible to assign the case and determine the right severity by leveraging the overarching knowledge of the LLMs.
Summarizing that, we can see that Elastic is able to fully prepare an incident ticket to reduce MTTR as much as possible. With the evolution of the AI Assistant, we will also be able to even execute remediation steps before any human even sees the issue.
To experience this innovative approach in your alert management routine, explore how Kibana and the Elastic AI Assistant for Observability can revolutionize your workflow. Get in contact with us and steer your operations toward smarter, efficient, and fatigue-free fault management.
See use cases for generative AI with the Elastic AI Assistant for Observability.
The release and timing of any features or functionality described in this post remain at Elastic's sole discretion. Any features or functionality not currently available may not be delivered on time or at all.
In this blog post, we may have used or referred to third party generative AI tools, which are owned and operated by their respective owners. Elastic does not have any control over the third party tools and we have no responsibility or liability for their content, operation or use, nor for any loss or damage that may arise from your use of such tools. Please exercise caution when using AI tools with personal, sensitive or confidential information. Any data you submit may be used for AI training or other purposes. There is no guarantee that information you provide will be kept secure or confidential. You should familiarize yourself with the privacy practices and terms of use of any generative AI tools prior to use.
Elastic, Elasticsearch, ESRE, Elasticsearch Relevance Engine and associated marks are trademarks, logos or registered trademarks of Elasticsearch N.V. in the United States and other countries. All other company and product names are trademarks, logos or registered trademarks of their respective owners.
Share
- Share on Twitter
Share on Twitter
- Share on LinkedIn
Share on LinkedIn
- Share on Facebook
Share on Facebook
- Share by Email
Share by Email
- Print this page
Print