

 Share on Twitter
Share on Twitter

 Share on LinkedIn
Share on LinkedIn

 Share on Facebook
Share on Facebook

 Share by Email
Share by Email

 Print this page
Print
An invaluable way to share best practices across your company, teams, and network is by sharing assets. We will present the export option of the elastic-package tool that will make your asset sharing as easy as ABC. In this guide you will walk through the elastic-package export option and learn about sharing and spreading useful dashboards.
Instead of reinventing the wheel, try to repurpose the work that has already been done. Some Kibana dashboards have already been created for you, but why not share yours as well.
Dashboard creation and export with elastic-package
To begin we will need to locally start a full elastic stack in order to access Kibana UI.
julienlind@MacBook-Pro elastic-package % elastic-package stack up -d -v“stack up” will start all needed containers, the -d option will let it run as a daemon process and the -v will allow verbose logging.
When everything is ready, you should be able to access your local Kibana at this url:
http://localhost:5601/login?next=%2F
(Username: elastic - Password: changeme)
Now it is time to create our own dashboard. As discovered in the blog post called Create your own integration We will enable ipfs node integration. (This integration is not mandatory, you can use any integration you want.)
Integrations can be enabled at the following address:
http://localhost:5601/app/integrations/browse
Now we will create our first dashboard.
Dashboard are available under Analytics/dashboard menu.
http://localhost:5601/app/dashboards#
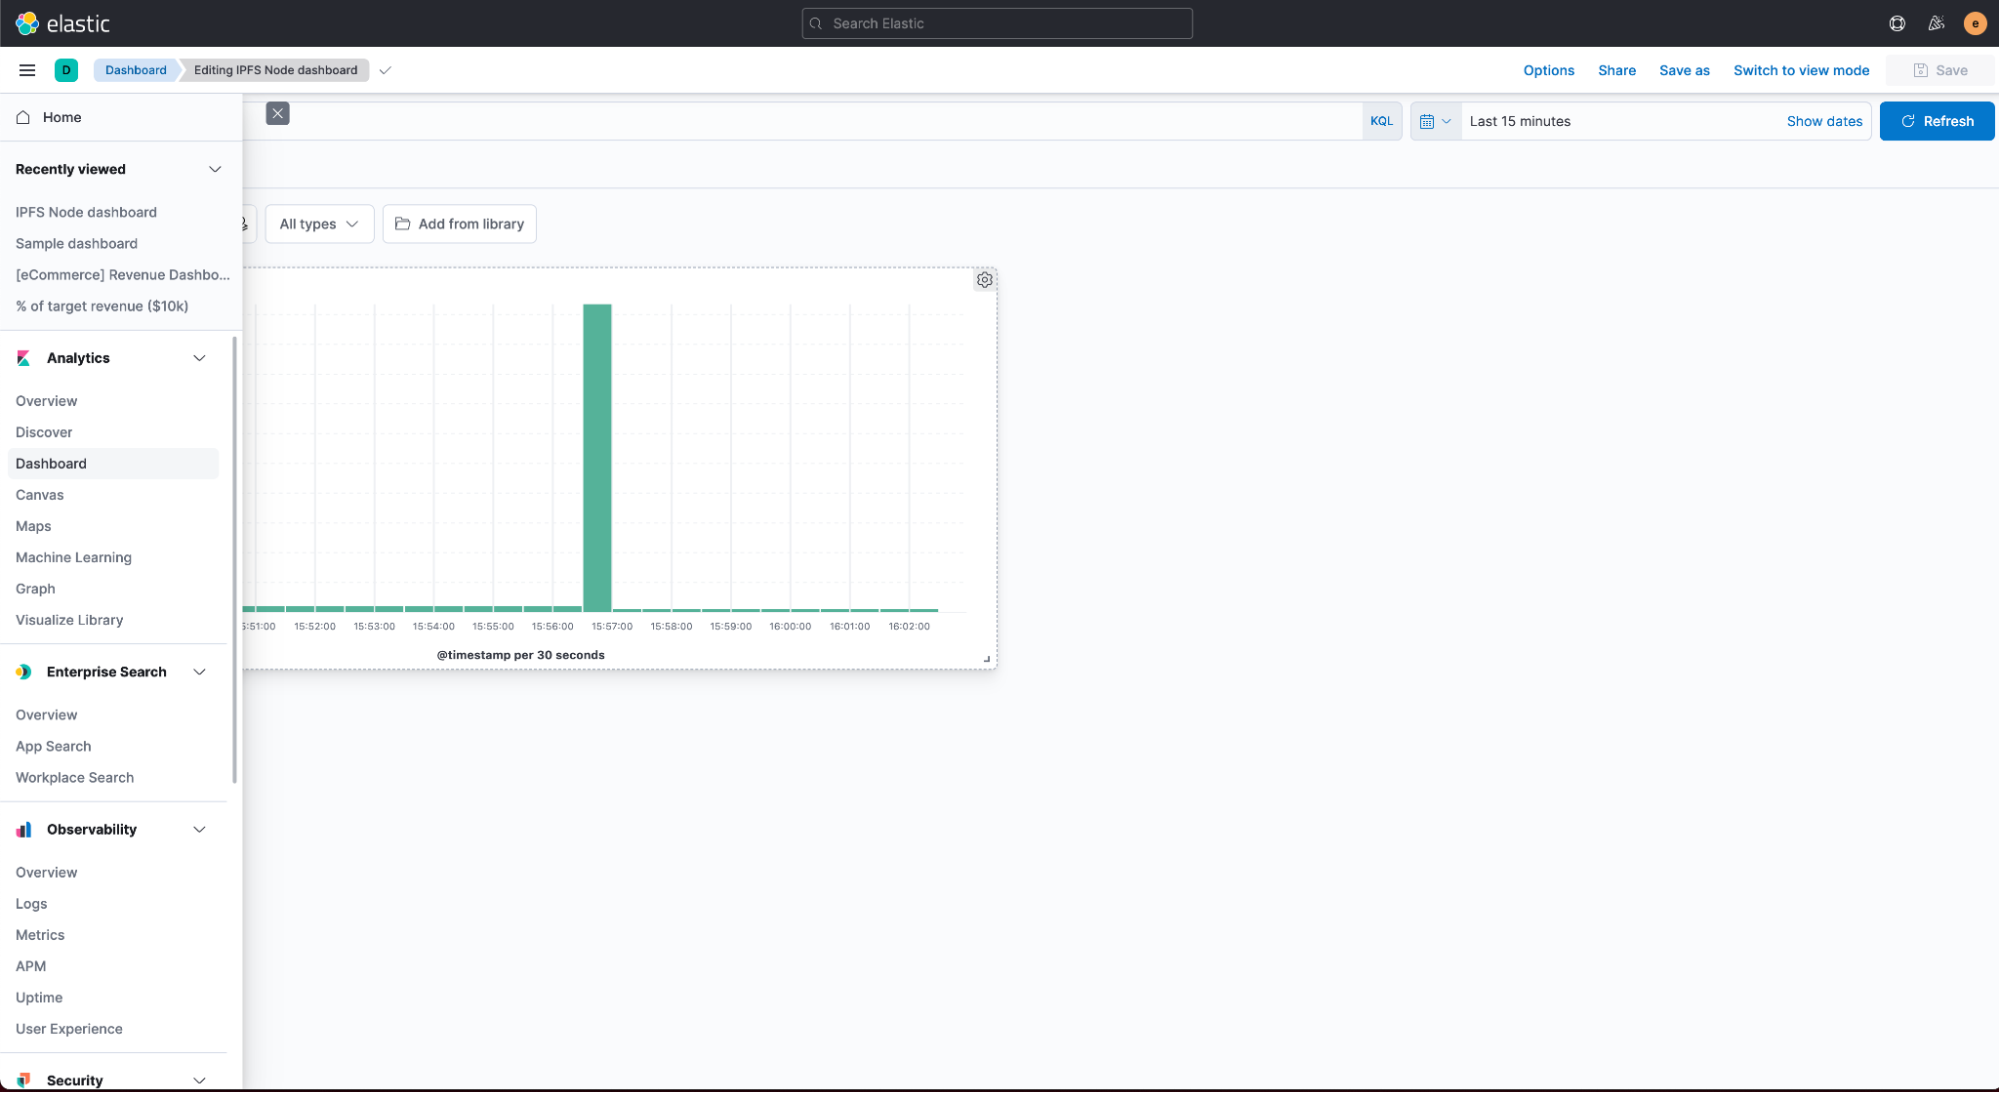
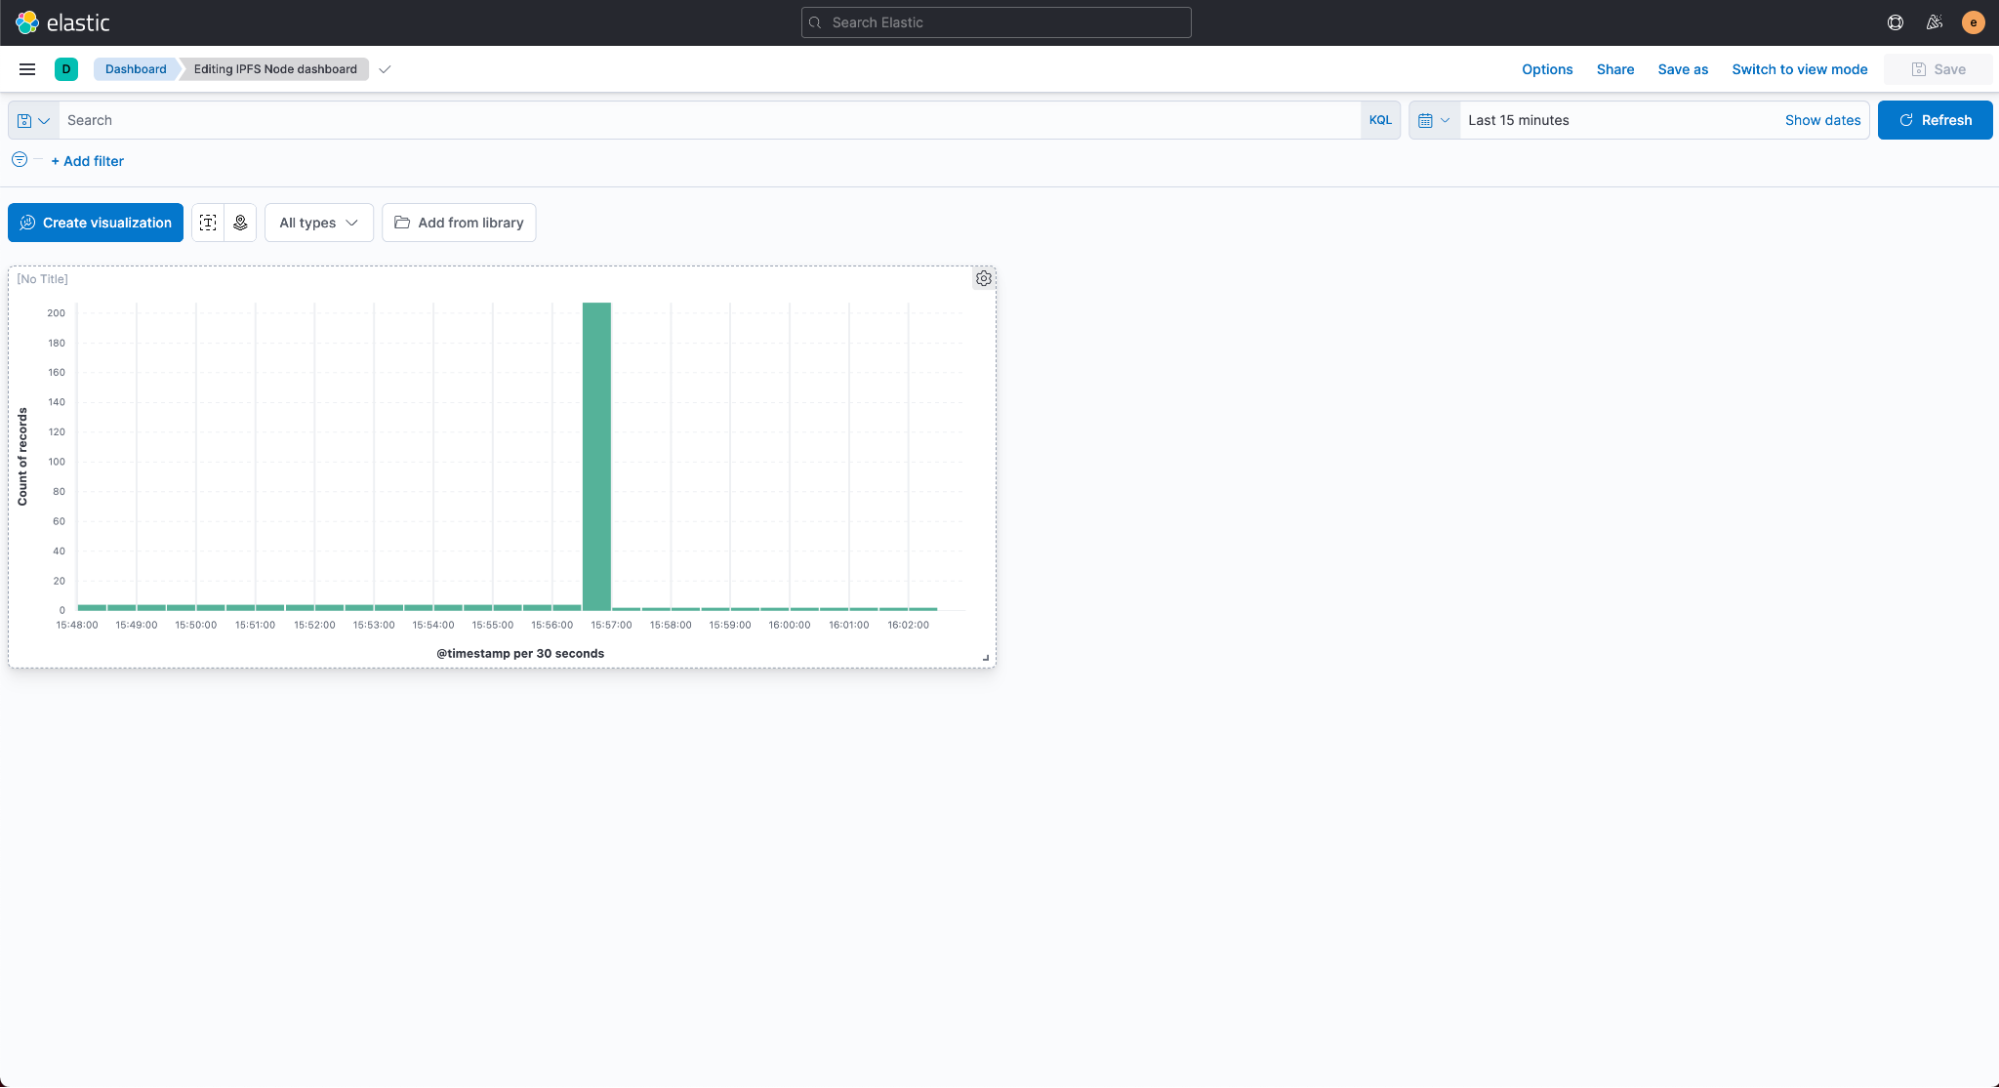
Now you can create your own by clicking on “Create dashboard” button.
Customize your dashboard and when you are done, save it.
In the screenshot below I have a simple data visualization based on records count.
Now that your dashboard is saved, switch back to your console and type the following command. (Note that this command should be run in your customer package folder - here ipfs_node)
julienlind@MacBook-Pro ipfs_node % elastic-package export
Use this command to export assets relevant for the package, e.g. Kibana dashboards.

Context: package

Usage:
  elastic-package export [command]

Available Commands:
  dashboards  Export dashboards from Kibana

Flags:
  -h, --help   help for export

Global Flags:
  -v, --verbose   verbose mode

Use "elastic-package export [command] --help" for more information about a command.The manual tells us that the option that should be used is “dashboards”.
With the following option you are asked to select dashboards to export, here we will choose the IPFS Node dashboard (Highlighted in red below)
julienlind@MacBook-Pro ipfs_node % elastic-package export dashboards
Export Kibana dashboards
? Which dashboards would you like to export?  [Use arrows to move, space to select, <right> to all, <left> to none, type to filter]
> [ ]  [eCommerce] Revenue Dashboard (ID: 722b74f0-b882-11e8-a6d9-e546fe2bba5f)
  [ ]  [Elastic Agent] Agent metrics (ID: elastic_agent-f47f18cc-9c7d-4278-b2ea-a6dee816d395)
  [ ]  [Logs System] New users and groups (ID: system-0d3f2380-fa78-11e6-ae9b-81e5311e8cab)
  [ ]  [Logs System] SSH login attempts (ID: system-5517a150-f9ce-11e6-8115-a7c18106d86a)
  [ ]  [Logs System] Sudo commands (ID: system-277876d0-fa2c-11e6-bbd3-29c986c96e5a)
  [ ]  [Logs System] Syslog dashboard (ID: system-Logs-syslog-dashboard)
  [ ]  [Metrics System] Host overview (ID: system-79ffd6e0-faa0-11e6-947f-177f697178b8)
  [ ]  [Metrics System] Overview (ID: system-Metrics-system-overview)
  [ ]  [System Windows Security] Failed and Blocked Accounts (ID: system-d401ef40-a7d5-11e9-a422-d144027429da)
  [ ]  [System Windows Security] Failed and Blocked Accounts - Simple Metrics (ID: system-f49f3170-9ffc-11ea-87e4-49f31ec44891)
  [ ]  [System Windows Security] Group Management Events (ID: system-bb858830-f412-11e9-8405-516218e3d268)
  [ ]  [System Windows Security] Group Management Events - Simple Metrics (ID: system-01c54730-fee6-11e9-8405-516218e3d268)
  [ ]  [System Windows Security] User Logons (ID: system-bae11b00-9bfc-11ea-87e4-49f31ec44891)
  [ ]  [System Windows Security] User Logons - Simple Metrics (ID: system-035846a0-a249-11e9-a422-d144027429da)
  [ ]  [System Windows Security] User Management Events (ID: system-71f720f0-ff18-11e9-8405-516218e3d268)
  [ ]  [System Windows Security] User Management Events - Simple Metric (ID: system-8223bed0-b9e9-11e9-b6a2-c9b4015c4baf)
  [ ]  [System] Windows Overview (ID: system-Windows-Dashboard)
  [X]  IPFS Node dashboard (ID: f285c260-212d-11ec-ab54-29ec3f292106)
[ ] Sample dashboard (ID: 702f7a00-212c-11ec-ab54-29ec3f292106)A Kibana folder is now created at the root folder and it contains both dashboards and tags if you have created some.
julienlind@MacBook-Pro ipfs_node % tree
├── kibana
│   ├── dashboard
│   │   └── ipfs_node-f285c260-212d-11ec-ab54-29ec3f292106.json
│   └── tag
│       ├── ipfs_node-6a5118a0-212c-11ec-ab54-29ec3f292106.json
│ └── ipfs_node-f1d2c610-212d-11ec-ab54-29ec3f292106.jsonNow that you have created some standard dashboards that will be shared along with your integrations, you are ready to publish your first package.
The tutorial code samples are available here:
https://github.com/jlind23/elastic-package/
Dashboard exported can be found here:
https://github.com/jlind23/elastic-package/tree/master/ipfs_node/kibana
Share
- Share on Twitter
Share on Twitter
- Share on LinkedIn
Share on LinkedIn
- Share on Facebook
Share on Facebook
- Share by Email
Share by Email
- Print this page
Print