Curious about taking Elastic Cloud for a spin? Subscribe to Elastic Cloud on AWS Marketplace or Microsoft Azure Marketplace to receive up to $1,000 in billing credits.
Three Elastic tools (AutoOps, the Profile API and ES Rally) can systematically diagnose Elasticsearch performance problems at every layer of the stack. In a delivery logistics scenario, they revealed a shard imbalance causing 30-second search spikes, a deep-pagination query wasting 98.9% of its execution time, and index settings limiting bulk ingestion to a quarter of achievable throughput. This post walks through each tool, what it surfaces, and how to use the findings to fix the problem.
When dealing with dozens of users who actively connect and use your platform backed by an Elasticsearch cluster, it’s important to quickly grasp what potential bottlenecks are and how to overcome them. The main question is: Where to start? Here’s your potential decision path:
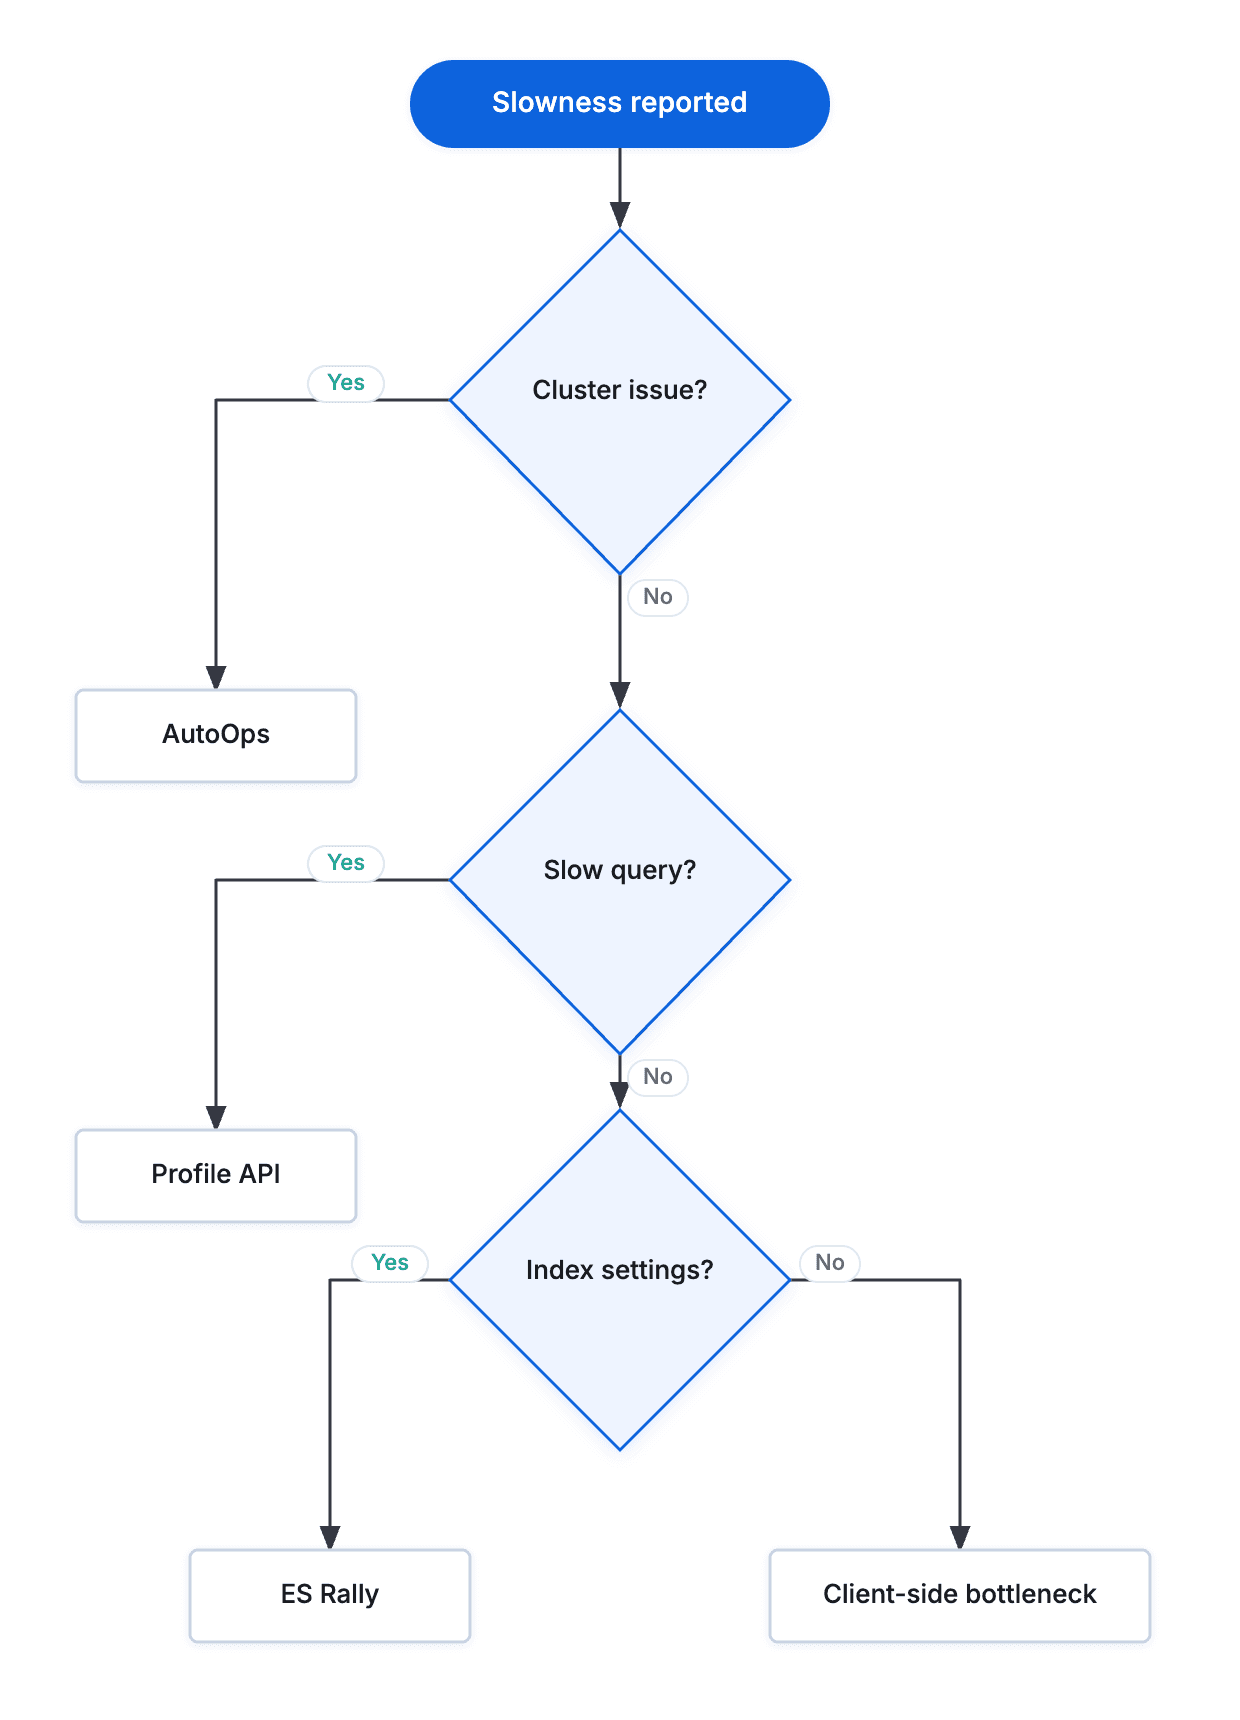
The path starts with AutoOps to detect cluster-level problems, like resource pressure or bad shard distribution. If the cluster is healthy, the Profile API helps identify slow queries; candidates can come from the slow query log or application-side logging. Next, ES Rally benchmarks index settings that may limit throughput. If all three come back clean, the bottleneck is on the client side.
How to detect cluster-level performance problems with AutoOps
The first question is always the same: Is the cluster itself the problem?
AutoOps is designed to provide real-time cluster diagnostics, deliver tailored advice, and help you improve the health of your clusters quickly. It comes by default in Elastic Cloud, and it has been added recently as a free option for self-hosted configurations.
It’s very easy to set it up, and it takes no more than five minutes to see data flowing into a comprehensive list of graphs that AutoOps offers you. The idea behind it is to install an Elastic Agent close to your cluster that reports back to the AutoOps platform which is connected with your Elastic Cloud account. Here’s the installation guide.
What’s nice about it is that it provides you with instant warnings and suggestions that are hard to spot through existing monitoring cluster technology. What’s really useful is that it also shows solutions to the issues.
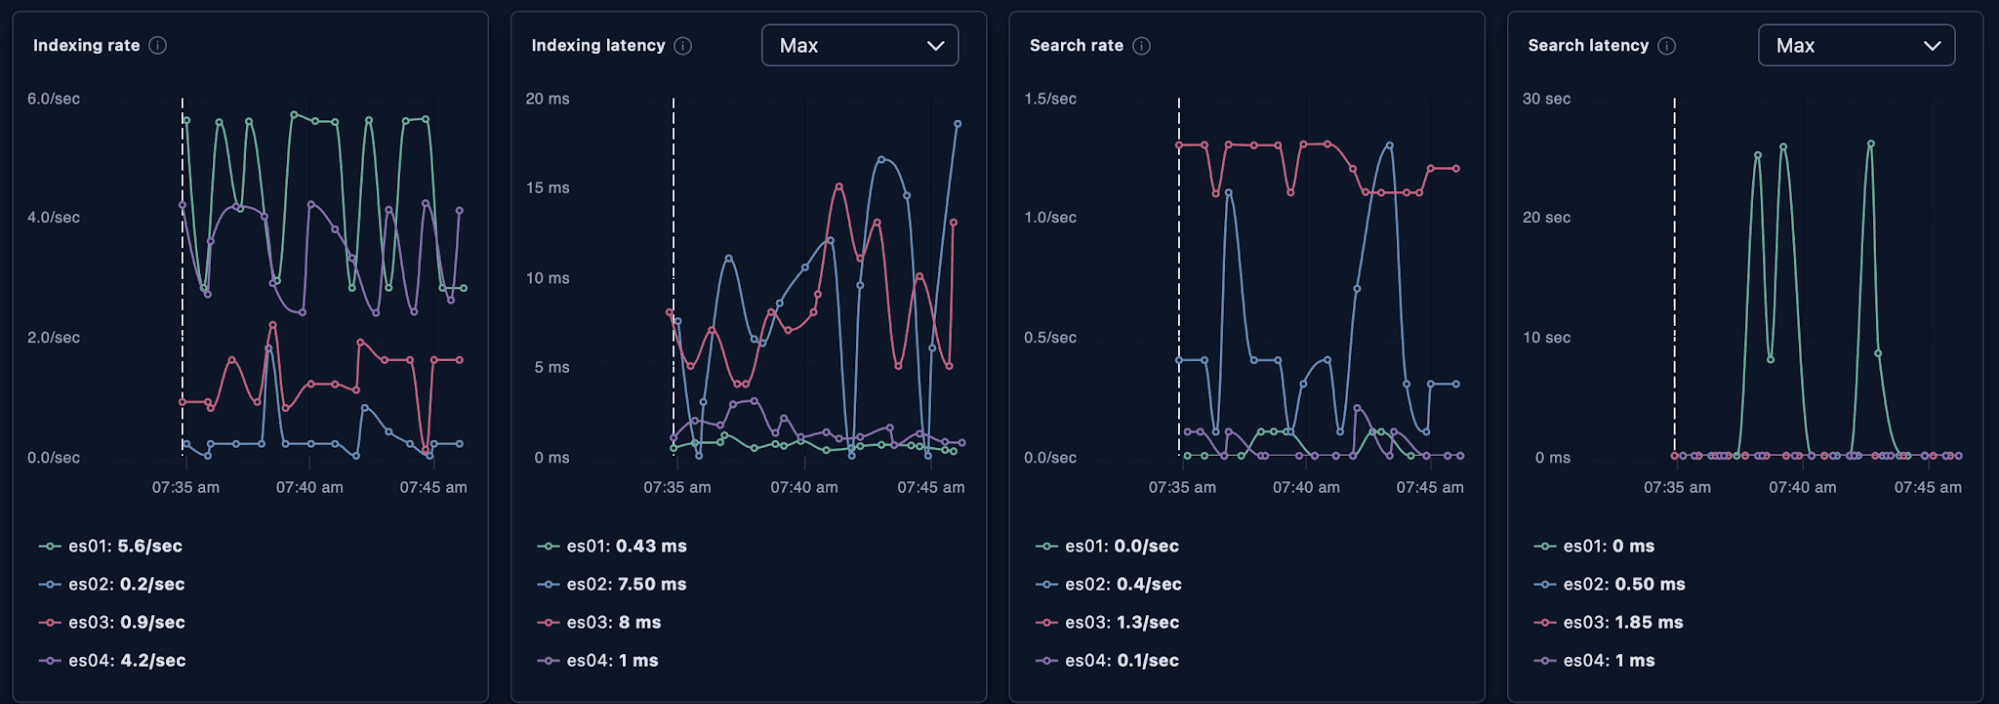
In our delivery logistics scenario, AutoOps surfaced one finding that explained the user-reported slowness: severe load imbalance across the cluster. Node es01 was handling nearly all traffic while the other three sat idle, with search latency spiking to 30 seconds, as we'll see in the graphs in the next section.
How AutoOps surfaces node hotspotting and shard imbalance
AutoOps node performance graphs revealed that es01 was handling nearly all indexing traffic (5.6 docs/sec) while es02, es03 and es04 were idle.
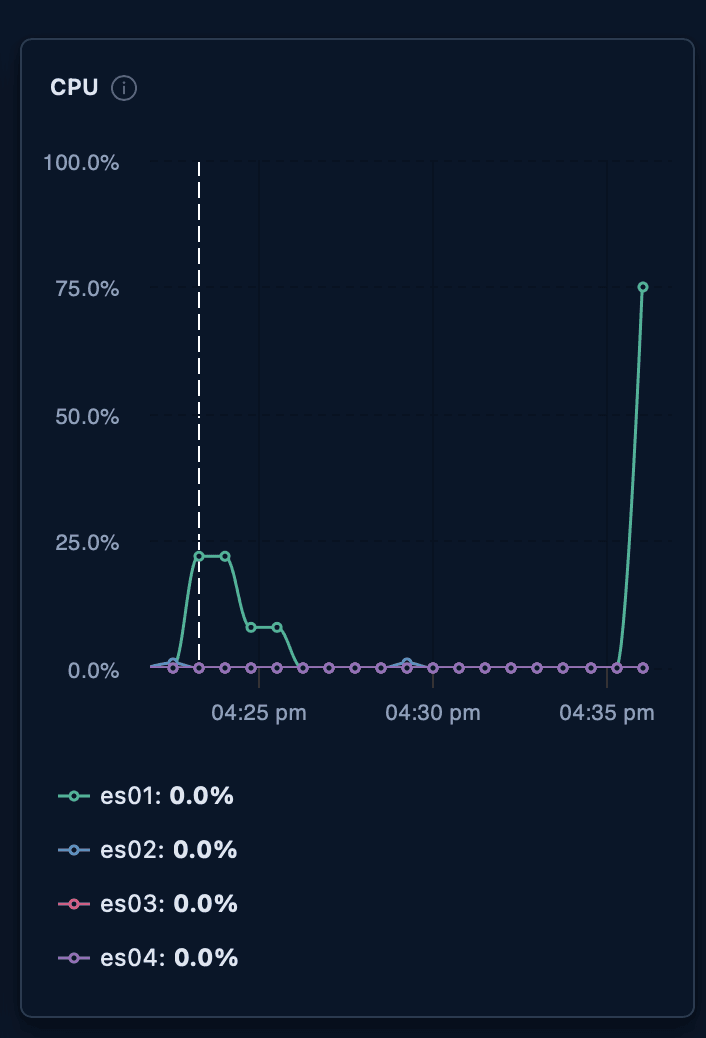
Below, we see that CPU usage was concentrated on a single node (es01) which was hosting the heavier index, while the other three nodes were mostly idle.
The next signal of unusual behavior appeared in the search latency graph. Using the AutoOps per-node latency view, we uncovered some unexpected results.
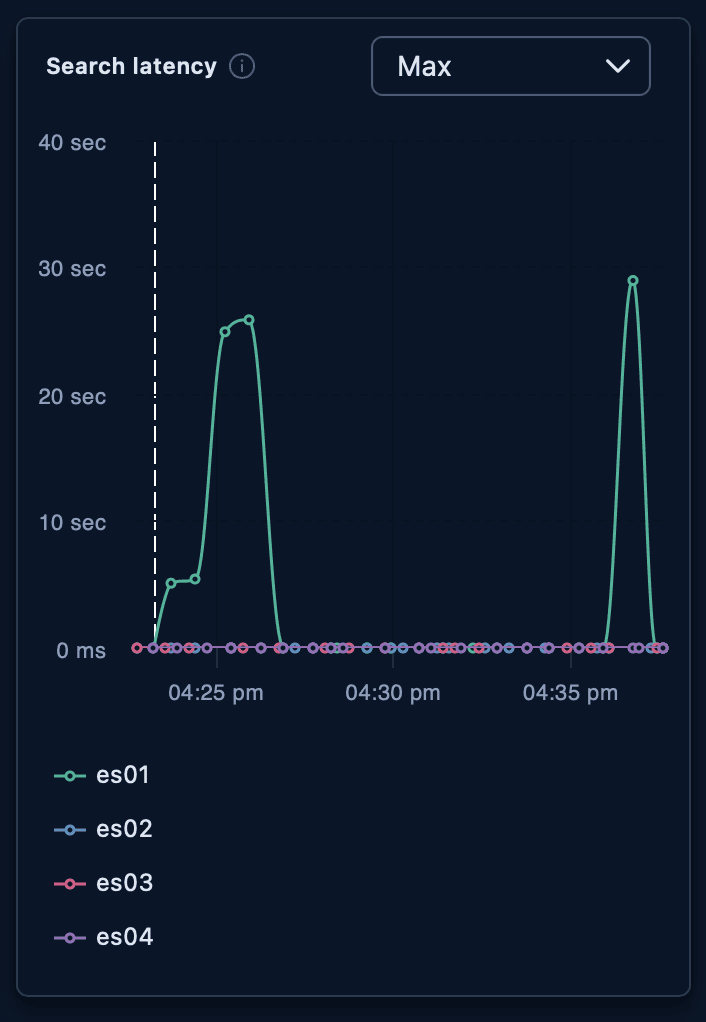
While other nodes show no latency, the heavy-loaded node shows symptoms of latency that affects search apps. Not only was it a write node, but also it was the one serving all search requests. During analysis, we found that a delivery index was stored on only one node, instead of being distributed across all four. That was the root cause of the issue. By reindexing the data (with increased number of primary shards), we balanced the query load and eliminated the primary issue.
This article focuses on a single AutoOps finding to keep the diagnostic flow clear. For deeper dives into the kinds of issues AutoOps surfaces, see the dedicated articles on hotspotting, high CPU usage, and long-running queries.
How to find slow Elasticsearch queries using the Profile API
Once the cluster is healthy, the next question is: Are there specific, expensive queries? Finding candidates is the first step. You can explore them either by using Elasticsearch’s slow query log or through application side logging, by measuring time required for every search request. In our case, infinite scroll on a tracking delivery screen was a problem while users would scroll deeper into results.
The Profile API is a powerful tool for analyzing long-running queries and finding search bottlenecks. Getting started is simple: Just set profile=”true” in any of your search queries, and the responses will contain a profile section with detailed timing breakdown. It highlights which phase dominates execution time: the query phase, aggregations, or data fetching.
Let’s take a closer look at the deep pagination case. In a case of infinite scroll in a mobile application, the user continues scrolling and the app responds by fetching 100 documents per request.
As users continues scrolling, the requests can reach very deep pagination levels, while the from parameter grows:
The profile data, summarized below and converted from nanoseconds to milliseconds, makes the bottleneck clear: Most of the time is spent outside the query and fetch phases on coordination work caused by the large from offset. Elasticsearch must collect 9,100 matching documents, sort them, discard the first 9,000, and return only the requested 100.
| Component | Phase | Time |
|---|---|---|
| ConstantScoreQuery contains | Query | 34.4ms |
| BooleanQuery | Query | 31.1ms |
| QueryPhaseCollector contains | Collect | 22.1ms |
| SimpleFieldCollector (9,100-doc priority queue) | Collect | 19.1ms |
| FetchPhase | Fetch | 12.1ms |
| Other steps, like request parsing and deserialization, queue wait time, response building | 1,885.4ms | |
| Total | 2,004.2ms |
Fixing deep pagination with search_after
In this case, the search_after approach is up to twice as fast because it avoids scanning and discarding earlier results. Instead, it resumes from the last document returned on page 90, using its delivery_pickup_datetime value (in epoch milliseconds) as a cursor and fetching only the next 100 records.
As shown in the comparison below, performances are much better with the search_after approach.
| Component | Phase | Time |
|---|---|---|
| ConstantScoreQuery contains | Query | 6.8ms |
| BooleanQuery | Query | 6.2ms |
| QueryPhaseCollector contains | Collect | 2.6ms |
| PagingFieldCollector | Collect | 2.0ms |
| FetchPhase | Fetch | 2.2ms |
| Other steps like request parsing and deserialization, queue wait time, response building | 9.4ms | |
| Total | 29.2ms |
Performance comparison
| Component | Deep pagination (from:9000) | search_after | Time saved | % Saved |
|---|---|---|---|---|
| ConstantScoreQuery | 34.4ms | 6.8ms | 27.6ms | 80.2% |
| BooleanQuery | 31.1ms | 6.2ms | 24.9ms | 80.1% |
| QueryPhaseCollector (total) | 22.1ms | 2.6ms | 19.5ms | 88.2% |
| FieldCollect | 19.1ms | 2.0ms | 17.1ms | 89.5% |
| FetchPhase | 12.1ms | 2.2ms | 9.9ms | 81.8% |
| Total | 2,004.2ms | 29.2ms | 1,975ms | 98.5% |
The total query time drops from 1,004 ms to 29 ms (a 98.5% improvement) almost entirely because Elasticsearch no longer has to build and discard a 9,000-document priority queue on every request.
How to benchmark Elasticsearch index settings with ES Rally
With the cluster healthy and queries optimized, the final question is: Are the index settings themselves a bottleneck?
ES Rally is the official benchmarking tool made by Elastic. Its key strength is reproducibility: You run the same workload against two configurations on the same cluster and hardware, so any difference in results is purely down to the settings you changed. ES Rally is able to measure improvements under identical conditions: same cluster, hardware, and dataset.
Why default Elasticsearch index settings limit bulk indexing throughput
In many cases, slow indexing is caused by default index settings that are suitable for development but not production. For instance, the default refresh_interval of 1 second increases resource usage because every refresh creates a new searchable segment, and a replica count of 1 doubles the number of write operations per indexing request.
Our delivery logistics platform, for example, ingests thousands of new records daily in bulk, exactly the kind of workload where these defaults hurt. Setting refresh_interval to -1 disables refreshing during the bulk loading phase, and temporarily dropping replicas to 0 halves the write operations. Both settings are restored after the import is complete.
In this demo, we won’t focus on how to prepare custom data for benchmarking, but it’s worth mentioning a nice article about it.
For benchmarking purposes, you set up two folders: one with the current settings and another with the contender settings. The sample dataset in this case contains 1 million records. All the files described below can be found in this repository.
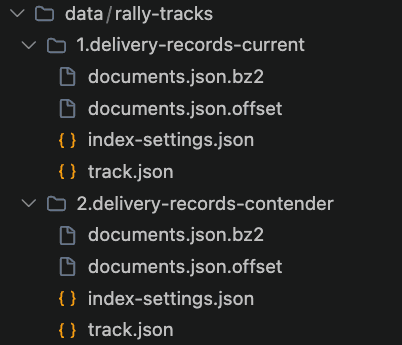
Both track folders contain an index-settings.json file. These files let you adjust mappings, shard counts, replica settings, and field types; for example, converting a field from double to scaled_float or from text to keyword. Because ES Rally tracks can be rerun quickly, it’s easy to experiment with different configurations and evaluate new optimization ideas as you iterate.
The next step is to run race commands (for current and contender race) to gather stats.
Quick tip: Using meaningful --race-id values (rather than the auto-generated ones) makes the comparison command much easier to run.After both races are complete, compare the results:
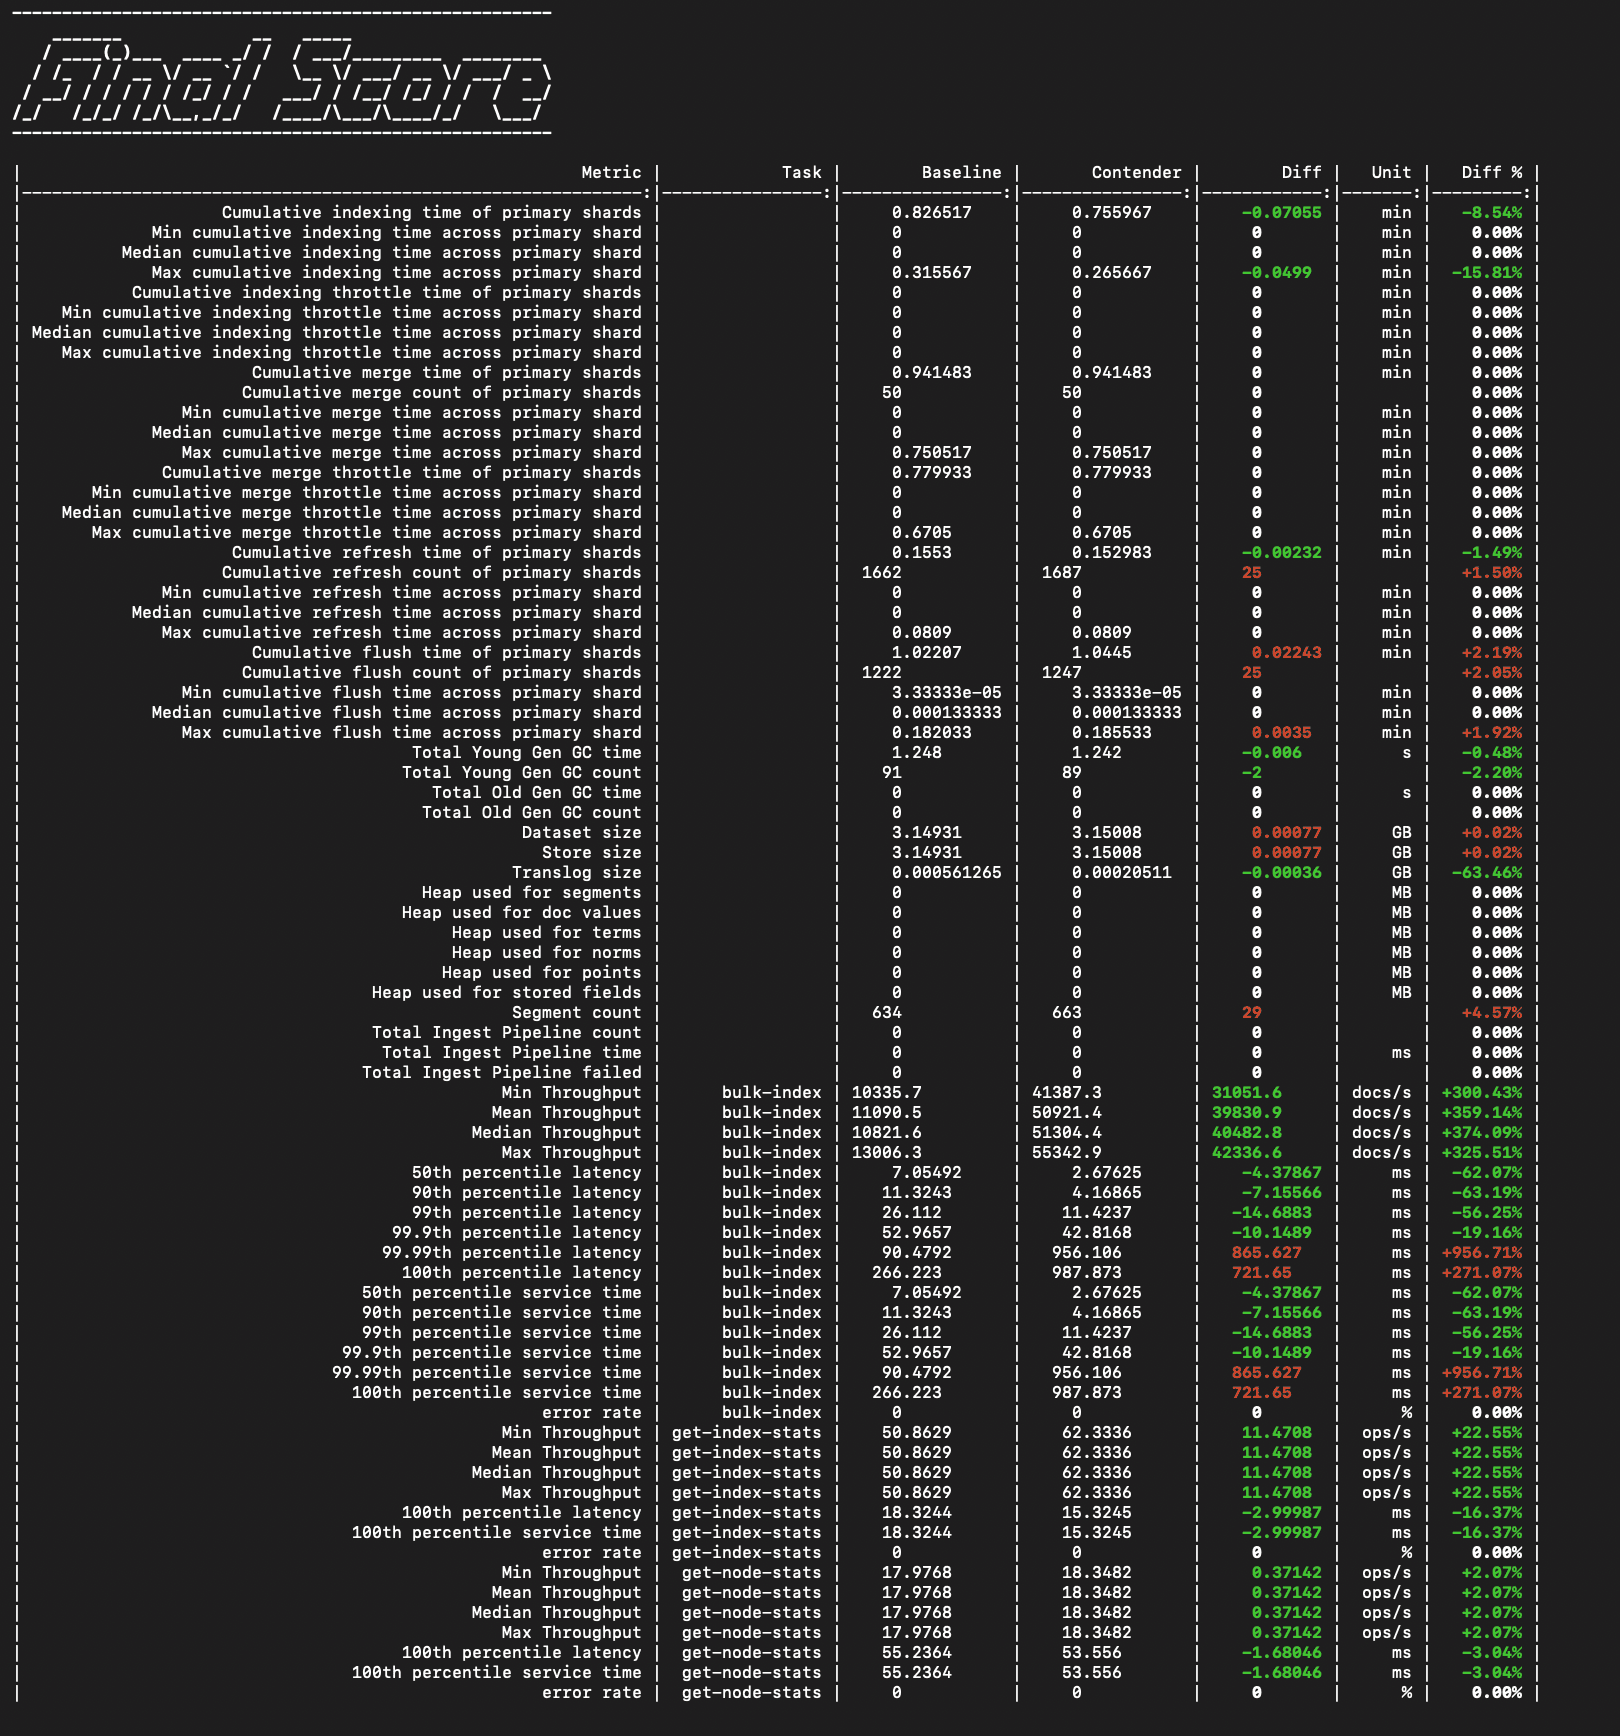
Additionally, reports are generated into csv files that can be easily manipulated to extract important data.
| Metric | Current settings | Contender | Change |
|---|---|---|---|
| Cumulative indexing time | 0,826517 | 0,755967 | +8.54% |
| Mean throughput | 11,090 docs/s | 50,921 docs/s | +359 % |
| Median throughput | 10,821 docs/s | 51,304 docs/s | +374 % |
| Min throughput | 10,335 docs/s | 41,387 docs/s | +300 % |
| Max throughput | 13,006 docs/s | 55,342 docs/s | +326% |
The contender configuration delivers roughly 3–4× faster indexing throughput, purely from adjusting refresh_interval and replica count during the bulk load phase.
In practice, a single comparison is rarely enough. Common follow-up experiments include converting double fields to float or scaled_float, changing text fields to keyword, adjusting shard count, and tuning the refresh interval. Because ES Rally tracks rerun quickly, iterating through these options is straightforward.
What to do when Elasticsearch isn't the bottleneck
If AutoOps shows a healthy cluster, the Profile API shows fast queries, and ES Rally confirms that index settings are not the limiting factor, the bottleneck is on the client side. The Elasticsearch side is no longer the place to look. Common application-layer causes:
- Network latency between the client and the cluster, especially across regions, VPNs, or proxies.
- Client-side deserialization overhead on large response payloads. Use
_source excludeor thefieldsparameter to return only what the client actually needs. - Client-side queueing before requests reach the cluster. The Elasticsearch client uses an HTTP connection pool. Under concurrent load, requests wait in line for a free connection. The Profile API never sees this wait because the request hasn't left the client yet.
- Single search calls where
_msearchwould batch independent queries into one network round trip. - Single-document indexing where the
_bulkAPI would amortize per-request overhead across many documents.
The diagnostic value of AutoOps, the Profile API, and ES Rally is precisely that they let you definitively rule out the cluster, the query, and the index settings before turning to the application code. When the three tools come back clean, the investigation moves out of Elasticsearch and into the client.
For investigating these on the application side, Elastic APM is the natural next tool: It traces request paths through the client and surfaces exactly the kind of pre-cluster wait time the Profile API can't see.
Conclusion
Going back to the original problem, slow search on a delivery logistics platform, we traced the issue from the infrastructure level down to the query and settings level:
- AutoOps revealed an uneven shard distribution that concentrated all query load on a single node, causing latency spikes of up to 30 seconds for end users.
- The Profile API showed that deep pagination was the source of the slow queries. Switching from from/size to
search_aftereliminated 98.9% of the latency. - ES Rally confirmed that optimizing index settings during bulk ingestion, specifically
refresh_intervaland replica count, can increase throughput by 3-4×.
Each tool answers a different question. AutoOps gives you the "Is something structurally wrong?" view. The Profile API answers "Why is this specific query slow?" And ES Rally validates "Do these changes actually improve things, and by how much?" Used together and in this order, they cover the full diagnostic surface for the Elasticsearch side of the application. When all three come back clean, the next step is to look at the client, as outlined in the previous section.
Contenido relacionado

7 de julio de 2026
Your compliance posture just got an upgrade: Elasticsearch now supports FIPS 140-3
Elastic 9.4 brings FIPS 140-3 support for Elasticsearch and Kibana to GA. Here's what changes for federal, defense and regulated deployments, and how to migrate from 140-2.

19 de junio de 2026
Why your Elasticsearch cluster is hitting disk watermarks: 14 real-world causes explained
Learn how Elasticsearch disk watermarks work, why they trigger, and how to diagnose 14 of the most common scenarios Support encounters, from index bloat to ILM stalls.
29 de mayo de 2026
One API call per operation: how Elastic Cloud Hosted makes fleet-scale deployment management practical
Elastic Cloud Hosted adds five targeted APIs for upgrade, tier scaling, user settings, tags and snapshot repository linking, each replacing a multi-step deployment plan edit with a single focused call.
18 de mayo de 2026
Agentic AI search with deterministic guardrails in Elasticsearch for safe query execution
Agentic AI search systems often fail when LLMs generate queries directly. Learn how deterministic guardrails and a control plane architecture enable safe, reliable, and governed query execution with Elasticsearch.

13 de mayo de 2026
Ecommerce search optimization using margin and popularity boosting in Elasticsearch
Learn how to optimize ecommerce search using margin and popularity boosting. This blog explains how a governed control plane treats economic optimization in Elasticsearch.