Simplify your Elasticsearch operations with real-time issue detection and actionable recommendations to optimize performance and reduce costs. AutoOps is available for cloud and self-managed deployments. Learn more about AutoOps.
AutoOps has a redesigned experience for Elastic Cloud Hosted deployments and Cloud Connect clusters. The update adds a new Critical severity level and refreshes every page, including Template Optimizer, Nodes, Shards and Overview. Updated layouts and navigation make Elasticsearch issues easier to scan and triage. This post covers the redesigned UI and where AutoOps is headed next, including a headless, agentic experience.
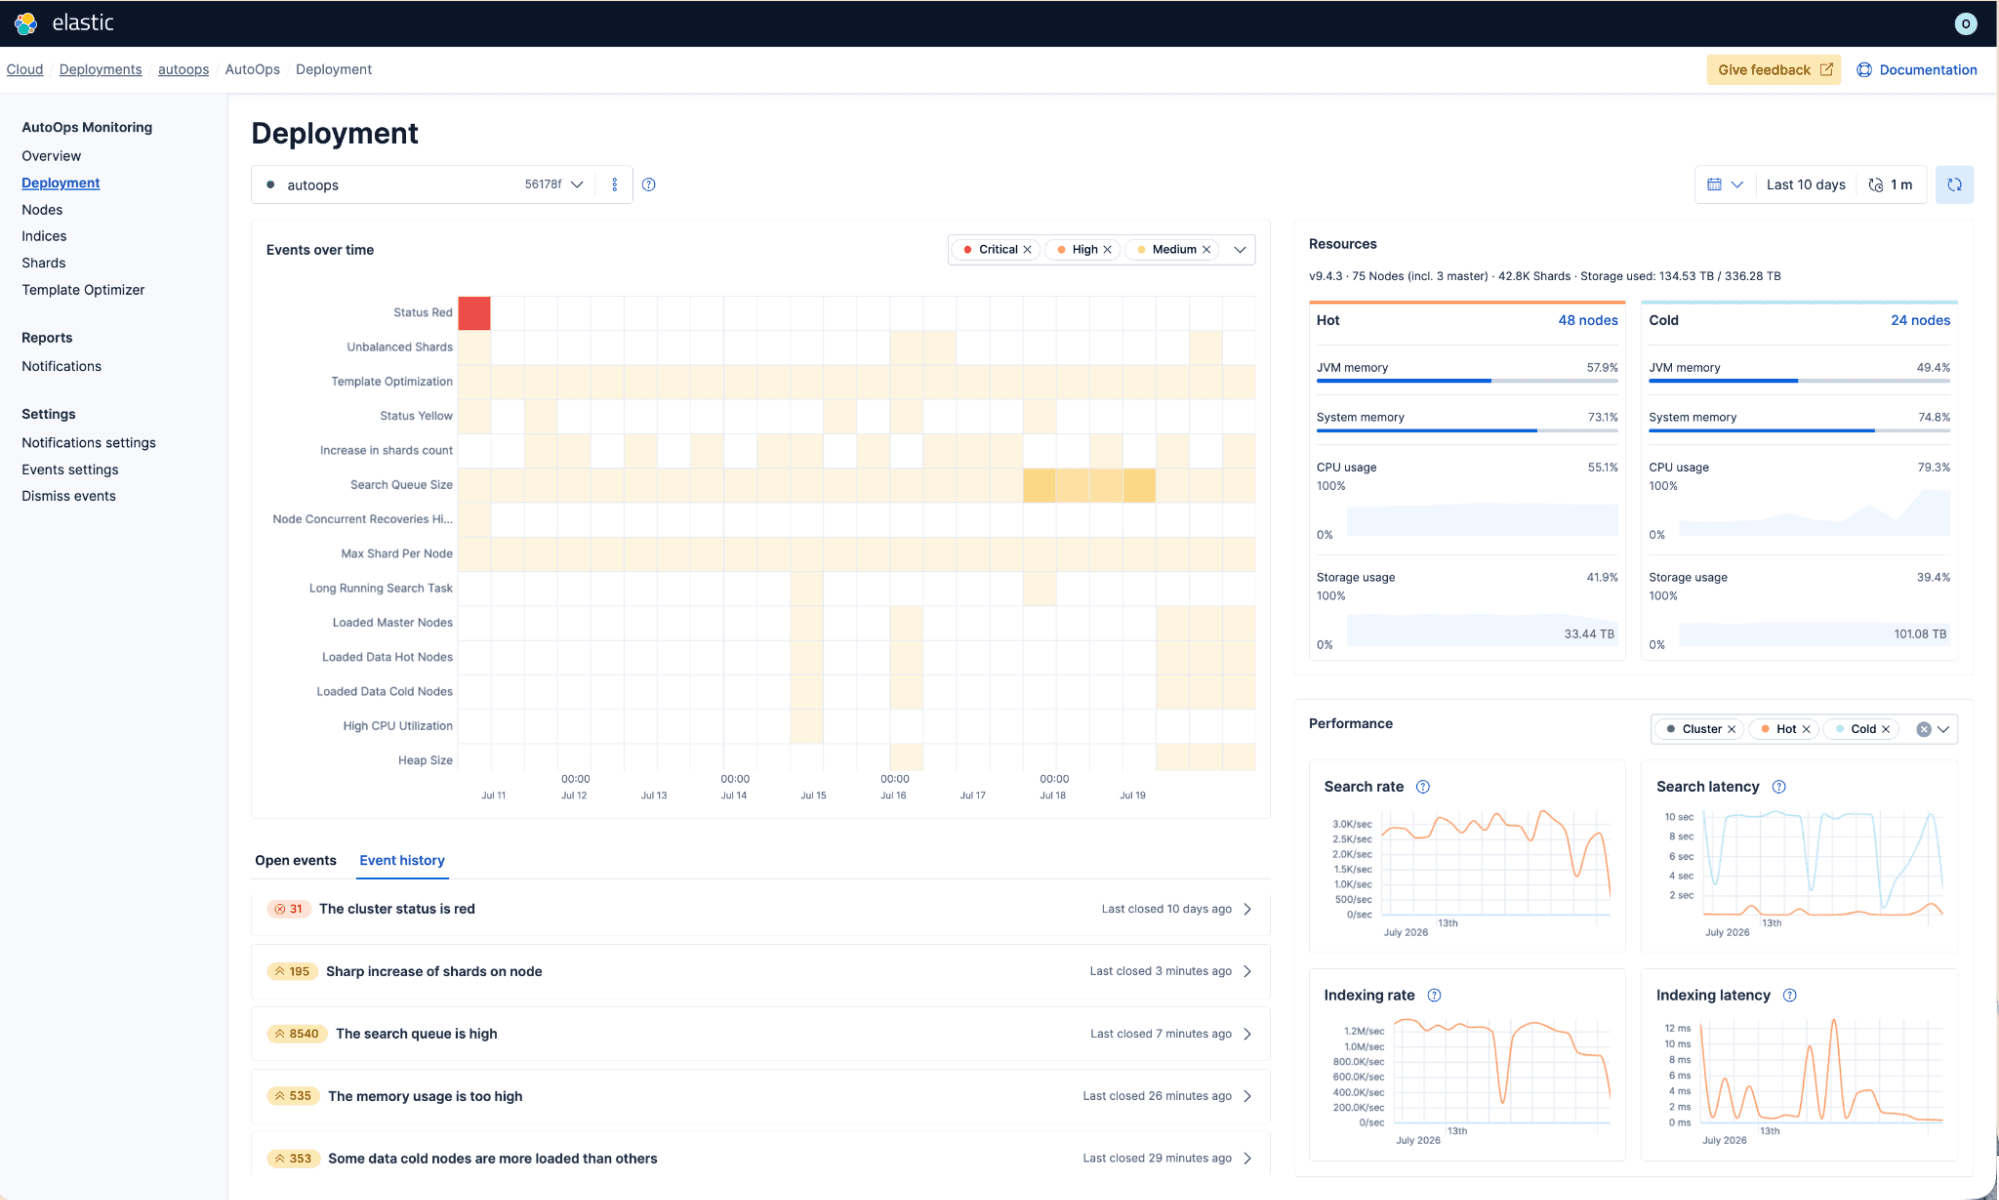
The redesigned AutoOps deployment view with a clearer event timeline and separation between open and closed events
Why AutoOps for Elasticsearch needs clearer prioritization
Running Elasticsearch at scale requires administrators to monitor cluster health, performance, capacity, and configuration at the same time. AutoOps now provides a clearer way to distinguish conditions that threaten cluster functionality from significant but less urgent degradation. The redesigned interface also follows familiar Elastic Cloud Console patterns, making active issues easier to find and investigate.
What changed in AutoOps: severity, navigation, configuration, and page design
The monitoring engine remains the same. The redesigned layout, navigation, and workflows now follow familiar Elastic patterns.
A clearer severity model
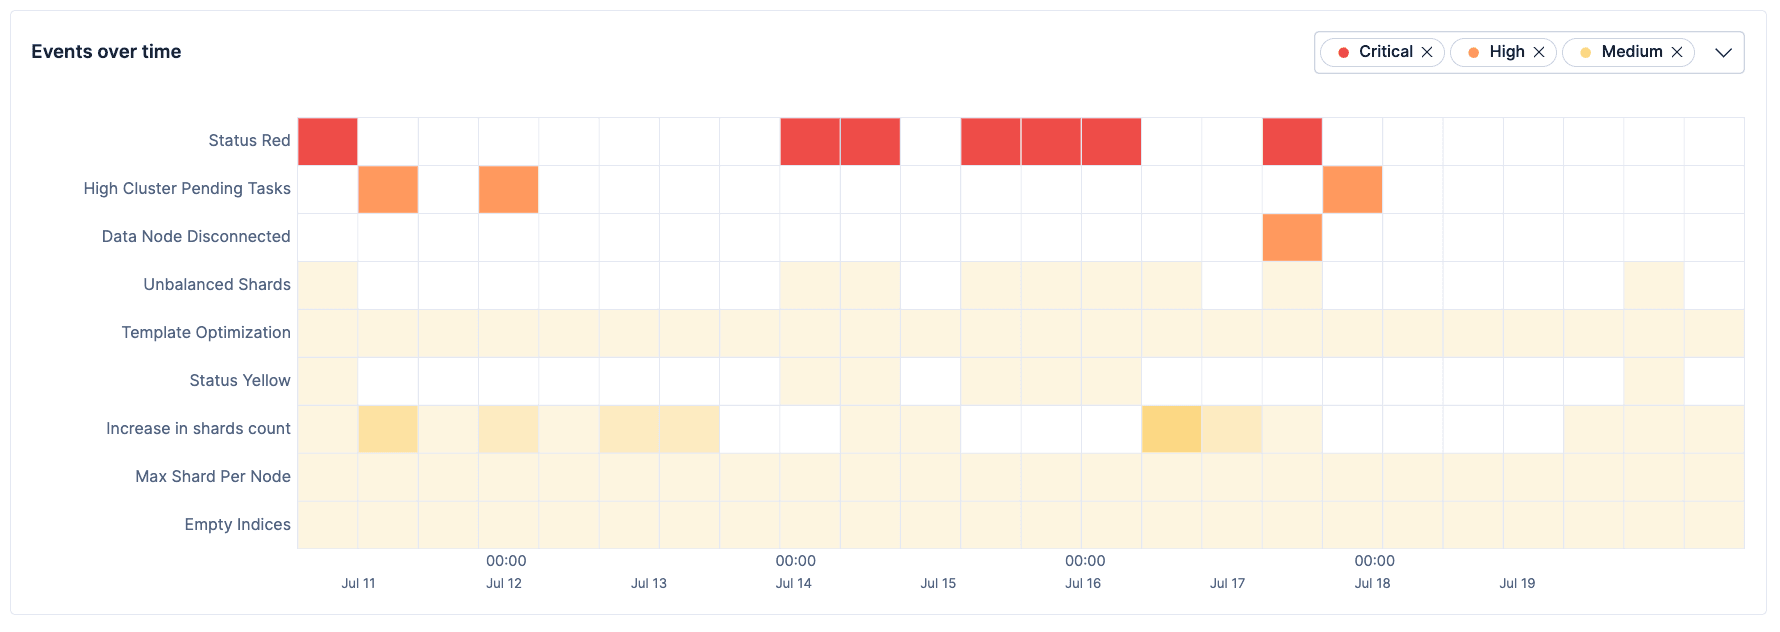
New event severity and re-classified events severity.
We added Critical as a new severity level for conditions that pose an immediate threat to cluster functionality and require urgent intervention. Several events previously classified as High are now Critical. Others are now Medium because they represent potential risk rather than active, significant degradation. The reclassified events are:
- Promoted from High to Critical: Disk Watermark Flood Stage, Master Not Discovered, and Status Red.
- Demoted from High to Medium: Disk Watermark Low Threshold, Disk Watermark Low, and Disk Watermark Configuration Incorrect.
| Severity | What it means |
|---|---|
| Critical | Immediate threat to cluster functionality. Urgent intervention required. |
| High | Significant degradation to usability, performance, or stability. |
| Medium | Potential risk that can escalate if left unaddressed. |
| Low | Minor anomalies with minimal operational impact. |
| Info | Routine operational updates and configuration changes. No action required. (Coming in a near-future update). |
Every severity level ships with an updated icon set and color palette. Levels are fixed so teams can build consistent runbooks and notification filters: route Critical and High events to PagerDuty or Slack, keep Medium and Low in the console for periodic review, and when Info arrives, use it for awareness without alert fatigue.
Deployment view: open events and history, side by side
The redesigned deployment view presents the existing Open events and Event history tabs in a clearer layout.
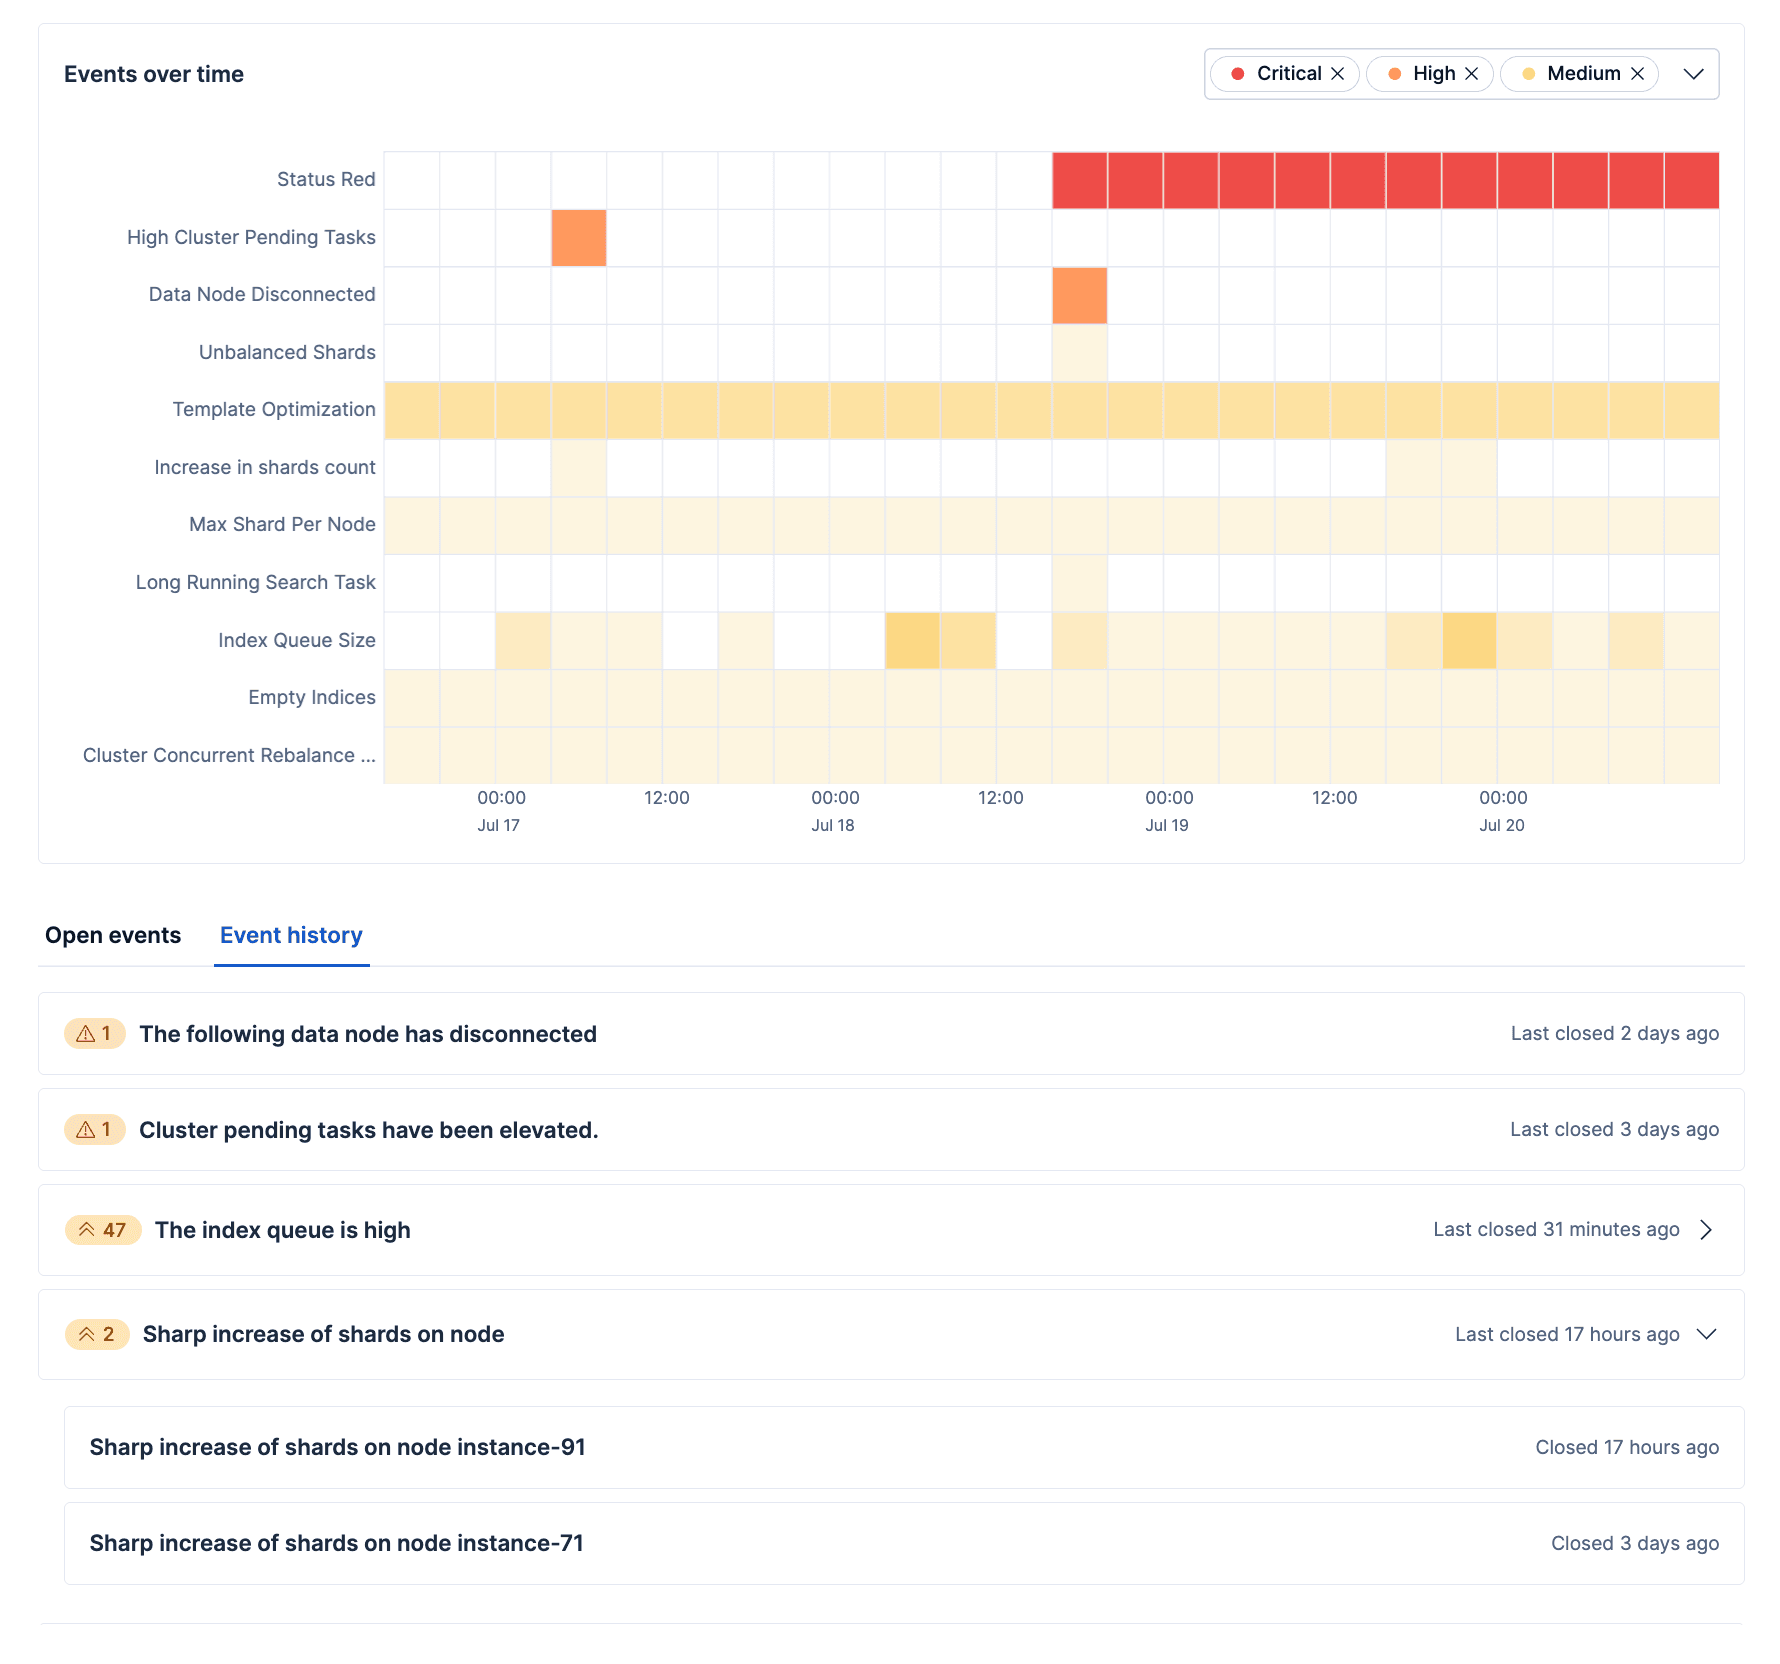
"Separate tabs for open events and history keep current issues and past activity easy to scan."
Event flyout: a clearer view of what matters
The event detail flyout is redesigned around action. High-severity events include a notification callout and an interactive badge that shows whether alerts are configured and links directly to setup. Recommendations collapse by default so the core event stays in focus. Settings live in the flyout menu; share is a separate icon in the header. The Dismiss action appears only when your role has the required admin permissions and the event is dismissible.
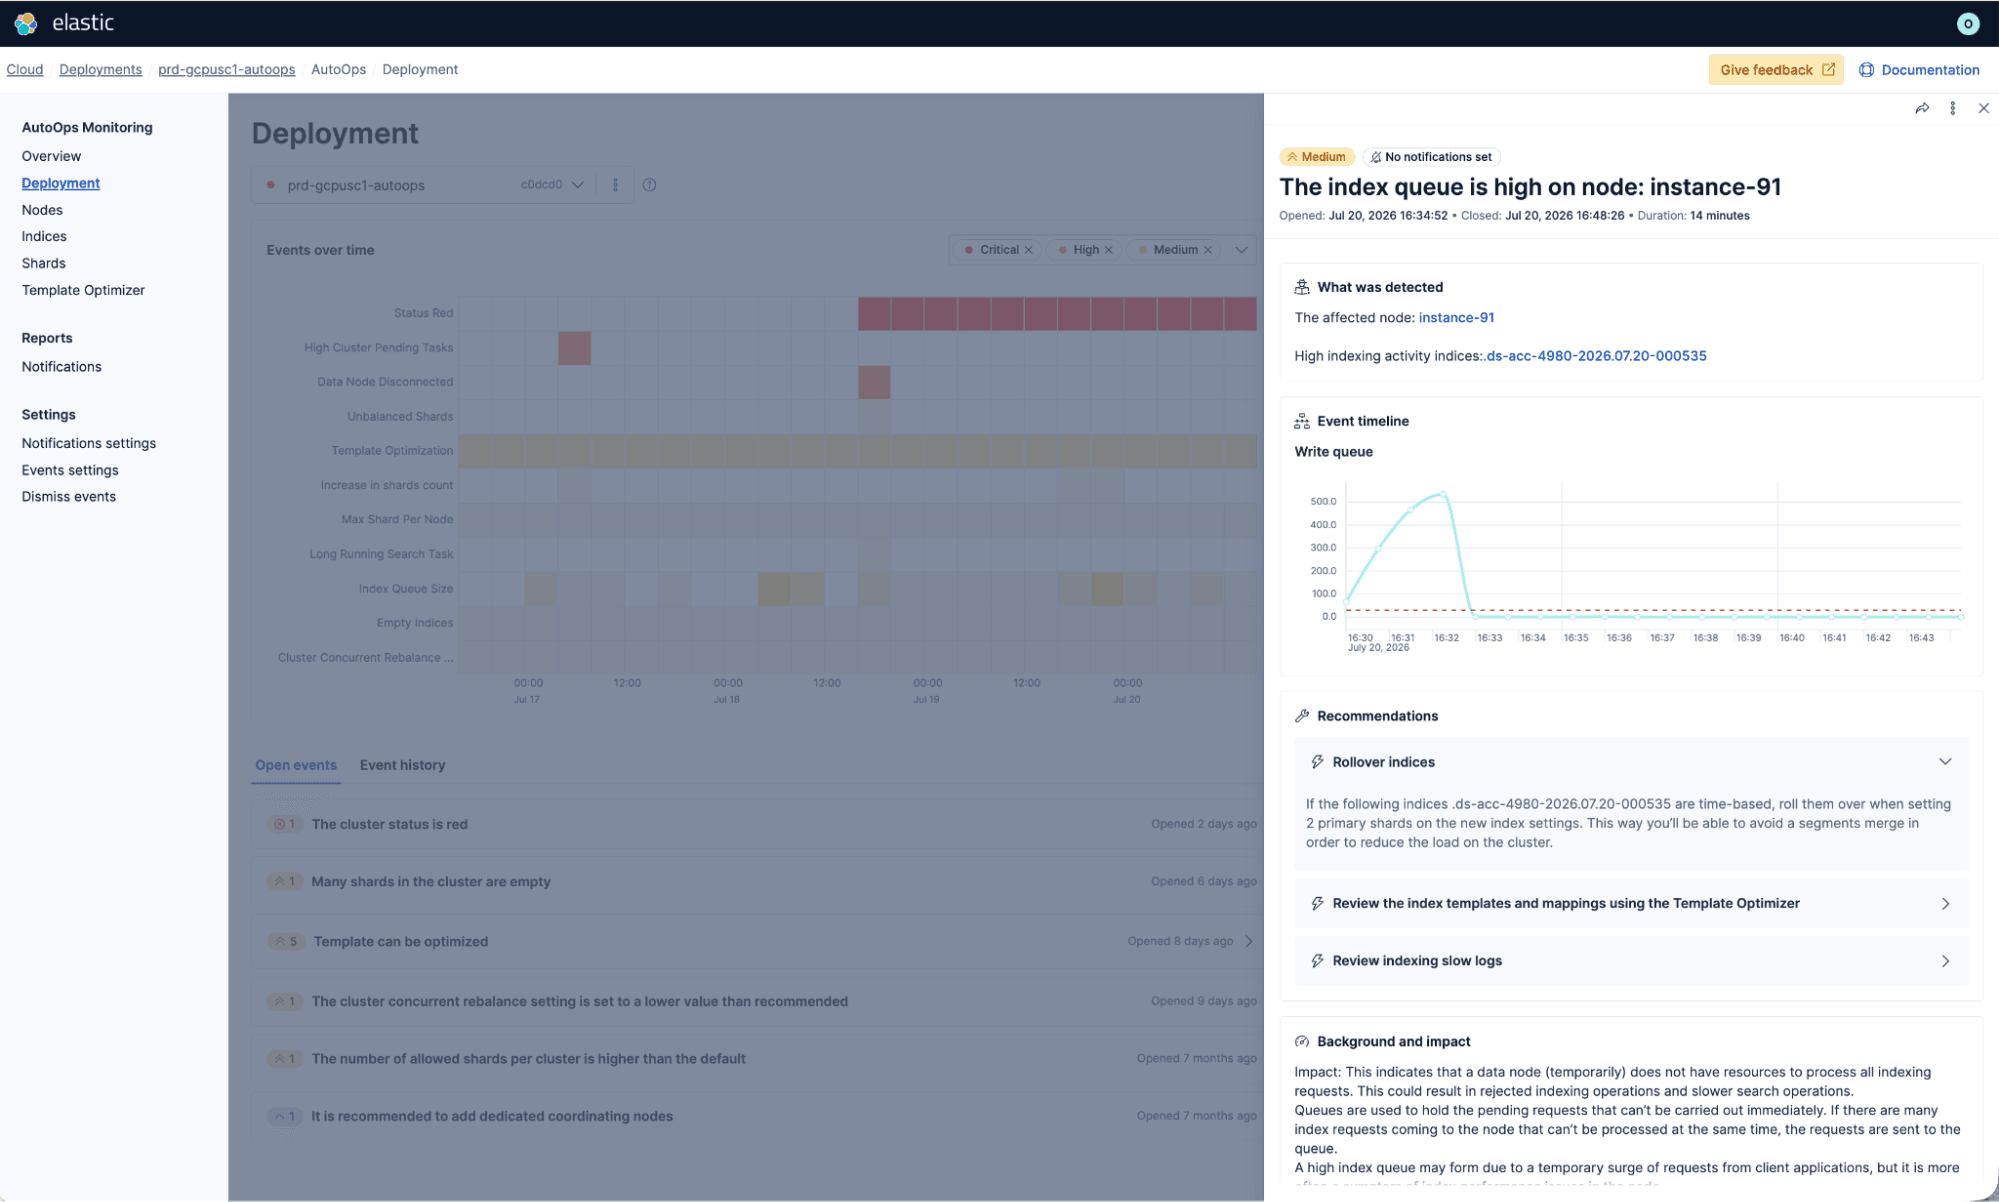
"The event flyout surfaces notification setup and recommended actions without leaving the insight."
AutoOps overview: triage active events across your Elasticsearch fleet
The Overview page is reorganized around how operators scan an estate. Elasticsearch context sits directly under the page header, and active events appear as event ribbons below the deployments table. Each ribbon shows the latest active event in your selected time range; if the same event type is open on other deployments, a new badge lets you expand the view without opening each resource individually. Event search moved to the left for quicker filtering.
The “Events over time” chart moved off Overview to keep this page focused on fleet-level triage; open a single deployment when you need that timeline.
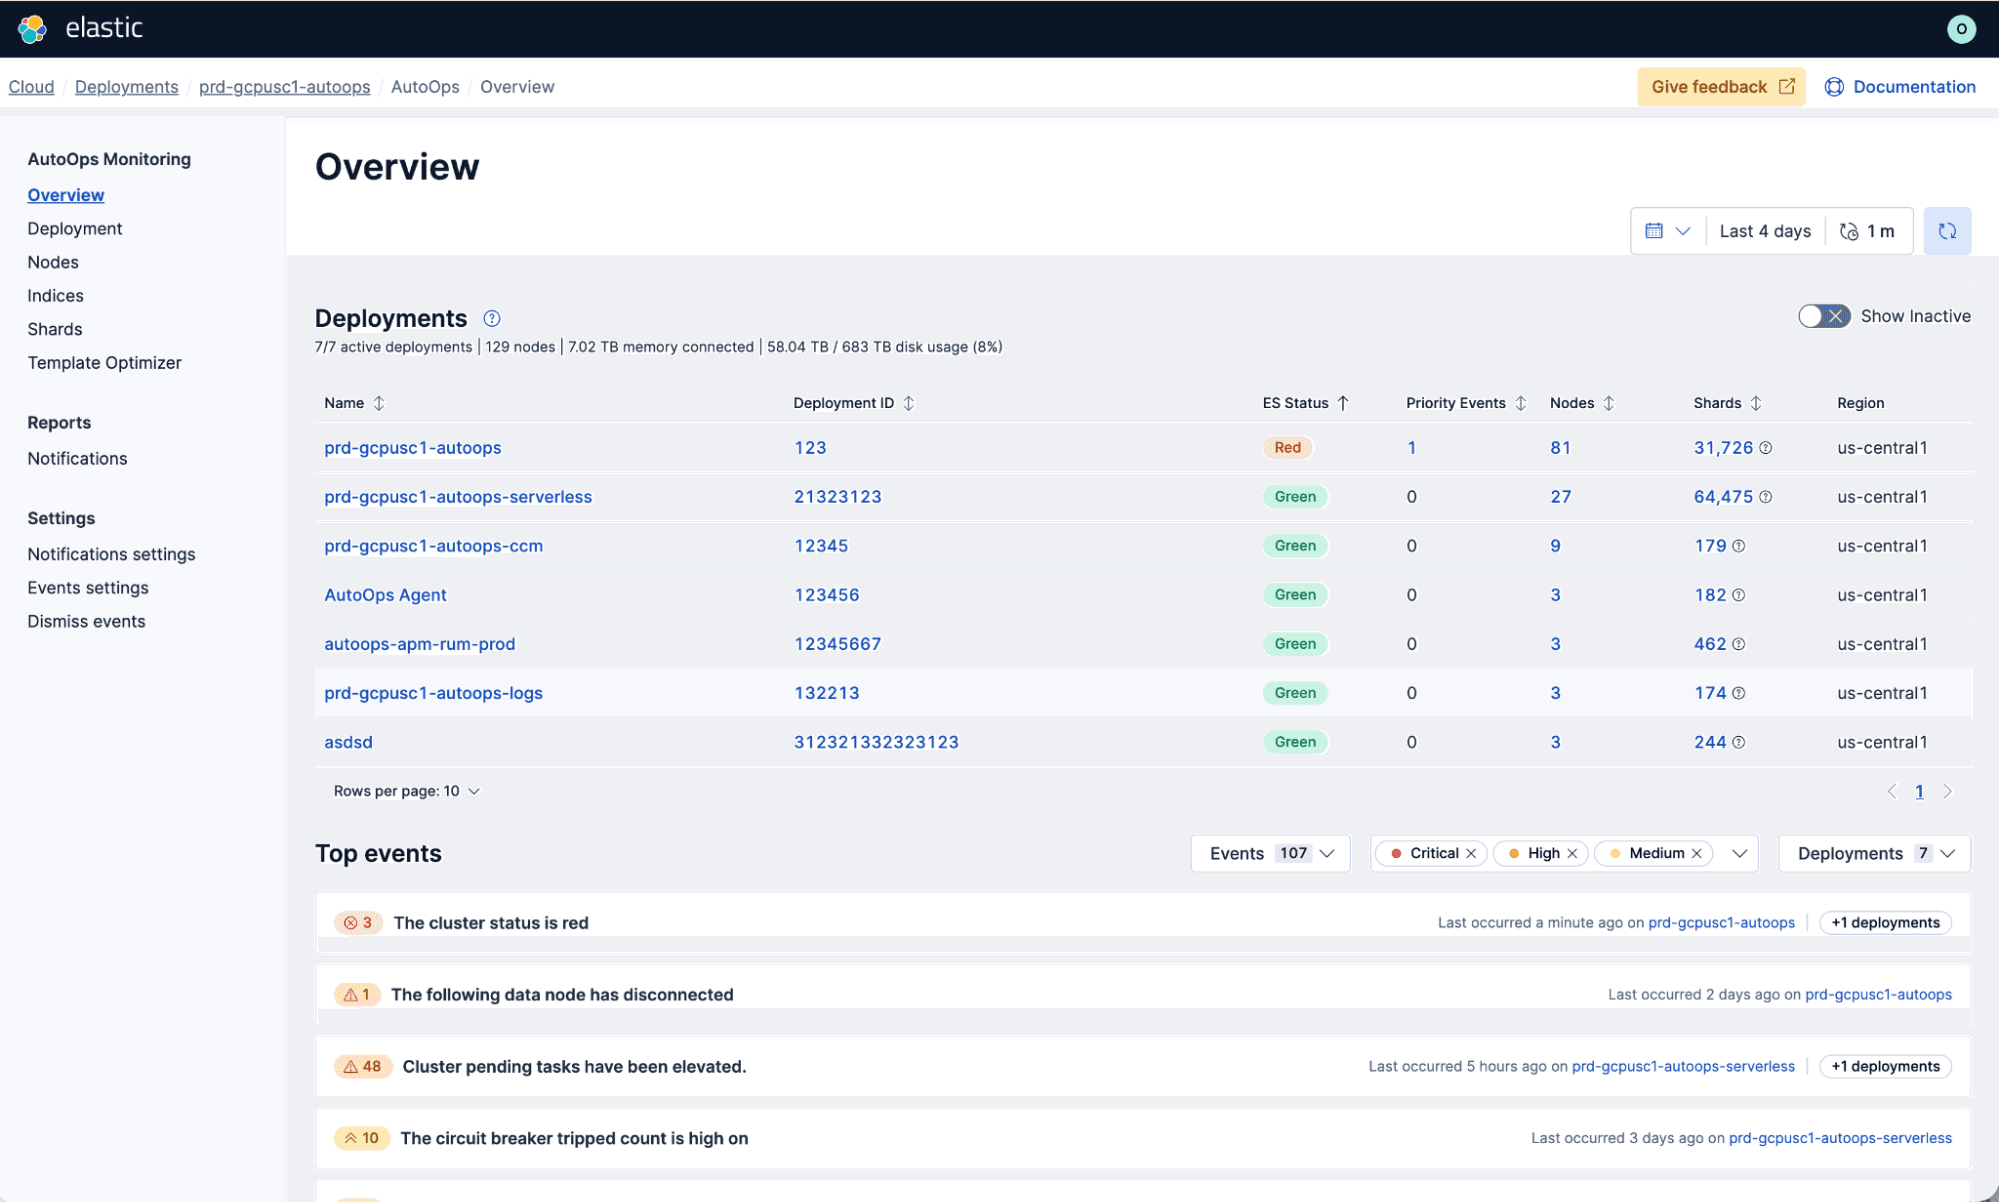
"Event ribbons group active issues across deployments so you can triage without opening each one."
Nodes, Shards, and Indices are designed with easier navigation and information hierarchy
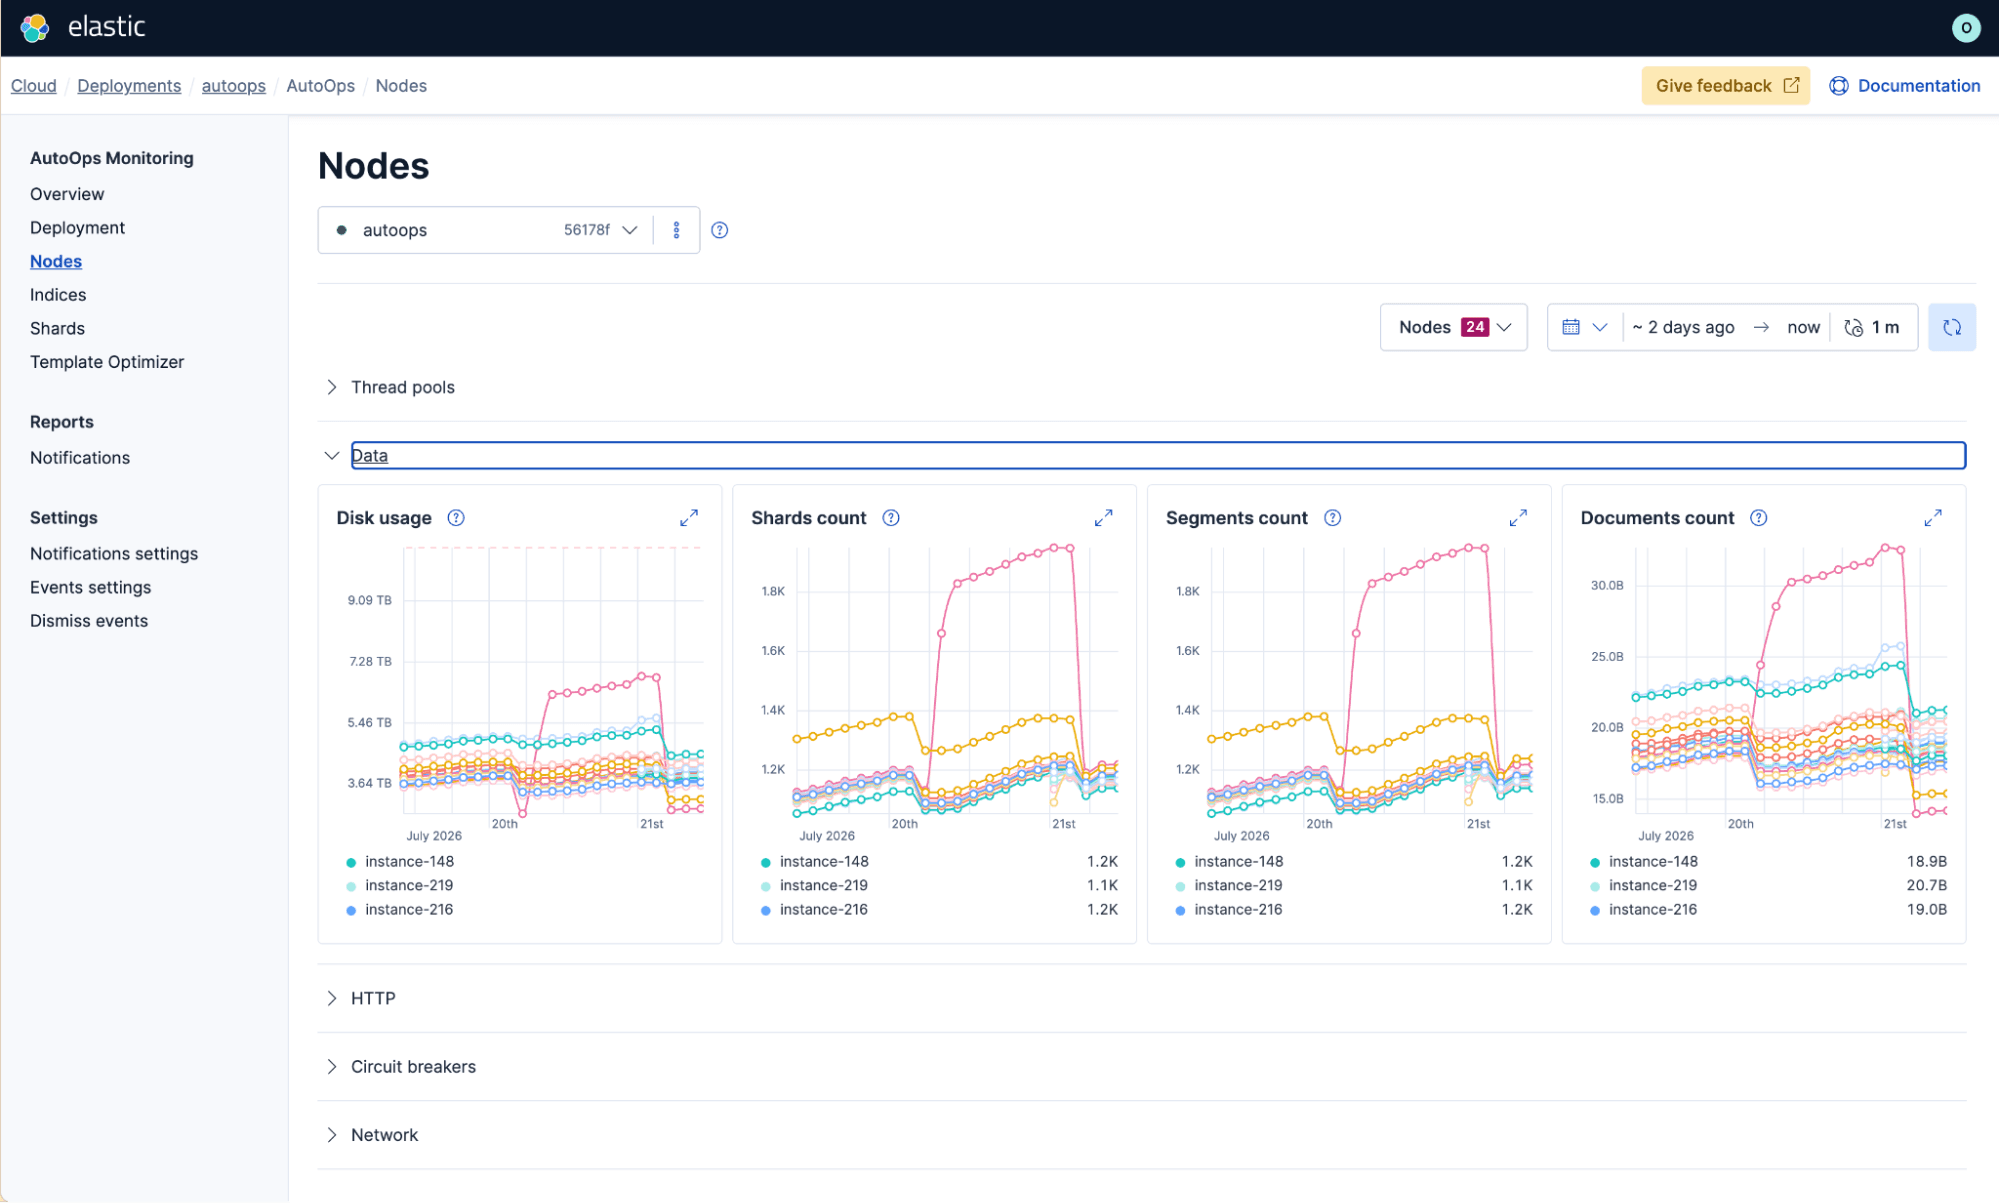
Nodes view now uses updated chart components and the Elastic UI color scheme, with clear expansion indicators on accordion sections. Event and instance lists that duplicated deployment-level views were removed to reduce noise.
Shards view improves node selection and groups view controls in the upper-right corner. A horizontal scrollbar supports wider layouts, and the time slider now uses native Elastic UI components. Node selection in Shards view now works across larger clusters and presents up to 100 nodes at a time.
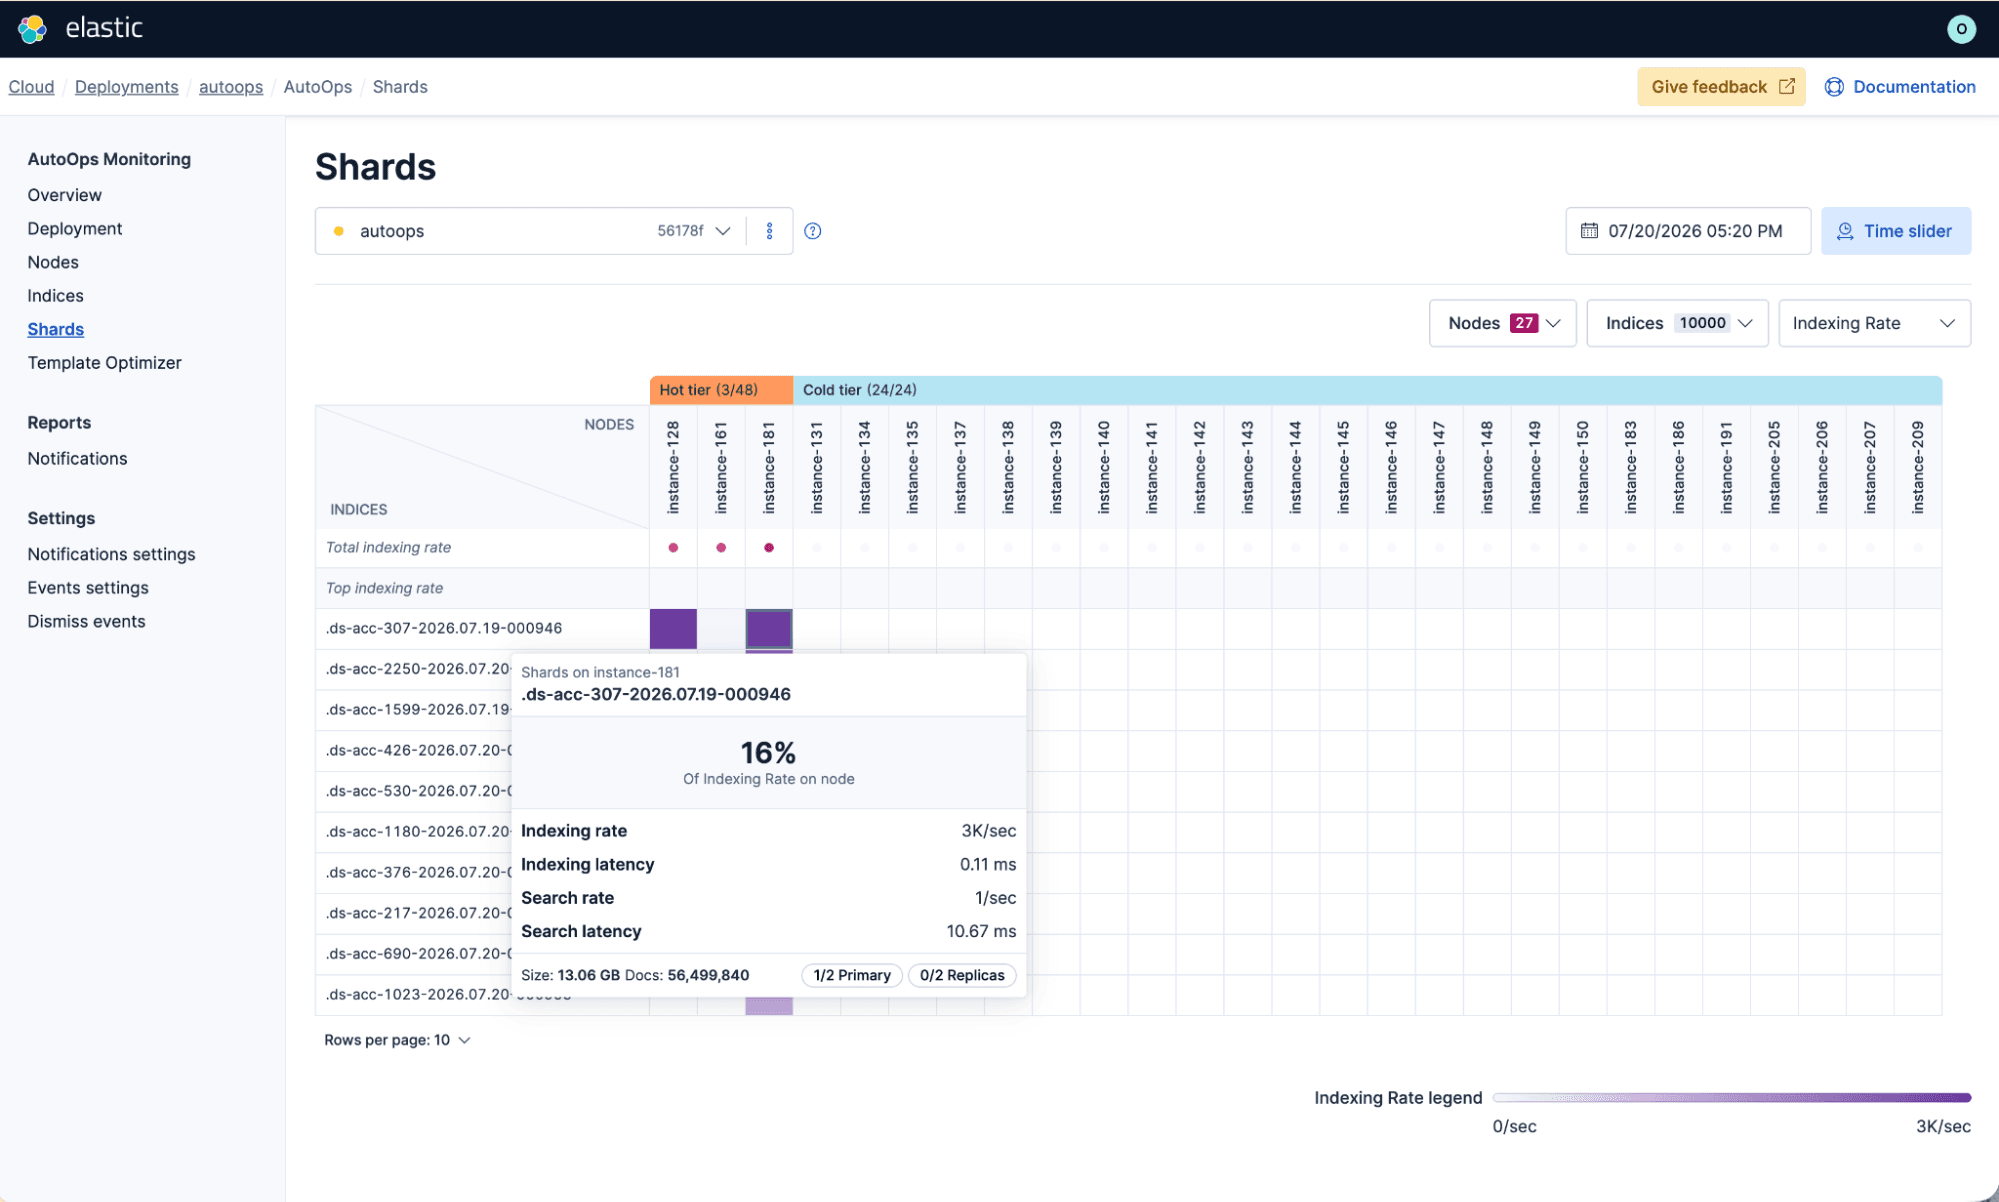
"Shards view consolidates controls and uses native Elastic UI components for time-range selection."
Index view keeps the Indices table experience you already use, including sorting, time-range brushing, and chart zoom behavior tuned for meaningful ranges.
Template Optimizer
The Template Optimizer now provides a searchable list of templates ordered by the most recently identified recommendations. You can open each recommendation directly or expand the JSON panel to inspect the complete template.
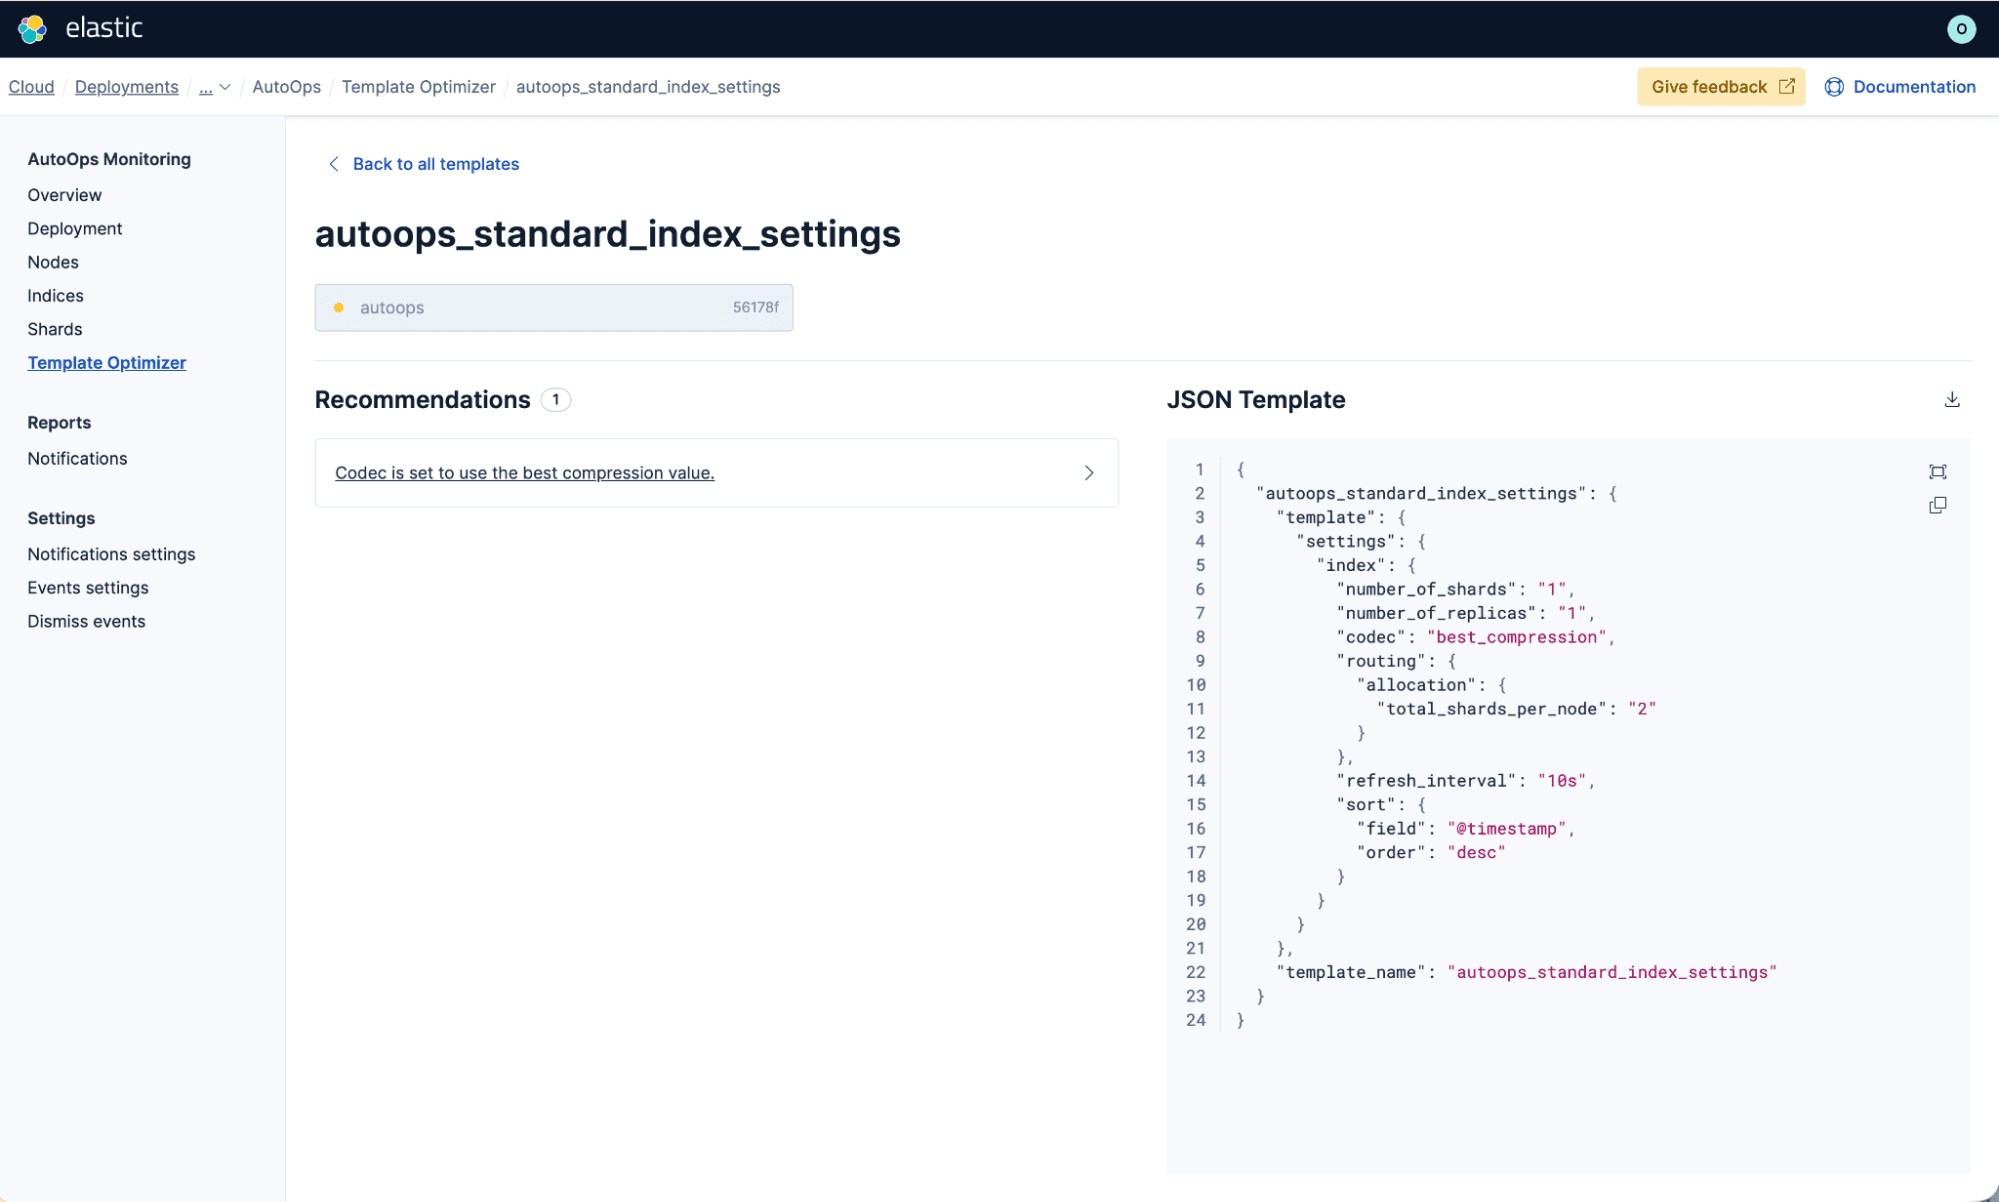
"Template optimizer shows list of templates based on last found issues and improved search abilities."
Configure notifications and event settings
Notification settings now include connector search, clearer filters, and a simpler connector editing flow. Event settings moved from a popup to a flyout, matching the pattern used across AutoOps. Notification reports retain the same 10-day history window with minor layout updates, and dismiss events use updated confirmation components aligned with Elastic UI.
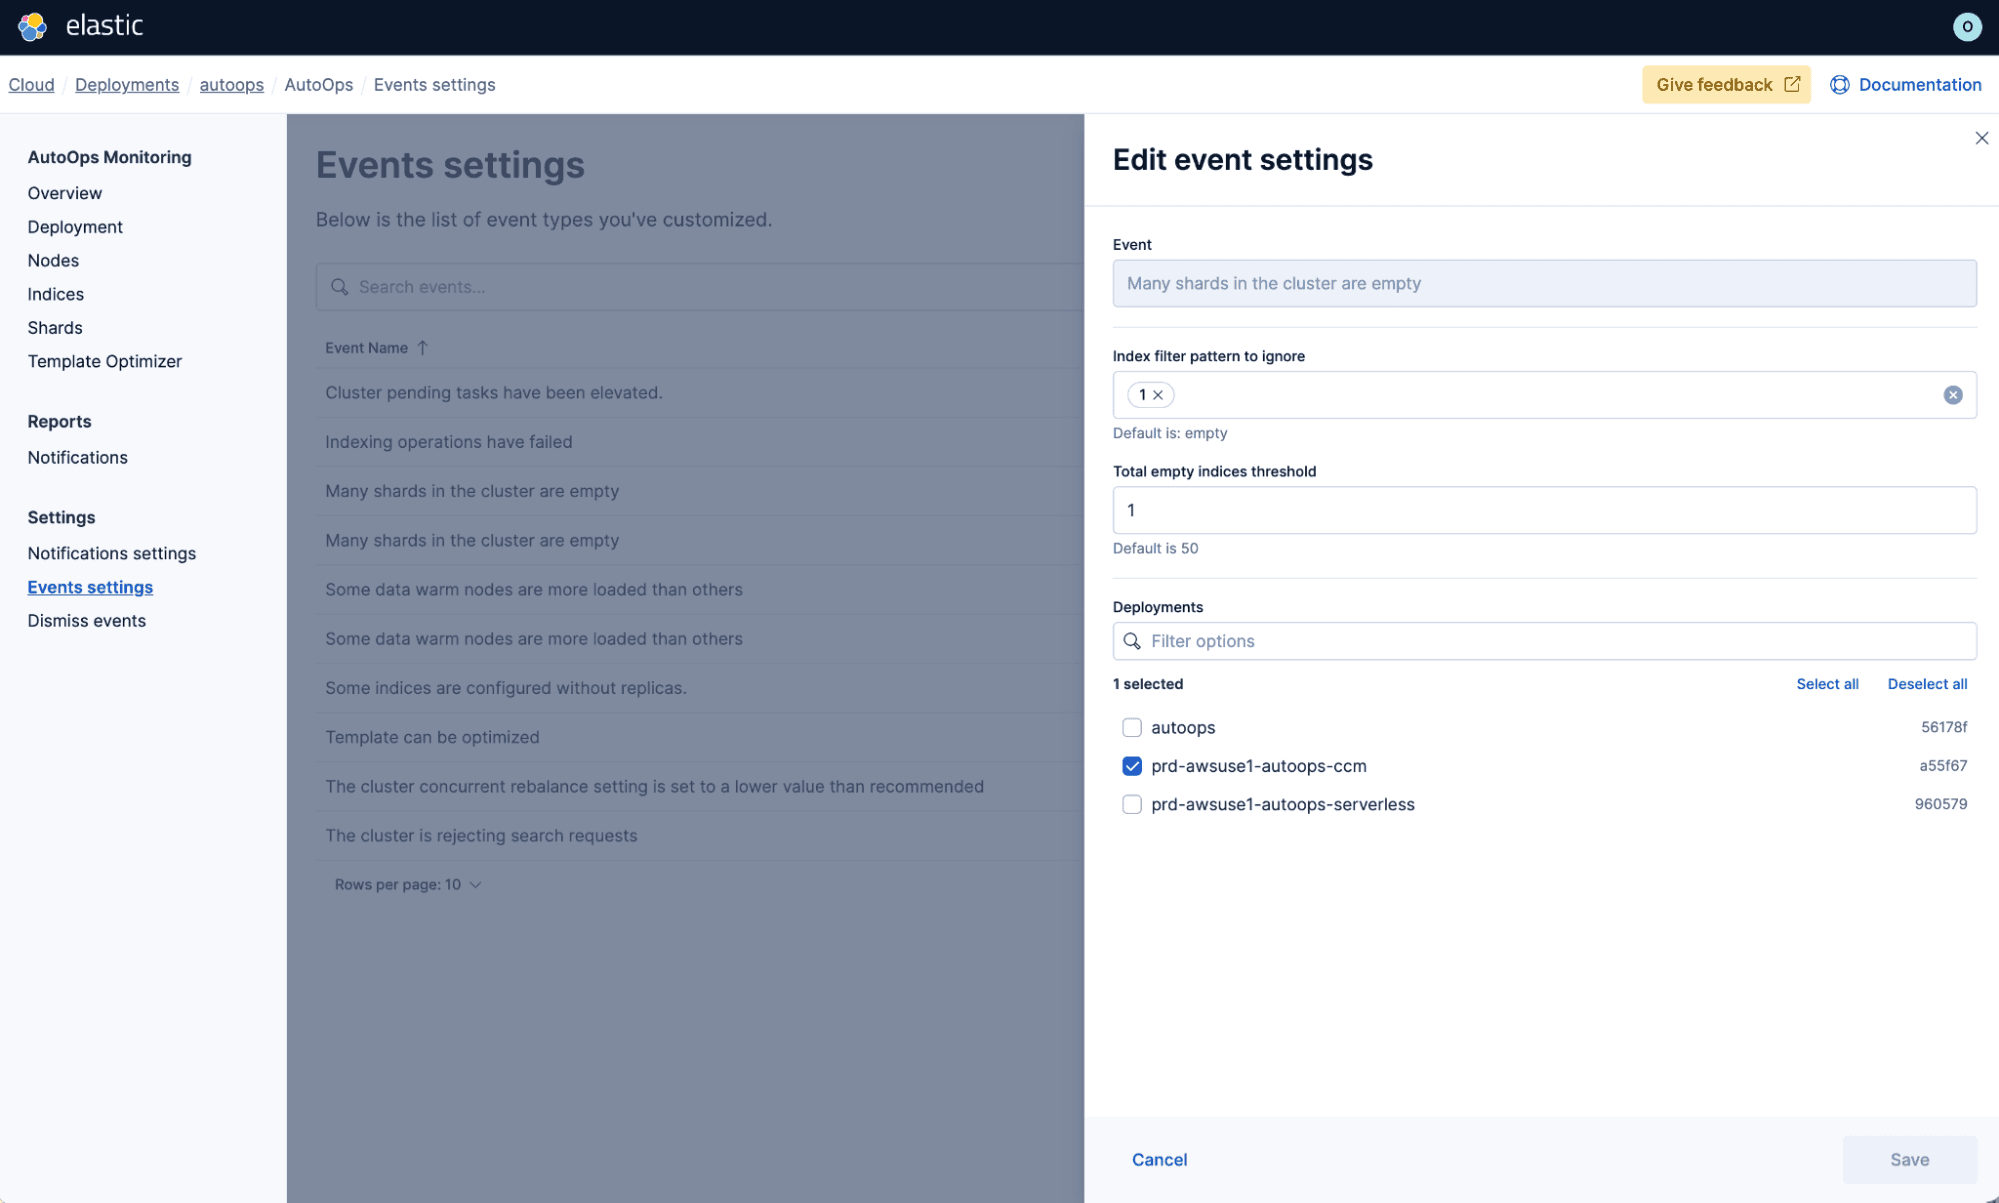
"Event settings with easier navigation and applying customization across multiple clusters”
Navigation and controls
The deployment picker now shows deployment ID and real-time cluster status, with copy actions for deployment name and ID in the dropdown sub-menu. Node selection supports select-all, select-by-tier grouping, and clear master node indication. The date picker follows the same relative-range and custom-range model used in Kibana and other Cloud Console monitoring views.
AutoOps roadmap: API, MCP, CLI, and agentic experience
Looking ahead, we are building toward a headless, agentic AutoOps experience. A forthcoming public AutoOps API will make insights and raw metrics available outside the AutoOps interface. Administrators and agents will be able to query the API directly or store its data in Elasticsearch. The API will also provide the foundation for integrations with MCP, Elastic Agent Builder, the Elastic CLI, Kibana, and native AutoOps chat.
- Hosted MCP server: Make AutoOps insights available to MCP clients such as Claude and Cursor.
- Native Elastic Agent Builder tool: Use AutoOps insights in Elastic Agent Builder.
- Elastic CLI support: Access the AutoOps API through the Elastic CLI.
- AutoOps in Kibana: Surface relevant insights and metrics within Kibana.
- Native AutoOps chat: Investigate cluster issues through an agentic chat experience within AutoOps UI in Elastic Cloud Console.
The application redesign is the foundation; these surfaces will meet operators where automation and AI already live. Read more about what is coming on the Elastic public roadmap.
How to start using the redesigned AutoOps in Elastic Cloud Console
Sign in to Elastic Cloud Console, open a deployment, project, or connected cluster, and select AutoOps from the navigation. Learn more in the AutoOps documentation.
The release and timing of any features or functionality described in this post remain at Elastic's sole discretion. Any features or functionality not currently available may not be delivered on time or at all.
Related Content
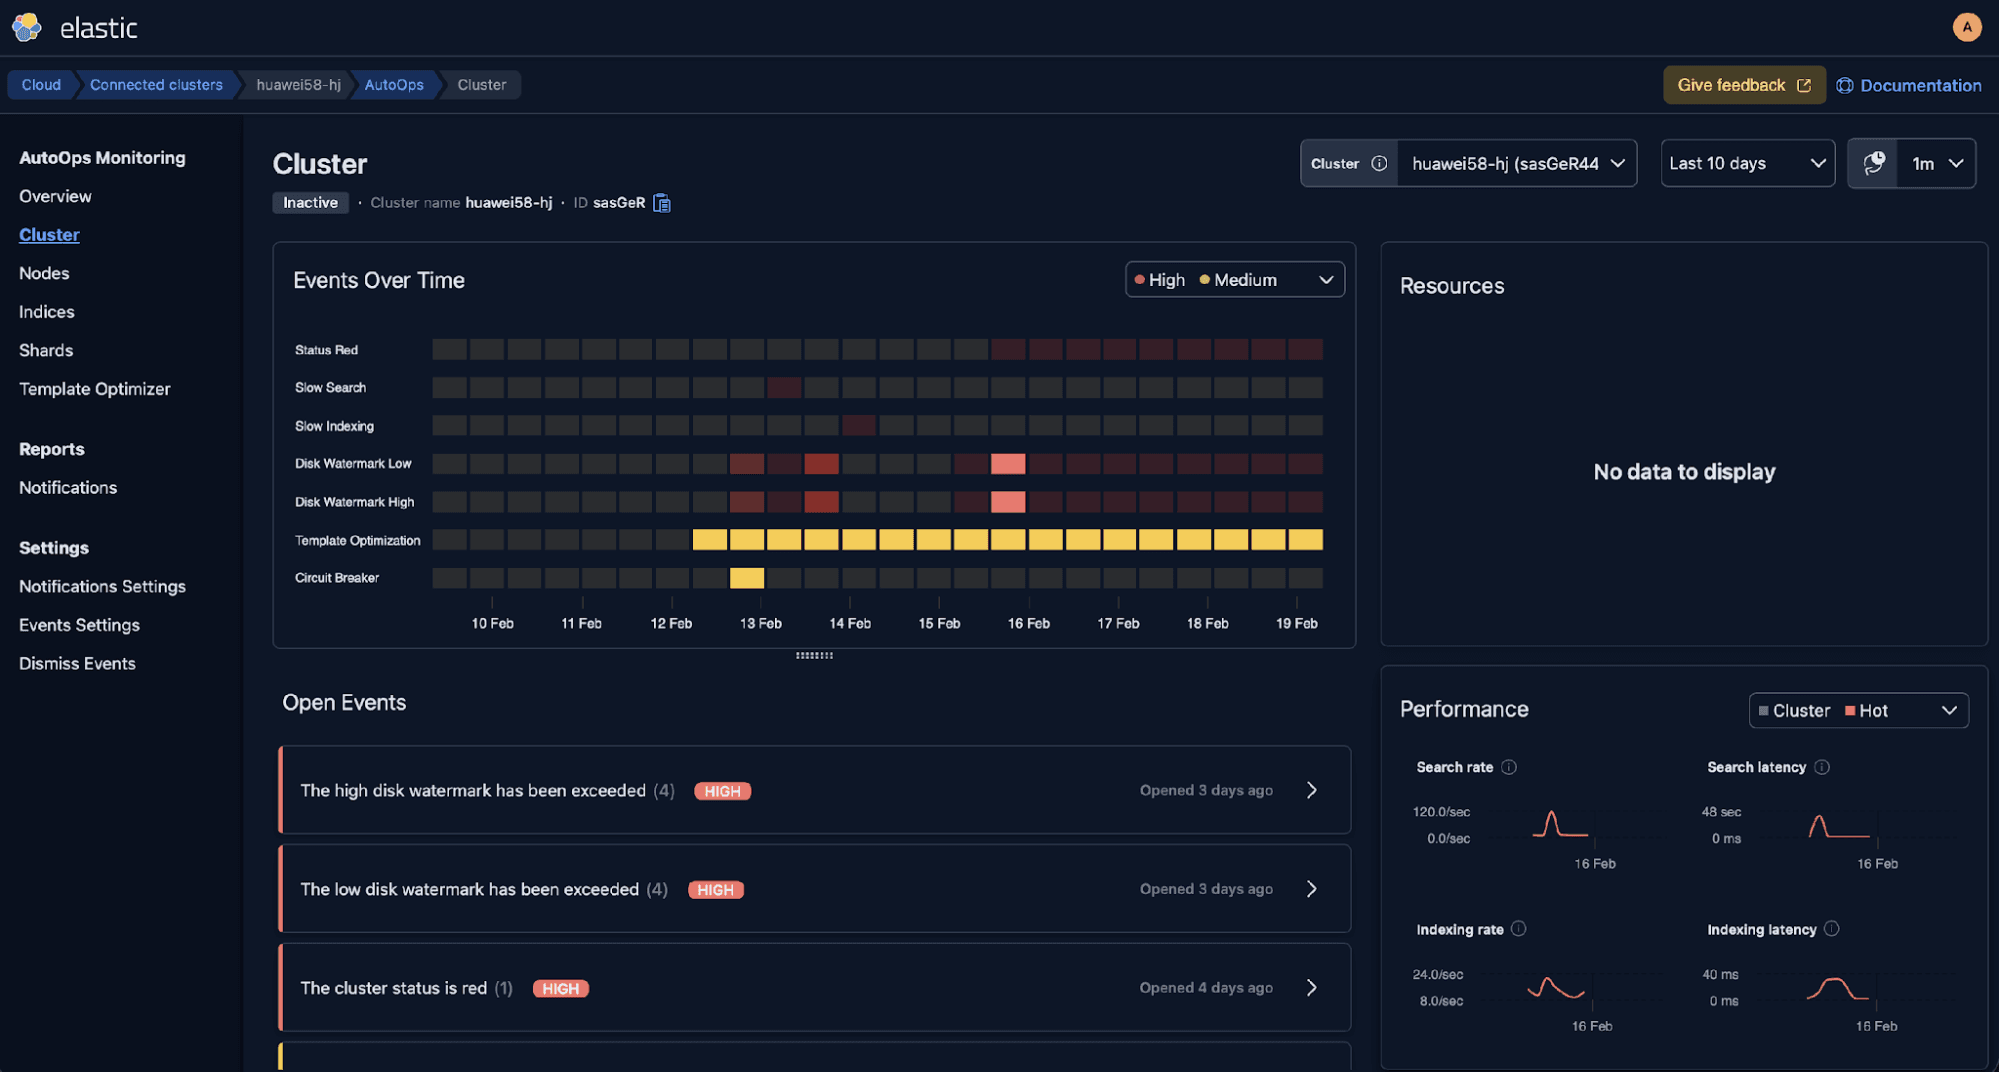
July 15, 2026
98.9% faster queries, 4x more indexing throughput: a systematic Elasticsearch performance diagnosis
Use AutoOps, the Profile API and ES Rally together to find cluster hotspots, slow queries and index bottlenecks, with real benchmarks showing a 98.9% latency cut and 4x indexing gain.

July 7, 2026
Your compliance posture just got an upgrade: Elasticsearch now supports FIPS 140-3
Elastic 9.4 brings FIPS 140-3 support for Elasticsearch and Kibana to GA. Here's what changes for federal, defense and regulated deployments, and how to migrate from 140-2.

June 19, 2026
Why your Elasticsearch cluster is hitting disk watermarks: 14 real-world causes explained
Learn how Elasticsearch disk watermarks work, why they trigger, and how to diagnose 14 of the most common scenarios Support encounters, from index bloat to ILM stalls.
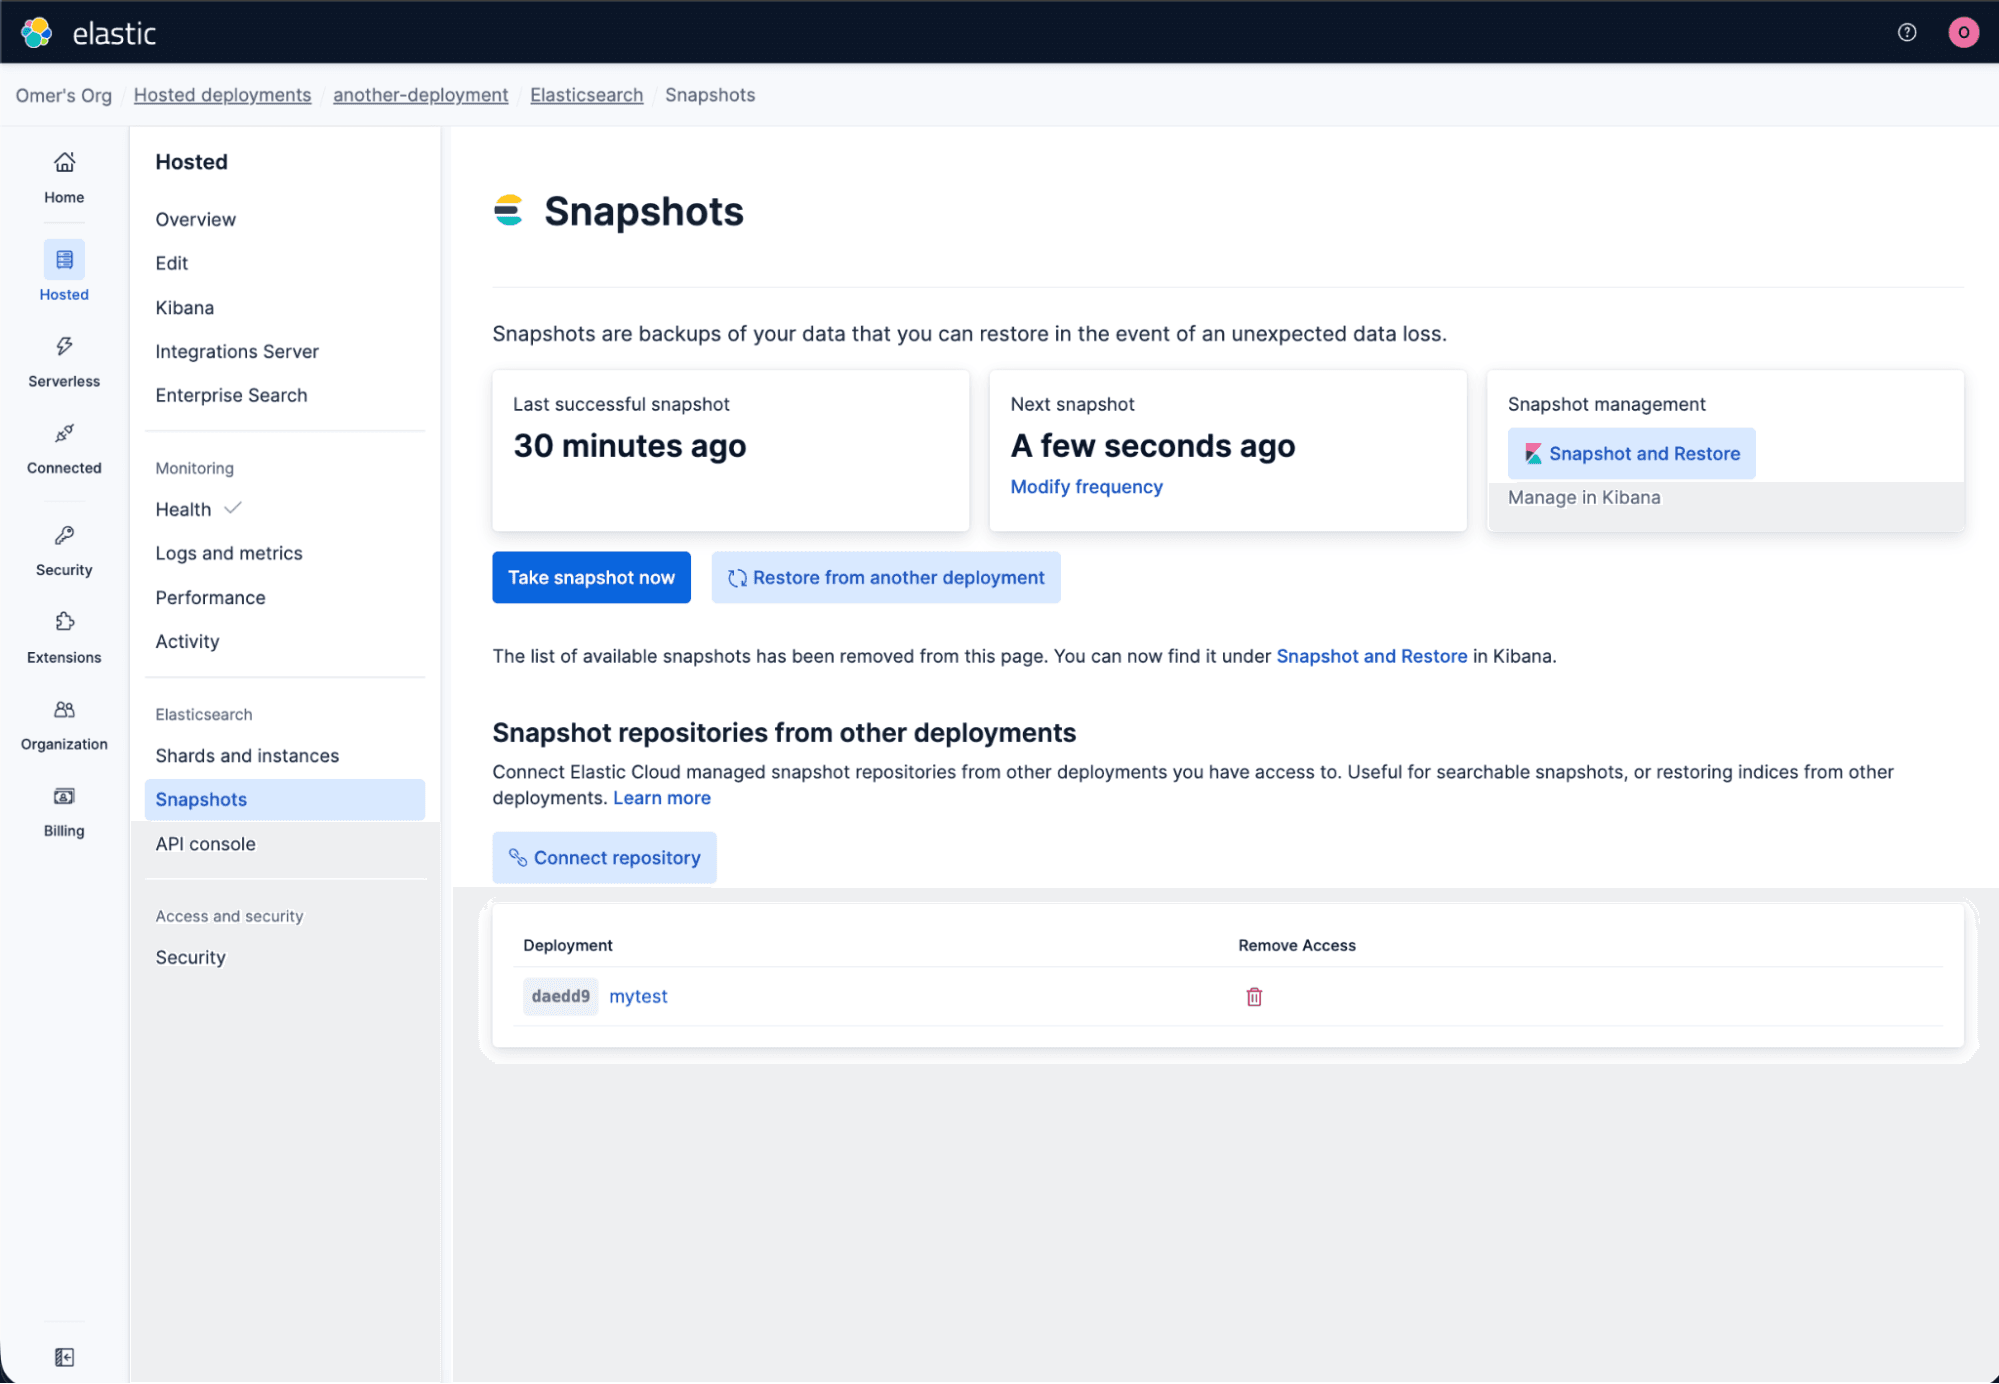
May 29, 2026
One API call per operation: how Elastic Cloud Hosted makes fleet-scale deployment management practical
Elastic Cloud Hosted adds five targeted APIs for upgrade, tier scaling, user settings, tags and snapshot repository linking, each replacing a multi-step deployment plan edit with a single focused call.
May 18, 2026
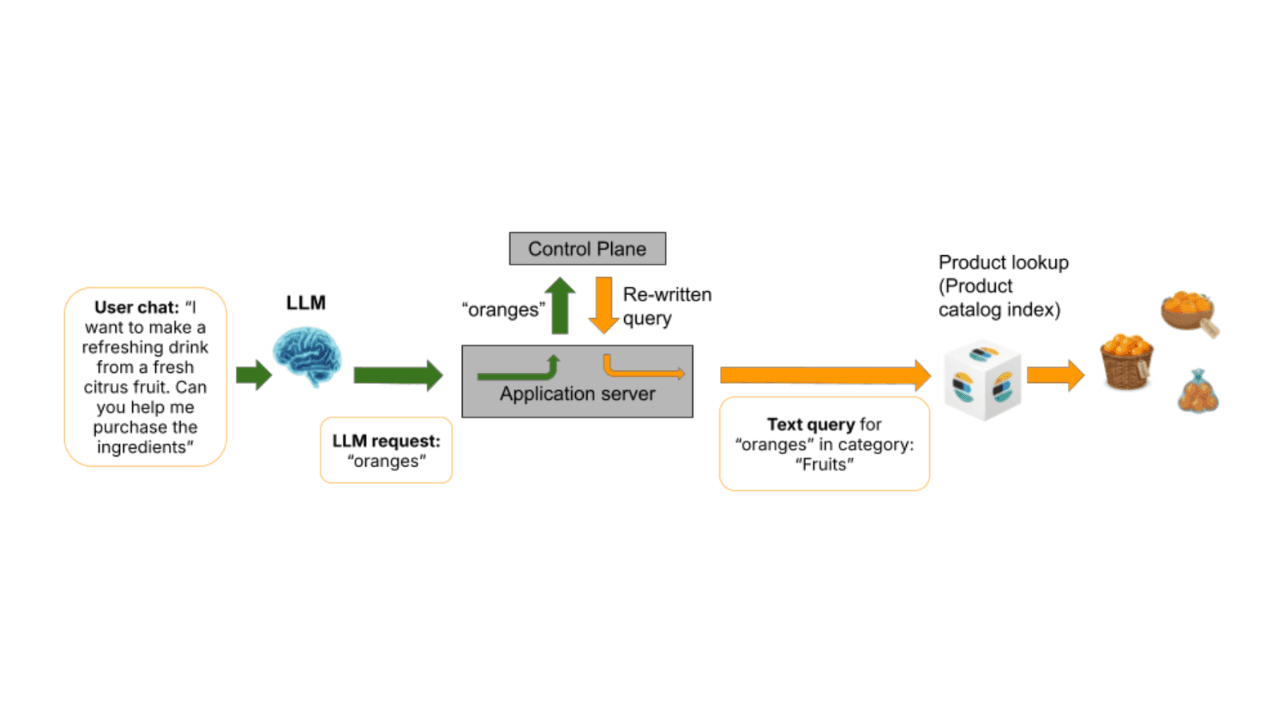
Agentic AI search with deterministic guardrails in Elasticsearch for safe query execution
Agentic AI search systems often fail when LLMs generate queries directly. Learn how deterministic guardrails and a control plane architecture enable safe, reliable, and governed query execution with Elasticsearch.