Test Elastic's leading-edge, out-of-the-box capabilities. Dive into our sample notebooks in the Elasticsearch Labs repo, start a free cloud trial, or try Elastic on your local machine now.
Your dashboard times out and CPU spikes, but which query actually ran? Slow logs give you one line per shard; Elasticsearch query logs give you one JSON line per request, with the same end-to-end duration as the took you already trust from the API. That single line also captures full query text for ES|QL, DSL, SQL, and EQL, outcomes, tracing, optional user context, and cross-cluster hints when relevant.
They’re ECS-aligned, ready for Discover and out-of-the-box dashboards once you ship the log, no custom schema project. Below: why we built this, how it differs from slow logs, what each line contains, and how to turn it on.
Why we built this (you asked, a lot!)
Coordinator-level query logging has been a very popular request; we listened and delivered! The same pain kept showing up: You want the response duration for Service Level Objectives (SLOs) and dashboards. You want to know the execution time of queries executed in your cluster, and you want to be able to see the full query.
If using cross-cluster search, a search that fans out across clusters looks like one operation from the app or Kibana, but operationally it’s a chain of work: coordination, remote execution, merges, timeouts, and partial results. When something is slow or flaky, teams need to know not only how long the request took but also which clusters contributed and whether the outcome was success, partial, or a hard failure.
What you get: One log stream, one entry per query! Every entry has the coordinator duration (the very same took time that actually matches your search API response), success or failure, and the full query text. Elastic Common Schema–compliant (ECS) JSON, optional duration threshold and user/audit fields, plus X-Opaque-Id that lets you trace a hot query back to the saved object it originates from, and the trace ID so you can correlate with Kibana or your own tooling.
What’s more: Logs follow a stable, ECS-aligned schema, which means you don’t need to design your own ingestion pipelines or field mappings. This consistency enables out-of-the-box dashboards and analytics that work immediately once logs are shipped.
Slow logs vs. query logs: The 30-second version
Slow logs have been the go-to tool for years. They tell you which search operation is slow, but they emit one line per shard that took part, where each line reflects that shard’s piece of the work. This means that they don’t provide a single row that says how long the query execution took, from the client’s perspective. Query logs do exactly that: one line per query, with the end-to-end (wall clock) duration that lines up with the took time in the search API response. This makes them much better suited for understanding workload patterns and identifying problematic queries quickly.
Slow and query logs also differ in when they fire and what they cover. Slow logs only write when a shard’s slice breaches a duration threshold; that is, you’re optimized for “show me unusually slow shard work.” Query logs can record every query (or only those above a configurable threshold you set at the cluster level), so you can tune volume for analytics versus troubleshooting. Slow logs only support DSL queries, while query logs cover ES|QL, DSL, SQL, and EQL, which matches how you reason about “what ran on my cluster” in a modern stack. Both provide the same support in terms of correlation with headers, traces, and audit information (when you turn on user context).
The table below summarizes the main differences between the historical slow logs and the new query logs features.
| Slow logs | Query logs | |
|---|---|---|
| What they’re for | Finding hot shards / slow index operations on specific indices and classic performance tuning inside one cluster. | Understanding what query ran, how long the operation took end to end from the coordinator, and whether it succeeded, which is better for SLOs, analytics, and incident investigations. |
| Granularity | Per shard (and per phase) for searching slow logs: One user search can produce many lines across shards/replicas. | Per coordinator-level query: One query maps to one log event. |
| Scope of work | Query + indexing | Query only; indexing will come soon. |
| What you learn | “This shard on this index exceeded N ms in query/fetch phase.” | “This query (full text), this duration, this outcome, and (when relevant) federation/cross-cluster summary fields.” |
| Query types | DSL only | ES|QL, DSL, SQL, and EQL |
| Threshold model | Often tiered (for example, multiple time thresholds per log levels) and per index. | Single duration gate at the cluster level (for example, “log if duration ≥ 500ms”) |
What you get in each log line
Every line is one JSON object (one request) in a dedicated file (for example, *_querylog.json under your Elasticsearch log directory). Below is what you can do with the data:
Did it succeed, how long did it take, and what broke? Outcome (whether the request was successful or not), duration (took / took_millis, in line with the API), and a clear failure or timeout when something goes wrong. That’s the core signal for alerting, SLOs, and dashboards: “Are we green? If not, what’s the error?” You also get how many rows or hits came back (result_count), so you can separate “slow but empty” from “slow and huge.”
What actually ran? Query type (esql, dsl, sql, eql) plus the full query text. That answers “Which dashboard rule, saved search, or client pattern is hammering us?” Mix it with duration and outcome to find the worst offenders to fix or throttle.
Who asked for it, and how do I trace it end to end? X-Opaque-Id and trace ID tie a line back to Kibana or your own headers. Task and optional parent task IDs help follow work that was enqueued or chained (async or nested operations).
Cross-cluster search: Who participated, and did anyone misbehave? When cross-cluster search (CCS) is in play, the log can carry remote cluster aliases, per-cluster duration, and status (successful, failed, partial, skipped). You can see at a glance whether a slow search was local or a specific remote dragging the response. DSL can also record that a search was served from a remote alias; ES|QL exposes the richer cluster map; EQL logs a lighter view (for example, which remotes and how many) when remotes are involved.
Security (optional). With elasticsearch.querylog.include.user, you get the usual identity and realm fields (plus effective user when run-as applies), and API key metadata when applicable. Pair with query text and duration for governance and capacity conversations that use names, not only IPs.
There’s more available than we covered here, including additional execution details, shard-level outcomes, and optional profiling information depending on the query type. For every field path and setting, see the Elasticsearch documentation on query logs.
Where the logs live (and how to use them)
Logs land in your Elasticsearch log directory as *_querylog.json (for example, mycluster_querylog.json) on the coordinating node. Ship them with the querylog fileset in the Filebeat Elasticsearch module, so you can then inspect them in Discover (filter by event.dataset: elasticsearch.querylog). On Elastic Cloud, you need to enable Logs on your deployment, and the query logs are shipped as soon as you enable them.
Two workflows. If you need a one-off look to find out who’s hammering the cluster, what the query mix is, or a quick audit, just turn logging on, set a duration threshold so you only log what matters (for example, ≥ 1 s or ≥ 5 min), and then turn it off when you’re done. If you want ongoing query analytics, simply enable logging, point Filebeat at the log, and open a dashboard on the monitoring cluster. Two very simple steps, enable + ship, and you’re done. One request per line, one duration per request, no custom pipeline.
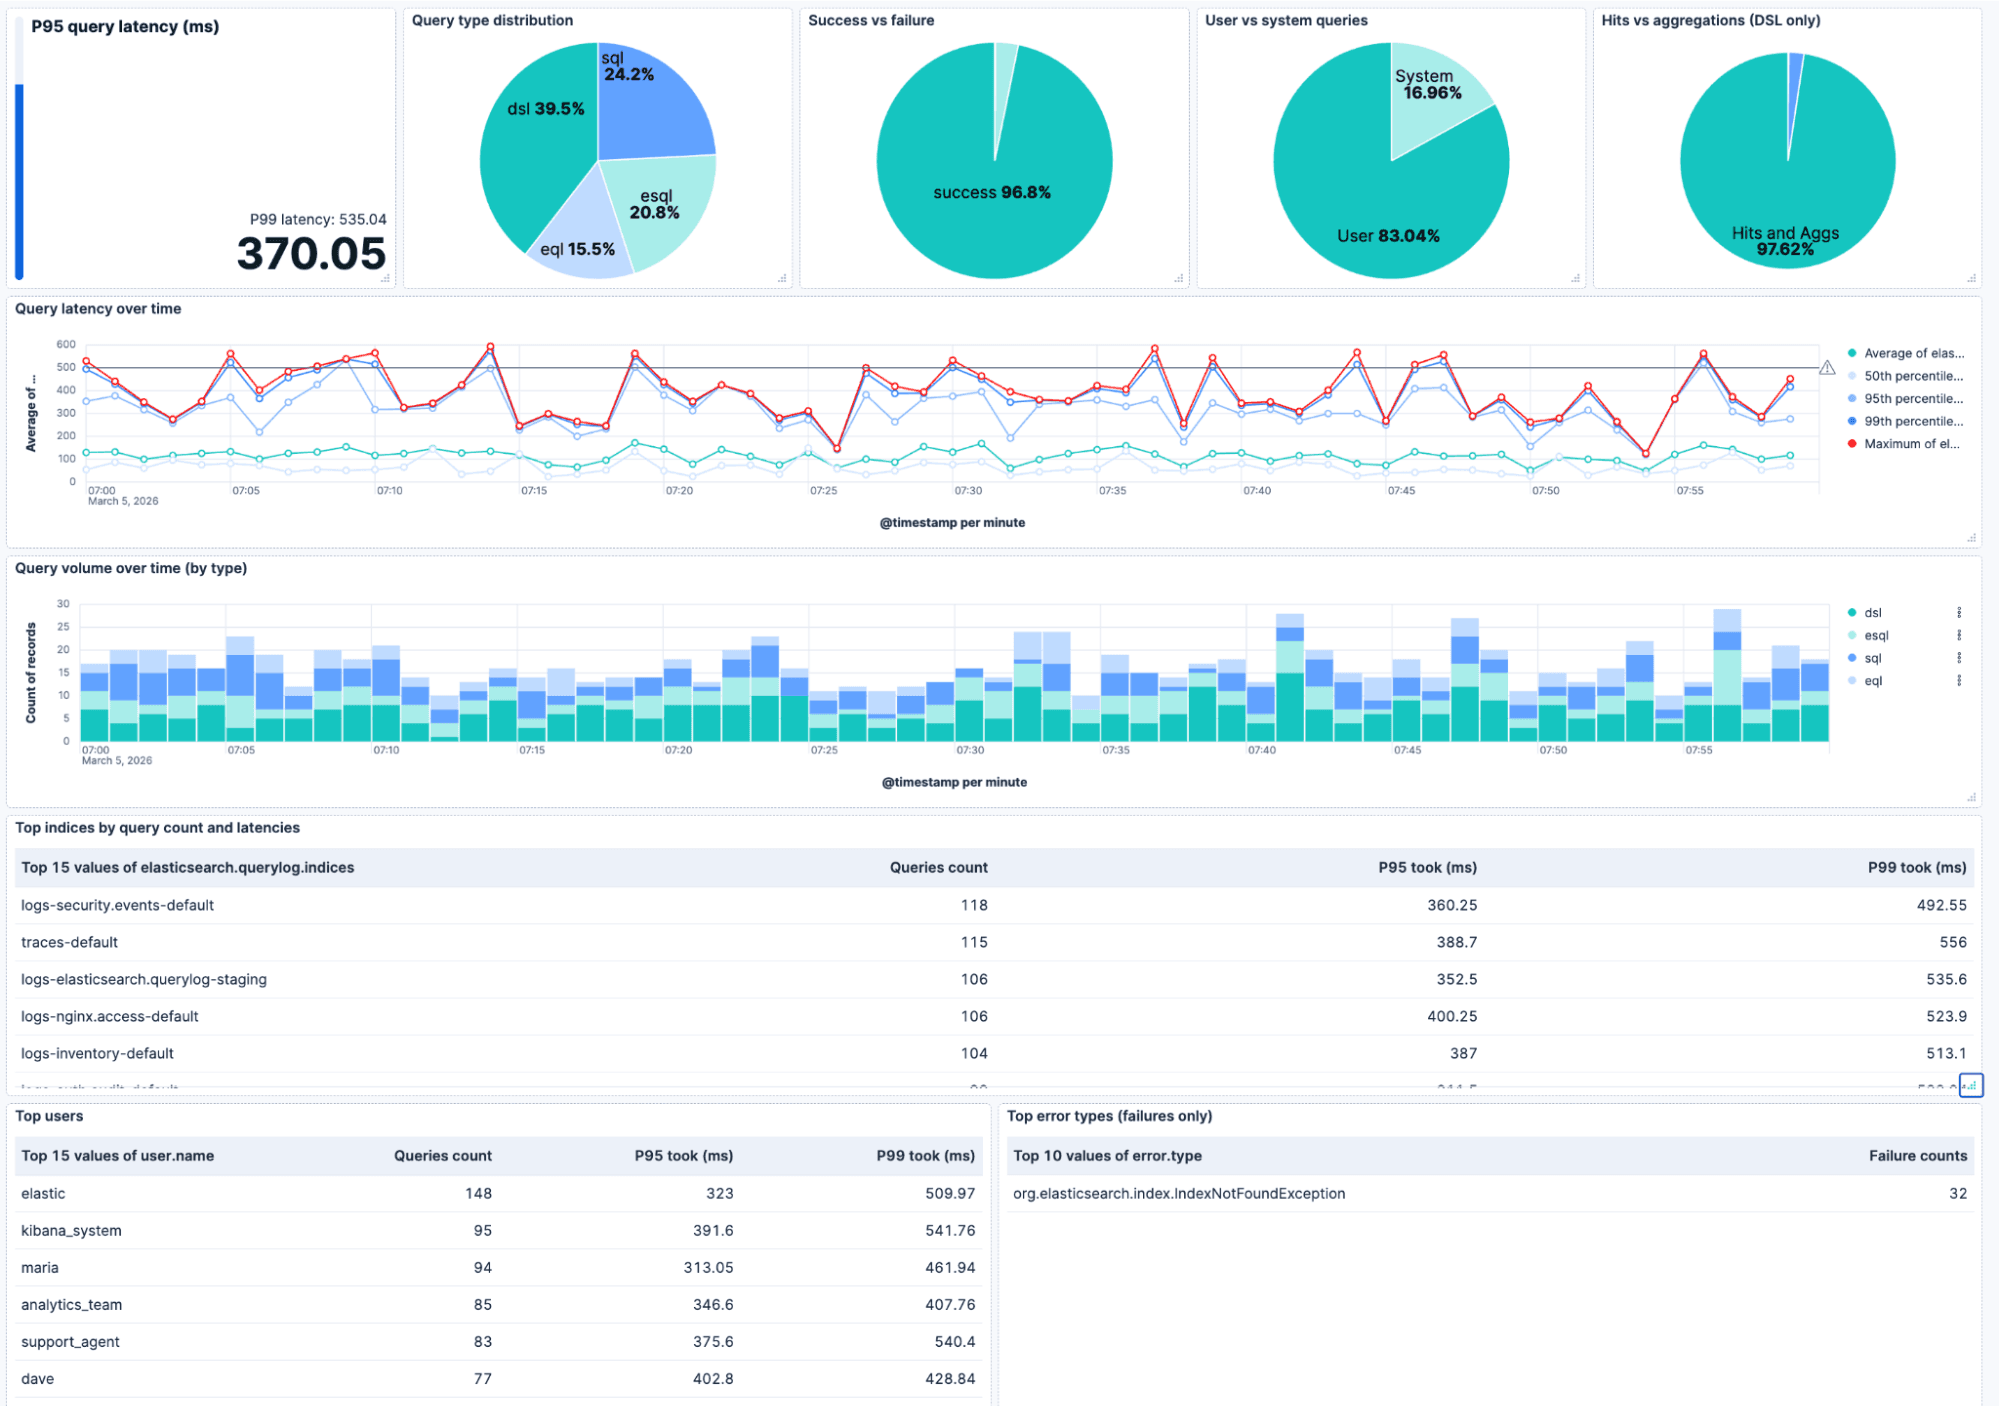
The dashboard below builds upon the new query logs and is provided out of the box. On the top row, you can find the P95/P99 query latencies (with an optional “acceptable latency” bar), the query type breakdown, the success and failure ratio, the user and system queries ratio, and (for DSL) hits versus aggregations. Underneath that, the latency over time (avg, p50, p95, p99, max) with a reference line so you can spot regressions, query volume over time (stacked by type), and tables for top indices, top users, and top error types. Filtering for cluster, user, or index lets you zoom into exactly what you want to focus on.
Heads up. Logging of queries is asynchronous, so it doesn’t block the query execution. Use the duration threshold to cap volume. Also worth noting that at very high queries per second (QPS), we may drop some lines rather than slow your cluster down. For analytics, shipping to a separate monitoring cluster keeps the cluster you’re debugging from taking the extra load.
Some configuration and code samples
Query logging is off by default. Flip it on in elasticsearch.yml or via the cluster settings API. Here’s how.
Enable query logging
In elasticsearch.yml:
Or dynamically via the cluster settings API:
Only log queries above a duration threshold
If you don’t want to log every health check or tiny request, simply set a threshold so only queries that run at least this long get an entry. Duration is in time units:
Include user/audit information
If you use the Security plugin and want to see who ran each query:
Log DSL searches that hit only system indices
By default, searches that target only system indices aren’t logged. To include them, enable query logging and set:
Example log entries
One line = one JSON object = one request with the same shape for ES|QL, DSL, SQL, EQL. Below: a successful DSL search and a failed EQL query with timestamp, duration, query type, and full query. On success, you get result count and shard stats, on failure an error block. User-inclusion and X-Opaque-Id show up when you’ve enabled them.
Success (DSL search):
Failure (EQL query):
Wrapping up
Elasticsearch query logs provide you with one single coordinator-level log for every query (ES|QL, DSL, SQL, EQL). One line per request, coordinator duration, full query, optional user and X-Opaque-Id. Enable it, set a duration threshold and user-inclusion if you want them, and you’re done. Logs live in your log dir (*_querylog.json), and when shipped with Filebeat, you can find them in Discover under the elasticsearch.querylog dataset.
Head to the Elasticsearch documentation on query logs for the full list of configuration settings, and field references. Slow or broken queries can also be found in AutoOps, which leverages the X-Opaque-Id to tie a long-running search back to its origin, such as a dashboard, a saved search, or an alerting rule.
Finally, it’s also worth noting that this new query log is an evolution of the ES|QL-only query log that we released in 9.2. We recommend adopting the new query log since it not only supports ES|QL queries, but also all your other queries.
Now, go see what’s actually running in your cluster.
Zugehörige Inhalte

9. Juli 2026
Why Elasticsearch is becoming a columnar database
Elasticsearch is becoming a first-class columnar database. Columnar Mode ships in 9.5, storing data once alongside the existing modes and cutting storage footprints while speeding up analytical queries.

7. Juli 2026
Your compliance posture just got an upgrade: Elasticsearch now supports FIPS 140-3
Elastic 9.4 brings FIPS 140-3 support for Elasticsearch and Kibana to GA. Here's what changes for federal, defense and regulated deployments, and how to migrate from 140-2.

2. Juli 2026
A simdvec deep-dive: How Elasticsearch uses neural-net and video-codec CPU instructions for vector search
Four ways Elasticsearch's vector search engine reuses neural-network, video-codec and cryptography CPU instructions for up to 6x speedups; with the math, the failed attempts and the benchmarks.

29. Juni 2026
Bringing it together: How we rebuilt Elasticsearch as a columnar metrics engine; 6.6x less storage, 160x faster queries
Elasticsearch metrics in version 9.4 run on a fully columnar engine: 6.6x less storage, 160x faster queries, native PromQL and OTel support.
25. Juni 2026
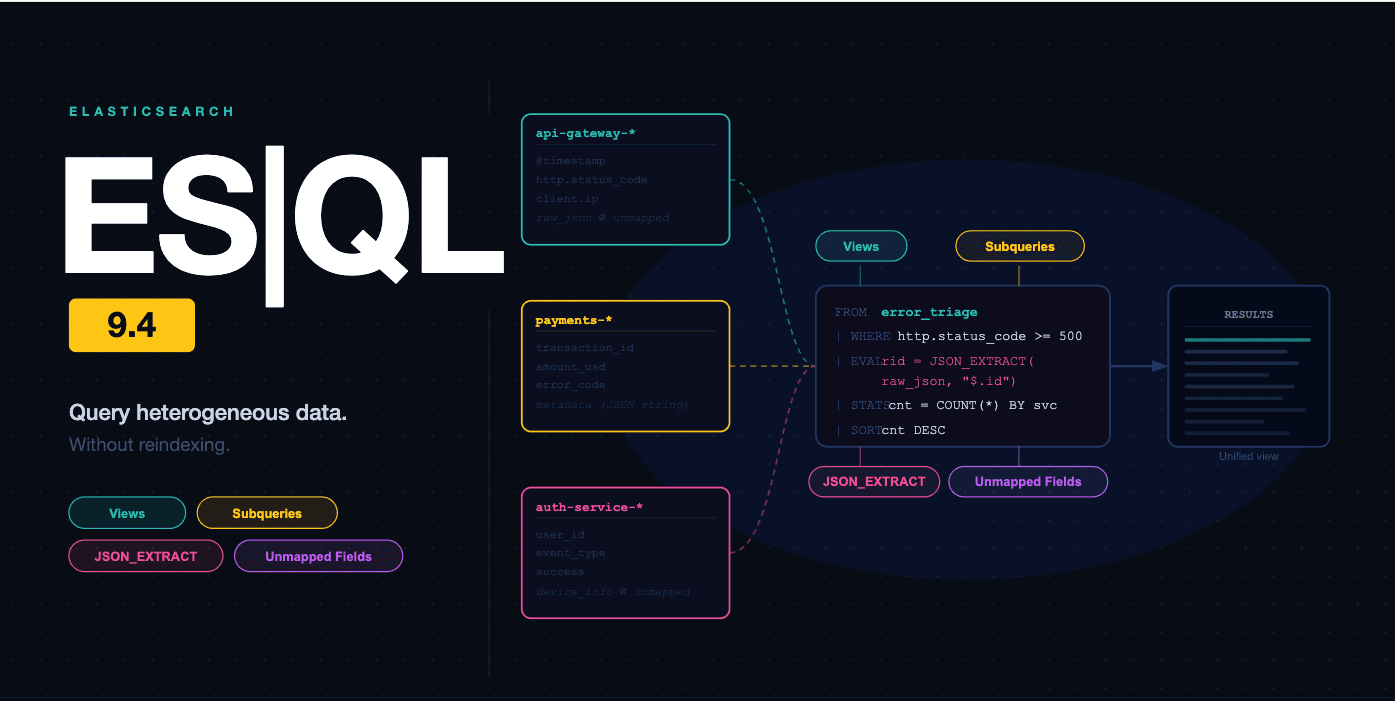
Elasticsearch ES|QL: Now with Views, Subqueries, and Schema-on-Read
Query fields you never mapped, combine indices with different schemas in one pipeline, and reuse query logic as named views. ES|QL's most significant data access expansion yet.