Try out vector search for yourself using this self-paced hands-on learning for Search AI. You can start a free cloud trial or try Elastic on your local machine now.
Elasticsearch DiskBBQ delivers up to 7x higher throughput than Qdrant at comparable recall, tested on network-attached persistent storage, the topology most managed-cloud deployments actually use. The gap is consistent across recall levels from 0.93 to 0.97, and it widens as recall increases. DiskBBQ keeps latency nearly flat as search breadth grows; Qdrant's latency rises sharply as hnsw_ef increases, driven by random reads of original vectors from disk during rescoring. If you're running vector search in Kubernetes or a managed cloud environment, this is what the tradeoff looks like.
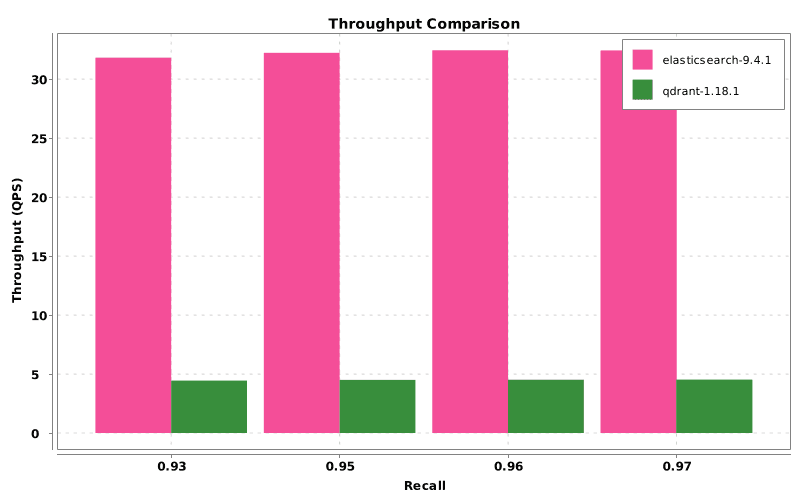
Graph 1: Throughput versus recall.
Vector search is a critical foundation for large language model (LLM) applications, retrieval augmented generation (RAG), and other AI workloads. In this benchmark, Elasticsearch achieved up to 7x higher throughput than Qdrant at comparable recall on the same storage topology. Elasticsearch as a vector database offers strong vector search performance even when network-attached persistent storage remains on the query path.
The difference reflects how the two systems interact with disk. Elasticsearch DiskBBQ is designed to keep vector search efficient when persistent storage remains on the query path, using a compact quantized representation and limiting costly access to full precision vectors during search. In this setup, Qdrant relies on a graph-based search path with rescoring against original vectors stored on disk. On network-attached persistent storage, that random access cost becomes much more significant, which is why the performance gap widens as recall increases. This benchmark therefore focuses specifically on network-attached persistent storage, a common deployment model in managed cloud and Kubernetes environments.
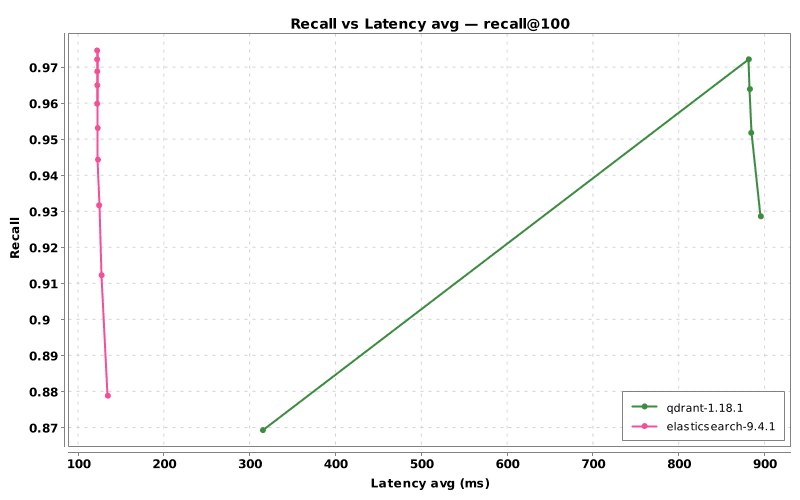
Graph 2: Recall versus average latency.
The key pattern in the latency curve is not only the size of the gap but also its shape. Elasticsearch latency remains comparatively flat as recall increases, suggesting that higher recall doesn’t require a dramatic increase in expensive storage activity. Qdrant’s latency rises sharply as hnsw_ef increases, which is consistent with broader candidate exploration leading to more rescoring work against original vectors on disk.
Full results table
The table below shows the full parameter sweep for both Elasticsearch and Qdrant. Because the two engines expose different tuning controls for vector search, the results are reported using each engine’s full parameter key rather than attempting a one-to-one mapping between settings.
A few notes on the metrics:
- ParamKey: The complete parameter setting used for a given run.
- Recall: Recall@100 against a ground-truth top-100 result set for the benchmark queries. Values range from 0 to 1, and higher is better.
- Latency_Avg: The average end-to-end latency per query measured from the benchmarking client across the full run, in milliseconds. Lower is better.
- Latency_P95: The 95th percentile query latency, in milliseconds, showing the upper range of typical slow queries. Lower is better.
- Throughput: The average number of queries processed per second across the full run. Higher is better.
| Engine | ParamKey | Recall | Latency_Avg | Latency_P95 | Throughput |
|---|---|---|---|---|---|
| qdrant | hnsw_ef=50, oversampling=1, size=100 | 0.8694 | 315.7849 | 503.4754 | 12.629 |
| elasticsearch | k=100, oversample=1, size=100, visit_percentage=1 | 0.8789 | 135.0802 | 218.494 | 29.343 |
| elasticsearch | k=100, oversample=1, size=100, visit_percentage=1.5 | 0.9123 | 127.8286 | 195.2318 | 31.1107 |
| qdrant | hnsw_ef=100, oversampling=1, size=100 | 0.9287 | 895.9933 | 1213.0448 | 4.4493 |
| elasticsearch | k=100, oversample=1, size=100, visit_percentage=2 | 0.9317 | 124.846 | 183.6314 | 31.8225 |
| elasticsearch | k=100, oversample=1, size=100, visit_percentage=2.5 | 0.9444 | 123.517 | 180.4831 | 32.1883 |
| qdrant | hnsw_ef=150, oversampling=1, size=100 | 0.9518 | 884.7236 | 1195.2603 | 4.5066 |
| elasticsearch | k=100, oversample=1, size=100, visit_percentage=3 | 0.9532 | 123.276 | 183.8379 | 32.2364 |
| elasticsearch | k=100, oversample=1, size=100, visit_percentage=3.5 | 0.9599 | 122.5559 | 184.2858 | 32.4469 |
| qdrant | hnsw_ef=200, oversampling=1, size=100 | 0.964 | 883.2114 | 1188.6597 | 4.5143 |
| elasticsearch | k=100, oversample=1, size=100, visit_percentage=4 | 0.965 | 122.7946 | 184.9058 | 32.3635 |
| elasticsearch | k=100, oversample=1, size=100, visit_percentage=4.5 | 0.9689 | 122.7062 | 182.9559 | 32.3976 |
| elasticsearch | k=100, oversample=1, size=100, visit_percentage=5 | 0.9722 | 122.5761 | 187.3536 | 32.4221 |
| qdrant | hnsw_ef=256, oversampling=1, size=100 | 0.9722 | 881.9643 | 1185.4948 | 4.5192 |
| elasticsearch | k=100, oversample=1, size=100, visit_percentage=5.5 | 0.9747 | 122.5609 | 184.5128 | 32.4176 |
Each row pairs the closest measured Elasticsearch and Qdrant configurations in the sweep by achieved recall.
Matched comparisons at similar recall
To make the comparison fair, speedup is calculated only between configurations that achieve similar recall. This avoids comparing settings that trade off accuracy very differently.
| Recall band | Elasticsearch recall | Elasticsearch Latency_Avg | Elasticsearch throughput | Qdrant recall | Qdrant Latency_Avg | Qdrant throughput | Throughput speedup |
|---|---|---|---|---|---|---|---|
| ~0.87 | 0.8789 | 135.0802 | 29.343 | 0.8694 | 315.7849 | 12.629 | 2.32x |
| ~0.93 | 0.9317 | 124.846 | 31.8225 | 0.9287 | 895.9933 | 4.4493 | 7.15x |
| ~0.95 | 0.9532 | 123.276 | 32.2364 | 0.9518 | 884.7236 | 4.5066 | 7.15x |
| ~0.96 | 0.9599 | 122.5559 | 32.4469 | 0.964 | 883.2114 | 4.5143 | 7.19x |
| ~0.97 | 0.9722 | 122.5761 | 32.4221 | 0.9722 | 881.9643 | 4.5192 | 7.17x |
This matched-recall view is the clearest expression of the underlying systems difference. At similar recall levels, Elasticsearch delivers both lower latency and much higher throughput, and the gap widens as recall rises. The recall-throughput pattern matters because higher recall in this benchmark requires broader search. DiskBBQ absorbs that increase with relatively little additional cost, while Qdrant’s graph plus rescoring path becomes much more constrained by random access to original vectors on persistent storage.
Benchmark methodology
Jingra, the benchmarking tool used for these tests, was originally written in Python and has since been rebuilt as a Java project. For these tests, Jingra runs in a Kubernetes pod within the same cluster as the engine being measured. This helps reduce external network variability and keeps the test environment consistent across runs. For each run, Jingra executed the query set at a fixed client concurrency, recorded end-to-end client-side latency and throughput, and computed recall against a precomputed ground-truth top-100 set.
This benchmark was intentionally run on network-attached persistent storage rather than local NVMe. For the published results, the storage used the baseline performance allocation for a 200 GiB GCP Hyperdisk Balanced volume, with no explicit IOPS or throughput provisioning. We chose this topology on purpose because it’s a relevant cloud deployment model and because it keeps storage efficiency materially on the query path.
Qdrant often performs better on local NVMe, so deployments using local NVMe should expect different results than the ones shown here. This benchmark specifically tests network-attached persistent storage because that’s a common managed-cloud deployment model and because it makes storage-path efficiency visible in end-to-end query performance.
Because Elasticsearch and Qdrant expose different query parameters for controlling vector search behavior, there’s no clean one-to-one mapping between their tuning settings. Instead of comparing equivalent parameter values directly, we use recall as the primary point of comparison. The matched comparisons below therefore pair configurations that achieve similar recall, rather than configurations with superficially similar parameter values.
Recall cannot be known in advance for a given parameter setting, so we sweep across a range of search configurations for each engine and then compare results at similar recall levels. In the published results, oversampling was fixed at 1 for both engines so that recall was primarily tuned via search breadth rather than rescoring expansion.
How does Elasticsearch configure vector search?
query_vector: The input vector used for similarity search. Elasticsearch compares this vector against the stored vectors in the field.k: The number of nearest neighbors to retrieve.visit_percentage: Controls how much of the DiskBBQ, Elasticsearch’s disk optimized vector index, is explored during the approximate search phase. Higher values usually improve recall but increase latency.oversample: Controls how many extra candidate vectors are passed into rescoring relative to k. Higher values can improve recall, but usually at additional cost.size: The number of hits returned in the final response._source: false: Disables returning the document _source field, reducing response size and avoiding extra retrieval overhead during benchmarking.
Example
Params
We keep k = size = 100 so the search request is aligned with the benchmark target: returning the top 100 results. To improve recall, we tune visit_percentage rather than inflating the final result count, while keeping oversample = 1 fixed across runs.
How does Qdrant configure vector search?
query_vector / vector: The input vector used for similarity search. Qdrant compares this vector against the stored vectors in the collection.size / limit: The number of nearest neighbor results returned in the response.with_payload: false: Disables returning payload fields, reducing response size and avoiding additional retrieval overhead during benchmarking.with_vector: false: Disables returning stored vectors in the response, again reducing response size and keeping the benchmark focused on search performance.- hnsw_ef: Controls the number of candidates explored during HNSW search. Higher values usually improve recall but increase latency. Like visit_percentage in Elasticsearch, it affects search breadth, but the two controls are engine-specific and not directly equivalent.
quantization.rescore: true: Enables rescoring of the candidate set using the original vectors after quantized search.oversampling: Controls how many extra candidates are considered during rescoring relative to the final result count. Higher values can improve recall, but usually at additional cost.
Example
Params
We keep size = 100 so that each request is aligned with the evaluation target, in this case top 100 retrieval. Recall is then tuned by sweeping hnsw_ef, which controls how many candidates are explored during search. Higher hnsw_ef values generally improve recall but also increase latency and reduce throughput. We keep oversampling = 1 fixed across runs so that the main tuning variable is the search breadth rather than the rescoring expansion.
Cluster setup and DiskBBQ configuration
We ran the benchmark on GCP using three n4-standard-8 nodes, with each pod allocated 7 vCPUs and 26 GB of RAM, and using 200 GiB GCP Hyperdisk Balanced volumes at baseline performance allocation. The corpus contains 21 million vectors, (see dataset section below for more details and download links), which account for about 60.1 GiB of raw float vector data. With 2-bit quantization, the vector payload drops to roughly 3.8 to 4.0 GB. However, the full index footprint is much larger once graph and other index structures are included. That means the workload remains meaningfully sensitive to network-attached storage performance, especially because exact vector values still need to be read from disk during rescoring.
We chose this node size intentionally to keep the benchmark in a regime where network-attached persistent storage remains on the query path rather than allowing the full working set to remain comfortably memory-resident. Each system was therefore configured using the best-performing setup we identified for this workload within the tuning scope described in this post. In Elasticsearch, this meant bbq_disk. In Qdrant, the original vectors were stored on disk, while the 2-bit quantized representation used for approximate search was kept in RAM with always_ram: true. Because the two systems expose different search strategies and tuning controls, we compare them at matched recall rather than trying to map parameters one to one.
Elasticsearch was configured to use DiskBBQ, its disk-optimized approach for approximate nearest neighbor vector search, with 2-bit quantization. DiskBBQ uses aggressive quantization to keep the searchable index compact and then rescores with the original vectors to preserve accuracy. This helps maintain strong recall while keeping disk-based search efficient.
bbq_disk is an Elasticsearch Enterprise feature. We used it here because the goal of this benchmark was to compare the strongest disk-oriented vector search configuration available in each engine for this workload, rather than licensing tiers or default features.
We didn’t include bbq_hnsw in this comparison because the benchmark was specifically designed to evaluate disk-oriented vector search under a disk-sensitive workload.
This storage topology matters because Qdrant’s rescore step reads the original float32 vectors from disk with random access on each query. On local NVMe, those reads are much faster, and Qdrant correspondingly performs better. On network-attached persistent storage, the results are consistent with that random-read rescore path becoming a more important bottleneck. Qdrant latency rises sharply as hnsw_ef increases, while Elasticsearch remains comparatively flat across the same recall progression.
We chose 2-bit quantization because Qdrant couldn’t reach the target recall range with 1-bit binary quantization. Since the two systems expose different disk-oriented vector search strategies, we tuned each one to the strongest configuration available within its current feature set.
Both systems were configured with three shards distributed across the three nodes and with two total copies of each shard in the cluster. In Elasticsearch, number_of_shards: 3 and number_of_replicas: 1 means one primary plus one replica, for two total copies. In Qdrant, shard_number: 3 and replication_factor: 2 also means two total copies, since Qdrant’s replication factor refers to the total number of copies rather than the number of additional replicas. So although the field names differ, the effective replication level was the same in both systems.
| Setting | Elasticsearch | Qdrant |
|---|---|---|
| Shards | number_of_shards: 3 | shard_number: 3 |
| Copies | number_of_replicas: 1 (1 primary + 1 replica = 2 total) | replication_factor: 2 (2 total) |
Elasticsearch mapping
Qdrant mapping
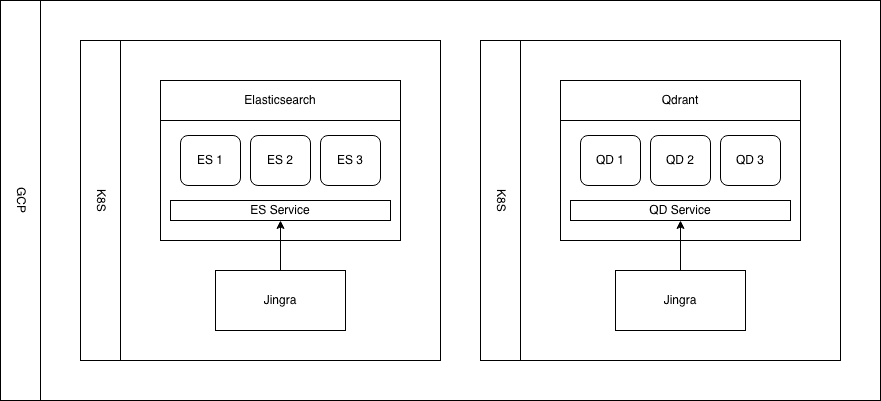
Figure 1: Diagram of the setup of the clusters.
Dataset
For this benchmark, we used the kenhktsui/wiki_dpr_e5 dataset from Hugging Face, a large-scale Wikipedia passage retrieval dataset designed for dense vector search. The corpus contains 21 million embedded passages, each represented as a 768-dimensional float32 vector, or 3,072 bytes per vector. That corresponds to about 60.1 GiB of raw vector data, before accounting for additional fields and file format overhead in the source dataset. The downloadable data.parquet file is larger at 85.2 GB for that reason.
We chose this dataset because it reflects a common production pattern in LLM, RAG, and retrieval systems: searching a large corpus of semantically embedded text while balancing recall, latency, and throughput. At 21 million vectors and roughly 60 GiB of raw vector data, it’s large enough to make disk-based vector search a relevant operating mode to evaluate.
Both engines used 2-bit quantization, reducing each vector from 3,072 bytes to 192 bytes, a 16x reduction that brings the quantized vector corpus to around 4 GB. In Qdrant, that quantized representation was kept in RAM for search, while the original vectors remained on disk. Even so, the workload remained meaningfully sensitive to network-attached storage performance because rescoring still required access to the original vectors on disk.
You can download the dataset and query files from the links below:
Jingra and recreating the benchmark
For this benchmark, we used Jingra v0.2.3 with the configurations described es-9.4-vs-qd-1.18-vector-search. Jingra handled data loading, query execution, parameter sweeps, and metric collection for both Elasticsearch and Qdrant, making the benchmark repeatable and easier to compare.
To reproduce the experiment, you need the published dataset, query set, engine configurations, and comparable cluster hardware. With those in place, Jingra can rerun the benchmark and generate similar recall, latency, and throughput measurements shown in this post.
Conclusion
At comparable recall levels, Elasticsearch DiskBBQ consistently delivered faster vector search than Qdrant in this benchmark, with higher throughput and lower latency across the recall range we tested. These results are especially notable because the comparison was made on network-attached persistent storage, where efficient storage-aware vector search becomes critical. Elasticsearch as a vector database allows organizations to achieve high recall with lower latency and higher throughput on slower persistent storage.
Just as importantly, this benchmark highlights the value of comparing engines at matched recall rather than by nominal parameter settings. Elasticsearch and Qdrant expose different controls, so the fairest comparison isn’t parameter to parameter but outcome to outcome. Across the recall range tested here, Elasticsearch maintained a clear advantage in both latency and throughput.
If you want to reproduce the experiment yourself, we’re publishing the dataset and query set used in this benchmark so others can validate the results and build on them.
Further reading:
相关内容

2026年7月13日
The disk that never woke up: what actually decided our Qdrant vector search benchmark rematch
On the same hardware, Elasticsearch and Qdrant land in the same range at 56 QPS. The io_uring disk scorer and memory claims turned out to be the two things that mattered least.

2026年7月14日
4 NVIDIA AI tasks, 1 Elasticsearch API: Embeddings, chat, completion, and rerank
Set up NVIDIA hosted models in Elasticsearch with one API key and a model ID. No custom integration code needed.
2026年7月10日
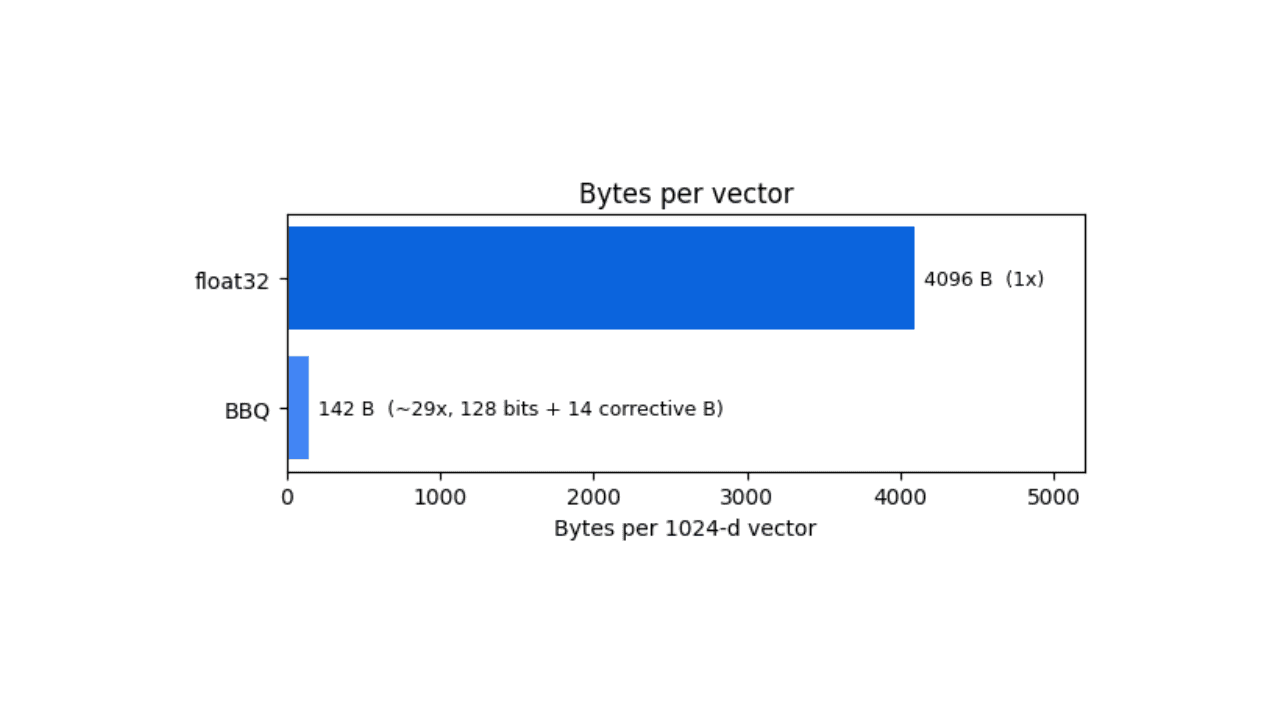
How BBQ shrinks Jina v5 embeddings by 29x without losing recall in Elasticsearch
A hands-on test comparing BBQ and float32 vector indices in Elasticsearch, measuring memory, disk and recall@10 across five languages.
2026年7月7日
Short queries, formal documents: how HyDE improved semantic search precision by 50% in Elasticsearch
HyDE boosts semantic search precision and recall by 50% on short queries. Here's how to implement it in Elasticsearch with the Inference API and semantic_text.

2026年7月2日
A simdvec deep-dive: How Elasticsearch uses neural-net and video-codec CPU instructions for vector search
Four ways Elasticsearch's vector search engine reuses neural-network, video-codec and cryptography CPU instructions for up to 6x speedups; with the math, the failed attempts and the benchmarks.