Observe, protect, and search your data with a single solution. From application monitoring to threat detection, Kibana is your versatile platform for critical use cases. Start your free 14-day trial now.
Elastic 9.4 ships a purpose-built Kibana Dashboards API: five typed endpoints, validated schemas for twelve visualization types, and a new elasticstack_kibana_dashboard Terraform resource that brings drift detection, plan diffs, per-environment deployments and git-based rollback to Kibana dashboards. Define a dashboard in HCL, review changes in a pull request and roll back by reverting a commit. Here's how it works.
Why do dashboards need an API?
The existing Saved Object API exports dashboards as a single stringified JSON blob: visualization state, internal references, UUIDs, and metadata all tangled together. Changing one field in a Kibana Lens chart means parsing 200 lines of internal state that was never meant to be read. There's no clean way to diff it, review it in a pull request, or edit it programmatically.
That makes standard GitOps workflows impossible: no drift detection, no automated promotion across environments, no rollback to a known-good state without overwriting the whole document by hand.
For large language models (LLMs), it's not easy either. The Saved Object format is too complex and error-prone for language models to generate or modify reliably; a simpler, validated schema is a prerequisite for natural-language dashboard authoring, which is exactly how we're using it in the Elastic AI Chat and dashboard skills for third-party tools integration.
What the new Dashboards API provides
The API works with your existing dashboards; it's not limited to dashboards created through the new interface.
Five endpoints cover the full lifecycle:
- Create a new dashboard (
POST /api/dashboards). - Read an existing dashboard (
GET /api/dashboards/{id}). - Update an existing dashboard or create a new one if the ID doesn’t exist (upsert) (
PUT /api/dashboards/{id}). - Delete a dashboard (
DELETE /api/dashboards/{id}). - List all existing dashboards with pagination and query parameters (
GET /api/dashboards).
What makes it different from the legacy Saved Object API:
- Typed schemas for each panel. Every visualization type (XY chart, metric, pie, gauge, heatmap, data table, treemap, mosaic, waffle, tag cloud, region map) has its own validated schema with sensible defaults. Markdown panels, controls, and drilldowns are also supported.
- ES|QL and data view support. Each visualization can be backed by a data view or an Elasticsearch Query Language (ES|QL) query; the schema cleanly separates the two modes.
- Dashboard-level filters. Condition filters (
is,is_one_of,range,exists), group filters (and/ornesting), raw Query DSL filters, and spatial filters, all typed and defined at the dashboard level. - Structural validation on write. POST and PUT validate your definition up front, so errors surface at write time rather than render time.
- Layout control. Panels specify grid position on a 48-column grid; dashboards can be organized into collapsible sections.
- Library panels. Panels can exist only as part of the dashboard, or they can be saved in the library if they need to be reused in multiple dashboards. The API supports both types of panels.
How the Kibana Dashboards API was built: the transforms layer
At the outset of this project, it was quickly discovered that the biggest culprit to the unusability of the Saved Objects APIs was the stringification of the dashboard contents. The dashboard’s entire panels array, for instance, was stored in one key, called “panelsJSON,” which could be thousands upon thousands of characters long, all stuffed into one line. We lovingly dubbed these fields “JSON Bags.”
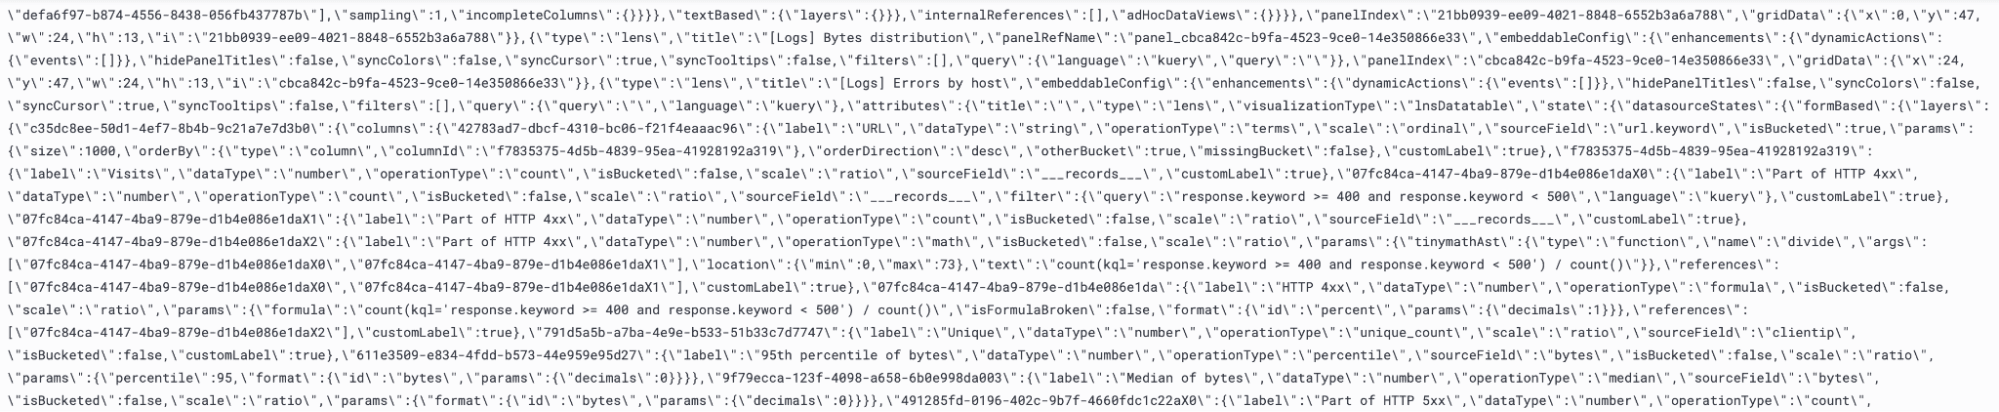
If we could stop the stringification process for these keys and instead store the JSON directly in Elasticsearch, all of our problems would be solved. Unfortunately, after we de-stringified the JSON and truly saw what was inside, we found a jumbled mess.
Kibana has stored user-created UI content since day one. This content was stored with exactly one purpose in mind: allowing the UI to restore that content later. Because the actual shape of the storage was inconsequential, it was stored in Elasticsearch as a direct snapshot of the UI state. UI state is optimized for the specific UI that created it and is not meant to be looked at. Structures like deep nesting, objects with randomly generated IDs, parallel arrays, and internal references between different portions of the state are helpful in UI state but detrimental to readability.
Here, we faced a choice:
- Leave the existing UI code in place and build a new alternative API schema for the public endpoints that bypasses the existing dashboard system and allows for some of its most-used functionality.
OR
- Inject a new API schema into the existing dashboard system and build middleware to allow the same API schema to underpin both the UI and the public endpoints.
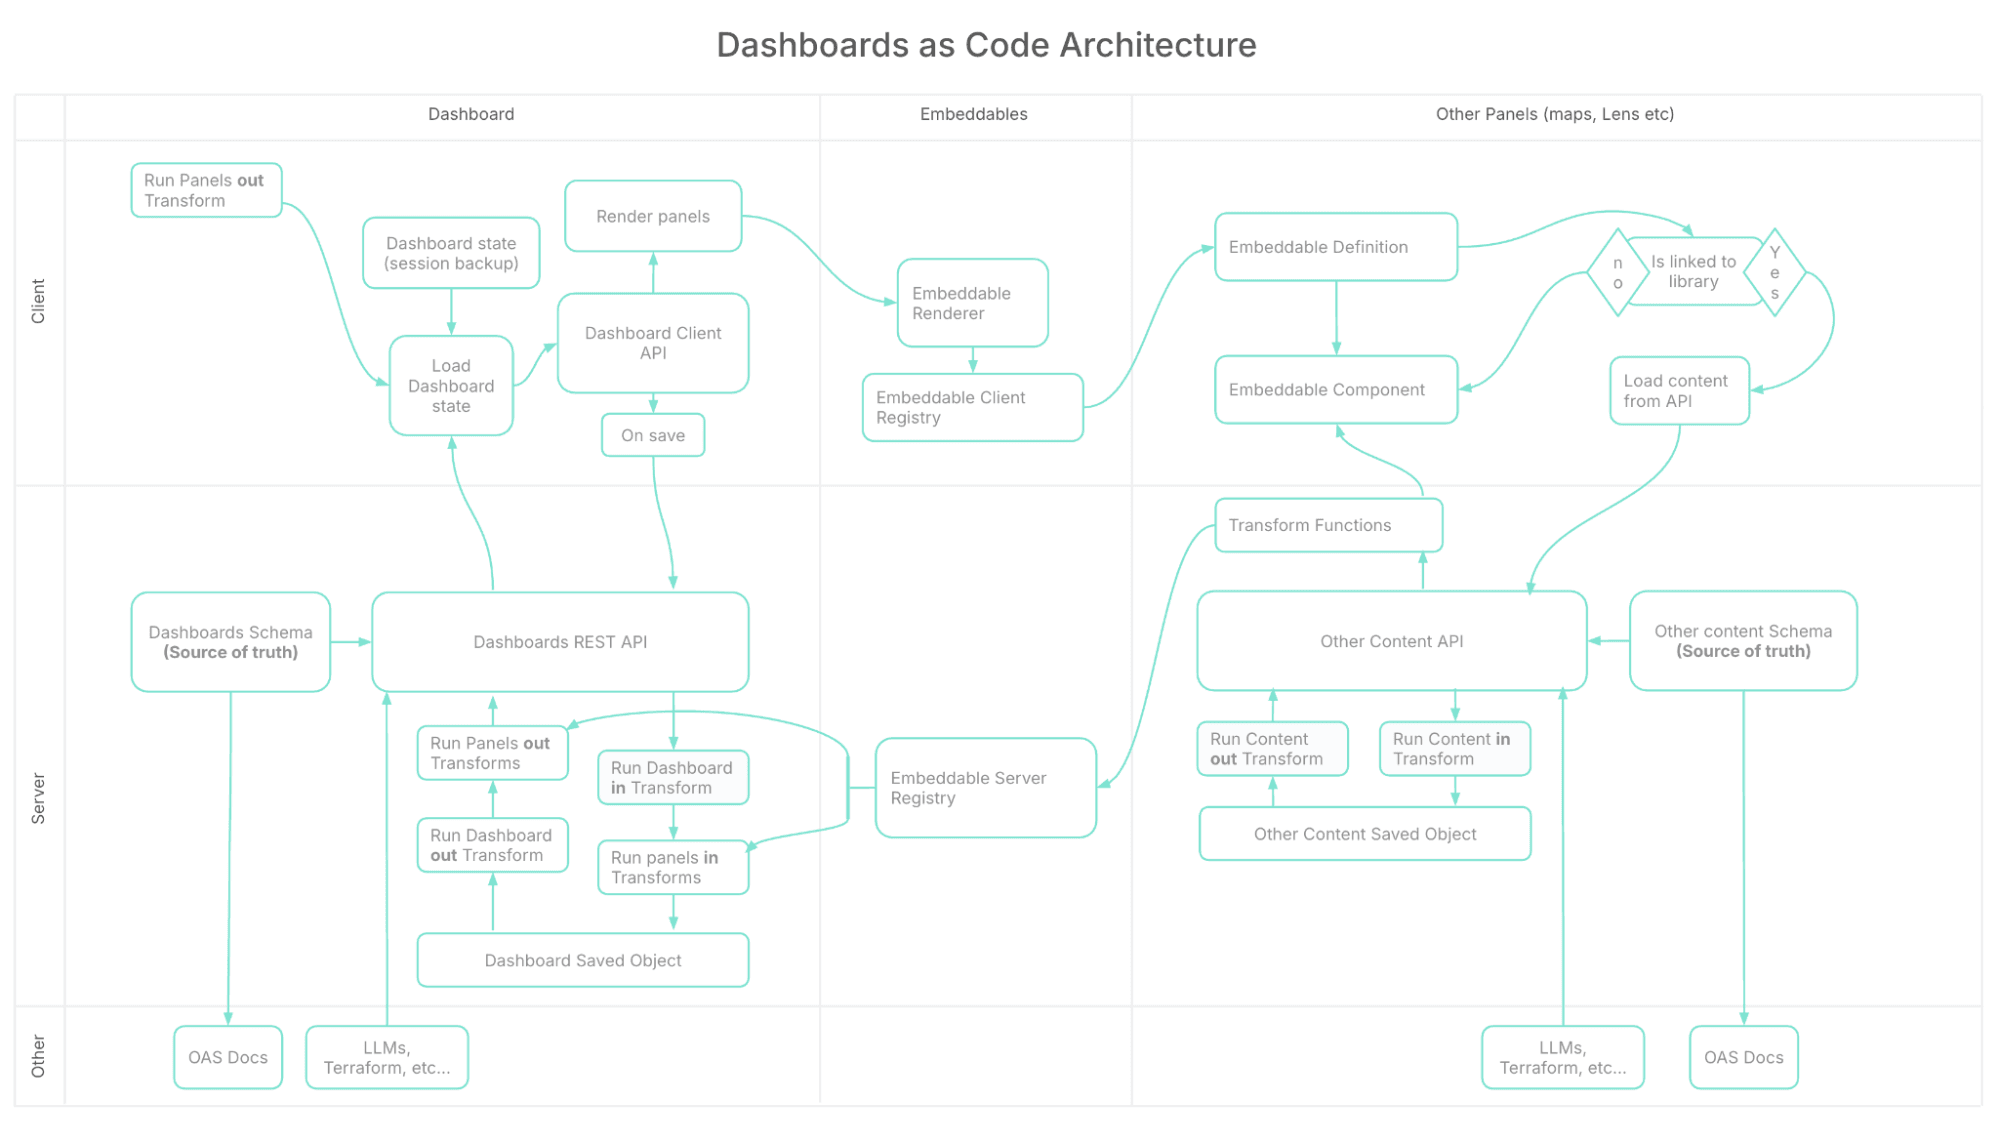
We chose the second option and set about the monumental task of crystalizing and redefining every key in every panel of the jumbled mess of existing UI state into something we would be comfortable publishing in a formal API schema. This process was completed over a long time frame, by multiple teams, in live code. Backward compatibility was of utmost importance as, throughout the entire process, dashboards were being saved and loaded by our users every day.
The middleware that made this possible is called the transforms layer; it’s responsible for translating back and forth between the legacy, stringified, state shape and the cleaner API shape. Transform functions are registered for each panel that a dashboard can host. The teams that owned those panels would iteratively improve on the schema and make matching changes to the UI with each PR to ensure that the UI continues to operate correctly.
As each panel registers its transform functions with the dashboard, it also has the ability to register a schema that becomes part of the contract of the public Dashboards API. Schemas registered like this must be fully complete to reduce the risk of breaking changes to the API in the future. If a panel type doesn’t have a schema registered, it will be stripped from public API responses. This allows us to iteratively include more content in the public APIs into tech preview and beyond, while ensuring that users who rely on the API can trust that the shape will not change.
Using the Kibana Dashboards API: a walkthrough
The Kibana Dashboards API is available in Elastic 9.4 and works with existing dashboards.
The best place to get started is the Dashboards API documentation, where you’ll find all schema definitions and examples.
The following example uses the Kibana sample logs data to walk through the API; not a realistic GitOps workflow, but a simple way to see how it works.
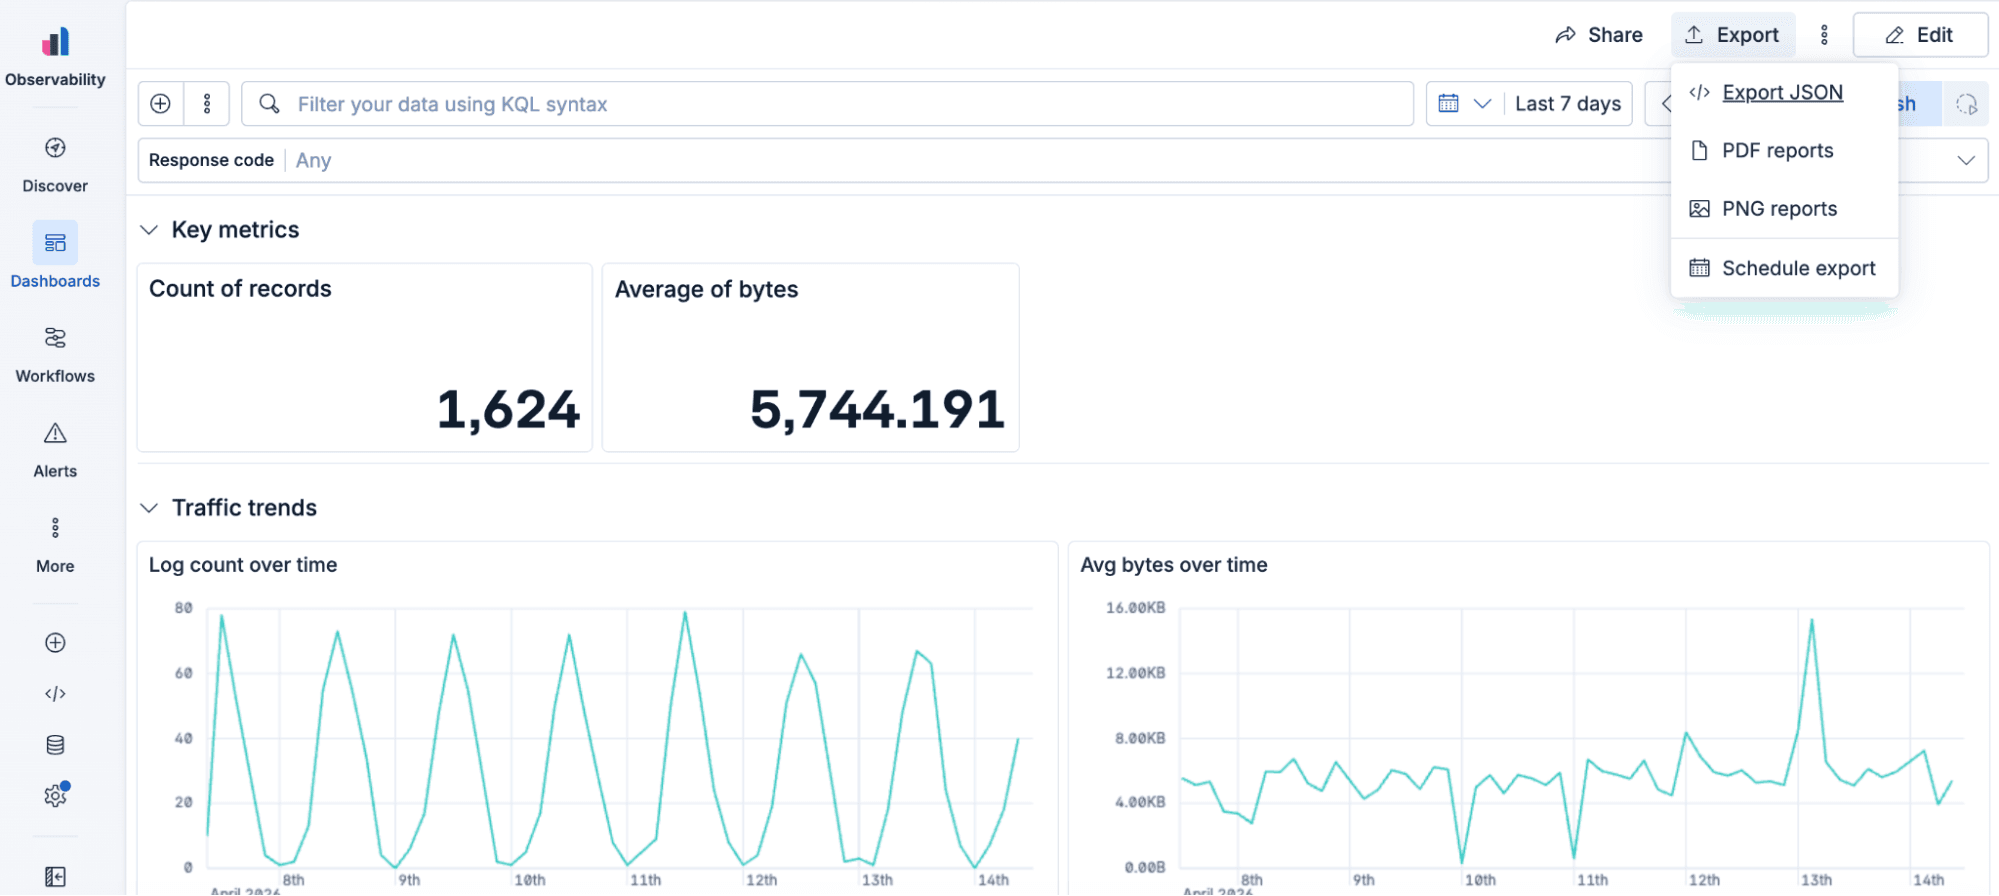
- Open a dashboard, and click Export JSON from the top menu. This dashboard contains one control and two sections: one with two metrics and another one with two time series.
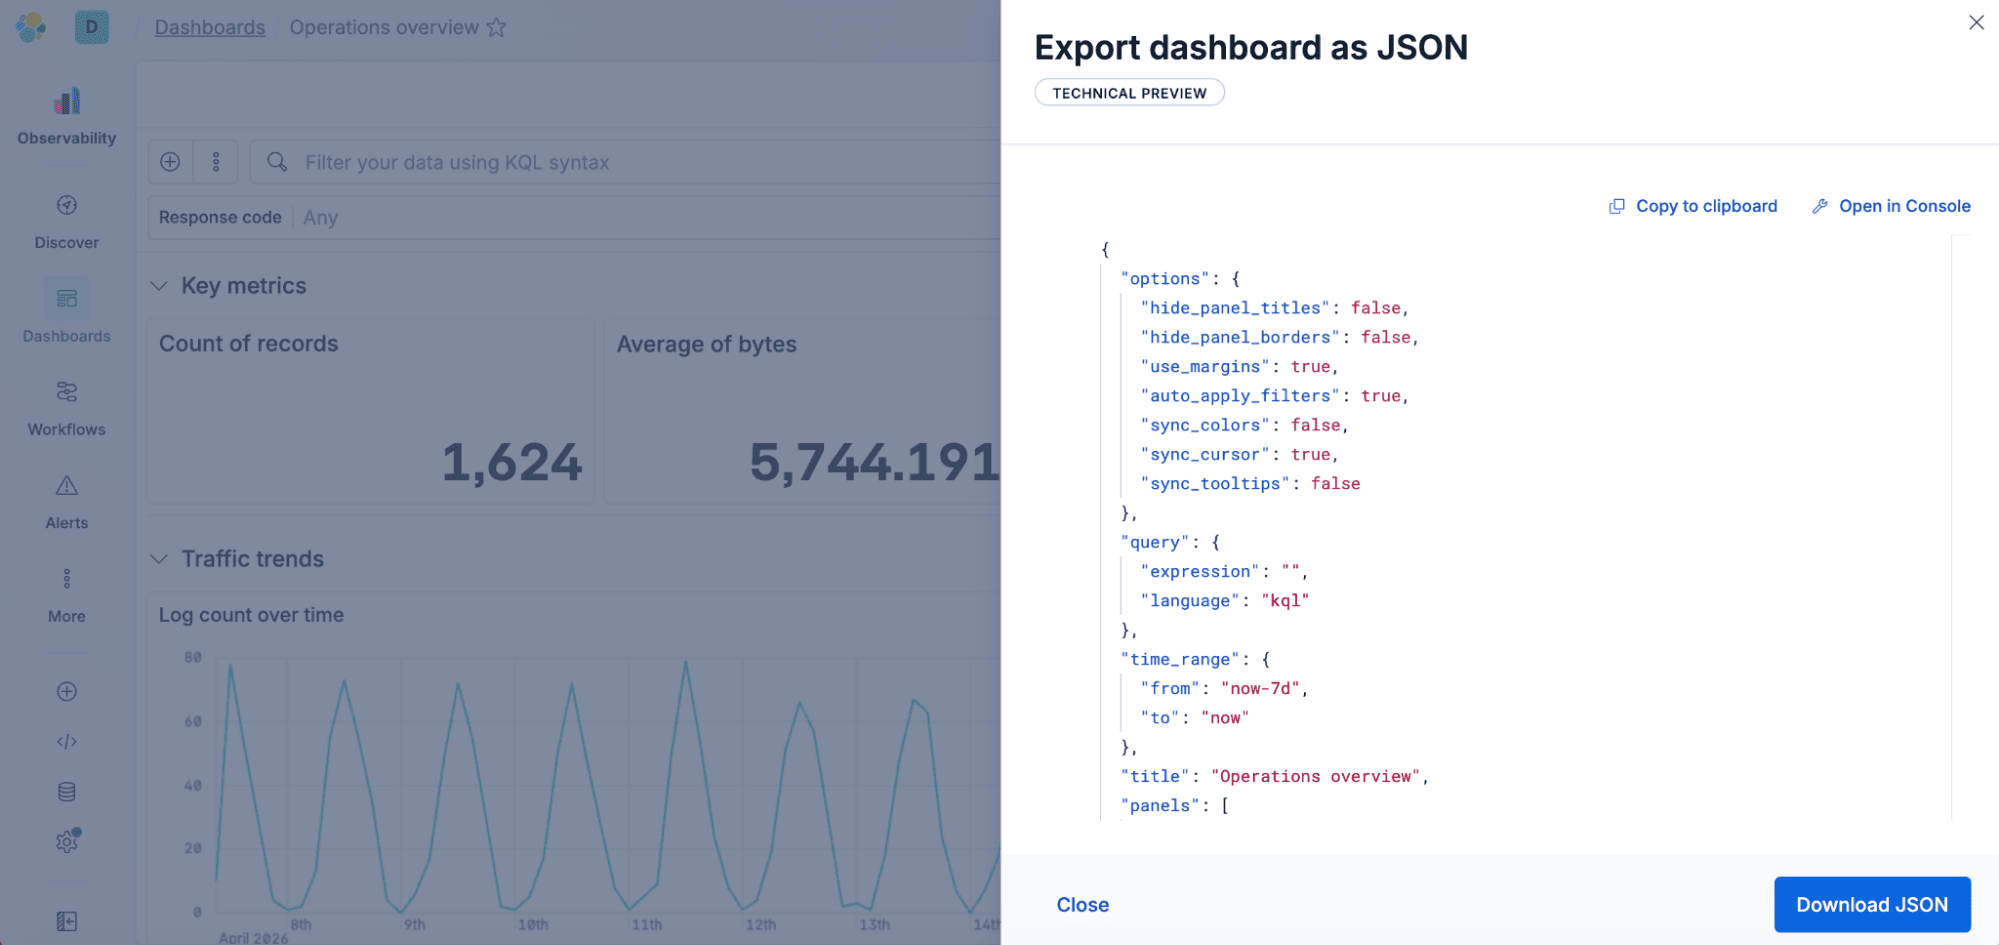
- You’ll see the JSON of this dashboard displayed in a flyout. Now click Open in Console.
- You’ll be redirected to the Developer tools, and a new POST request is automatically prefilled for you with the HTTP request.
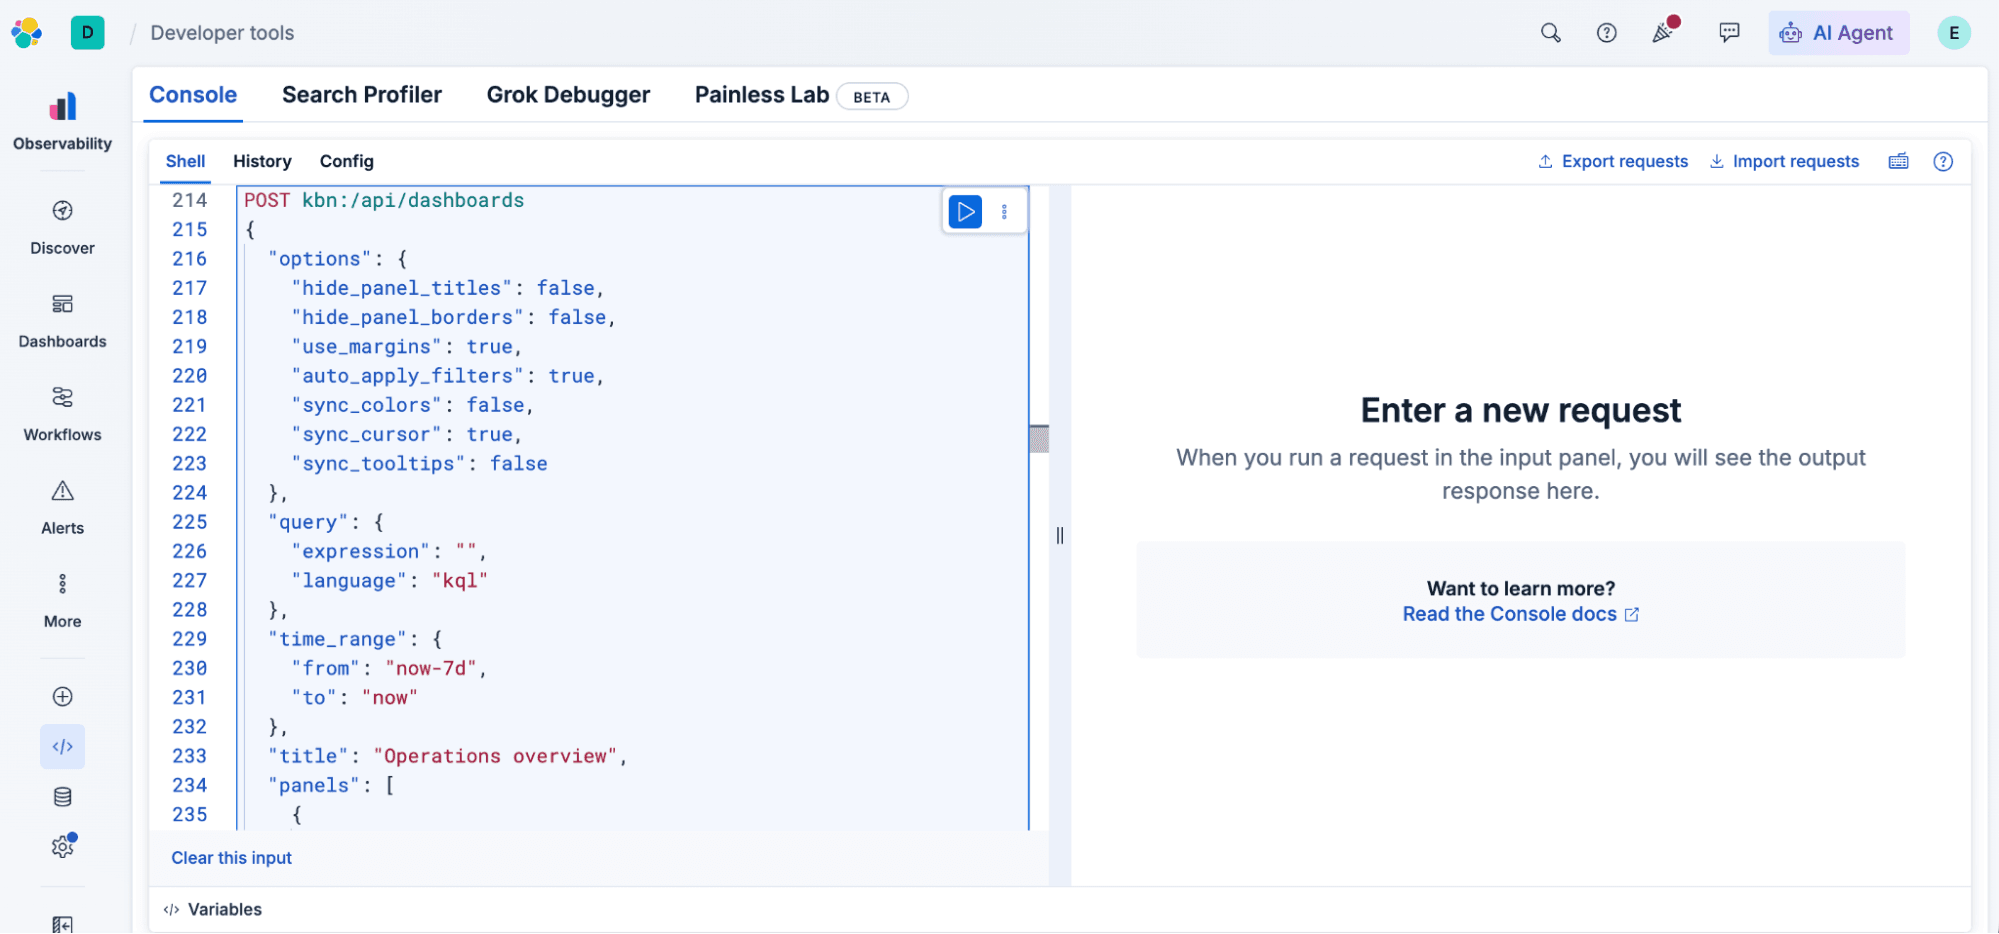
- Include the space ID in the POST request URL.
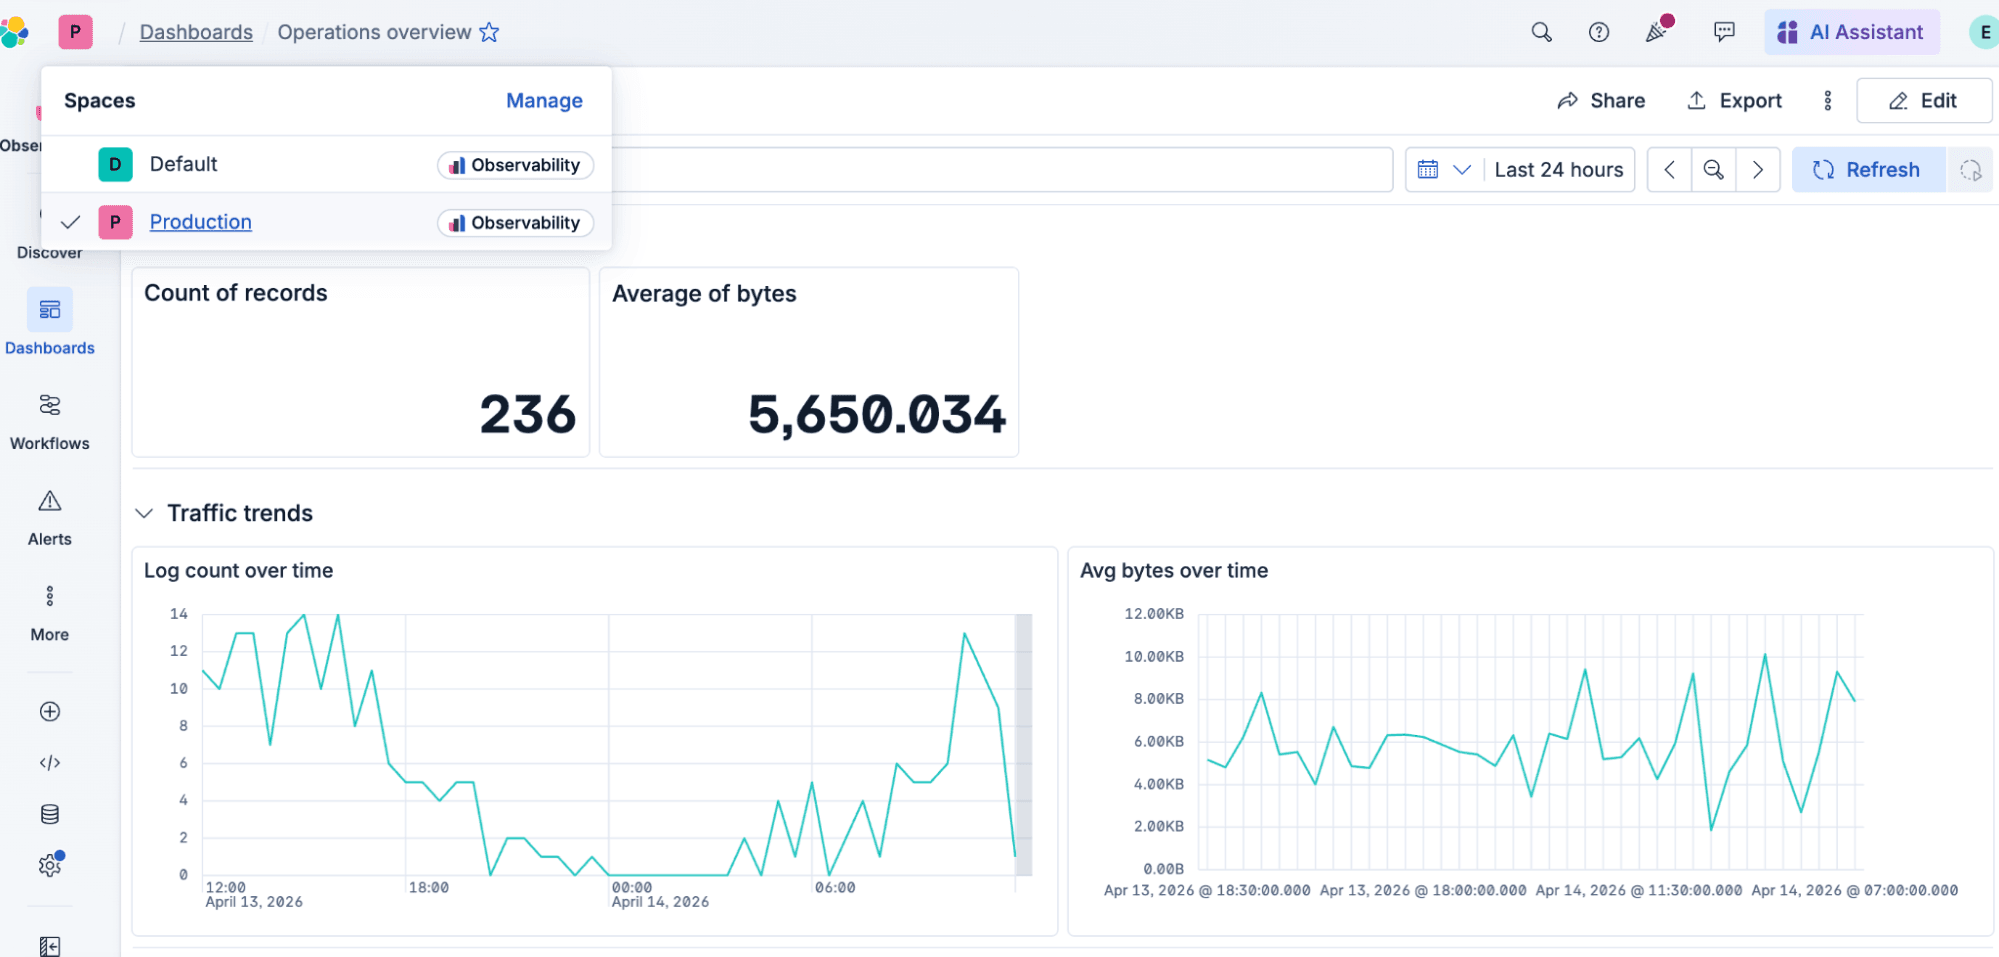
- Go to the destination space, and see how the dashboard has been created.
Terraform support: Dashboards as native HCL
The Elastic Stack Terraform provider ships a new elasticstack_kibana_dashboard resource that maps the Dashboards API to native Terraform HCL. This means you get terraform plan, terraform apply, drift detection, import, and all the standard Terraform lifecycle operations for dashboards.
The provider doesn't cover every API capability yet; it focuses on the features that matter most for GitOps workflows.
Terraform example
Example: a Kibana dashboard in Terraform HCL
Start with the basics: a dashboard with a time series chart tracking request counts, a metric panel showing a KPI, and a markdown panel for context.
This is readable, reviewable, and diffable. When someone changes the time range or adds a filter, the terraform plan output tells you exactly what changed.
Dashboard access control in Terraform
The Terraform provider supports the dashboard access control model, letting you restrict write access and set ownership:
When access_mode is set to "write_restricted", only the creator can make changes. This is especially useful for production dashboards where you want to ensure all changes flow through your Terraform pipeline.
The GitOps workflow for Kibana dashboards
With the new Dashboards API and Terraform support, you can now treat dashboards like any other infrastructure artifact:
- Define dashboards in HCL, alongside your Elasticsearch indices, data views, and alerting rules.
- Review changes through pull requests:
terraform planshows exactly what's changing in each visualization. - Deploy across environments using Terraform workspaces or variable files per environment.
- Detect drift when someone edits a dashboard manually in the Kibana UI:
terraform planwill show the difference. - Roll back by reverting to a previous commit and running
terraform apply.
Elastic users can now enjoy the benefit of GitOps-enabled dashboards, with a typed, HCL-native experience that goes beyond just managing dashboards.
Getting started with the Terraform provider
The elasticstack_kibana_dashboard resource requires Elastic Stack 9.4 or later and is available in the latest versions of the Elastic Stack Terraform provider.
To get started:
- Set up your provider with Kibana connectivity:
- Define your first dashboard using any of the examples above.
- Run
terraform planto preview, and then runterraform applyto create. - Import existing dashboards into Terraform state:
For the full resource schema and documentation, visit the Terraform Registry.
Kibana Dashboards API roadmap
The Dashboards API is in technical preview in Elastic 9.4, and both the API and Terraform provider are actively evolving. On the roadmap:
- All panel types will be supported by the API. There are a few panels that are still missing API support, like the Links panel, Machine Learning panels, Alerts, Log analysis panels, Vega visualization, and Maps.
- More panel types in Terraform. Typed HCL config blocks for image, links, Service Level Objective (SLO), and Synthetics panels that the API already supports.
- Dashboard-level filters in Terraform. Filter pills, controls, and drilldowns that the API already supports.
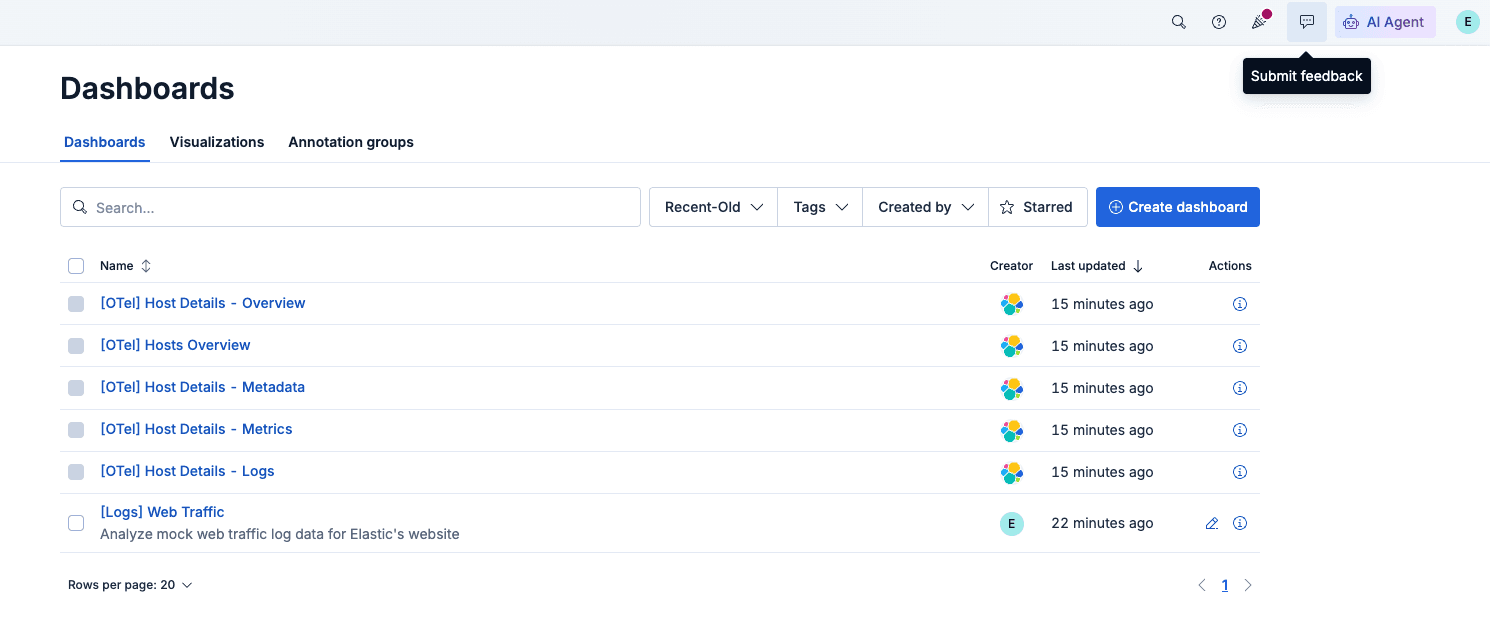
Try it out and let us know what you think. Send your feedback by using the Submit Feedback icon in the top menu, file issues on the Terraform provider GitHub repo, or join the conversation on Discuss. We’re looking forward to hearing from you!
相关内容
2026年7月23日
On-prem in under 5 minutes: Jina embedding models now available for on-prem deployment
All 28 Jina AI models, including rerankers, as ready-to-deploy Docker containers, with zero telemetry and no license server. Drop-in compatible with OpenAI, Cohere, Voyage AI and Elastic Inference Service APIs.

2026年7月21日
4 NVIDIA AI tasks, 1 Elasticsearch API: Embeddings, chat, completion, and rerank
Set up NVIDIA hosted models in Elasticsearch with one API key and a model ID. No custom integration code needed.

2026年7月1日
One command. Natural language. Your Elasticsearch data, straight to the terminal.
Query your Elasticsearch data from the terminal in plain English. The official Elastic GitHub Copilot CLI plugin generates and runs ES|QL queries against your cluster. No Kibana, no manual syntax.
2026年6月30日
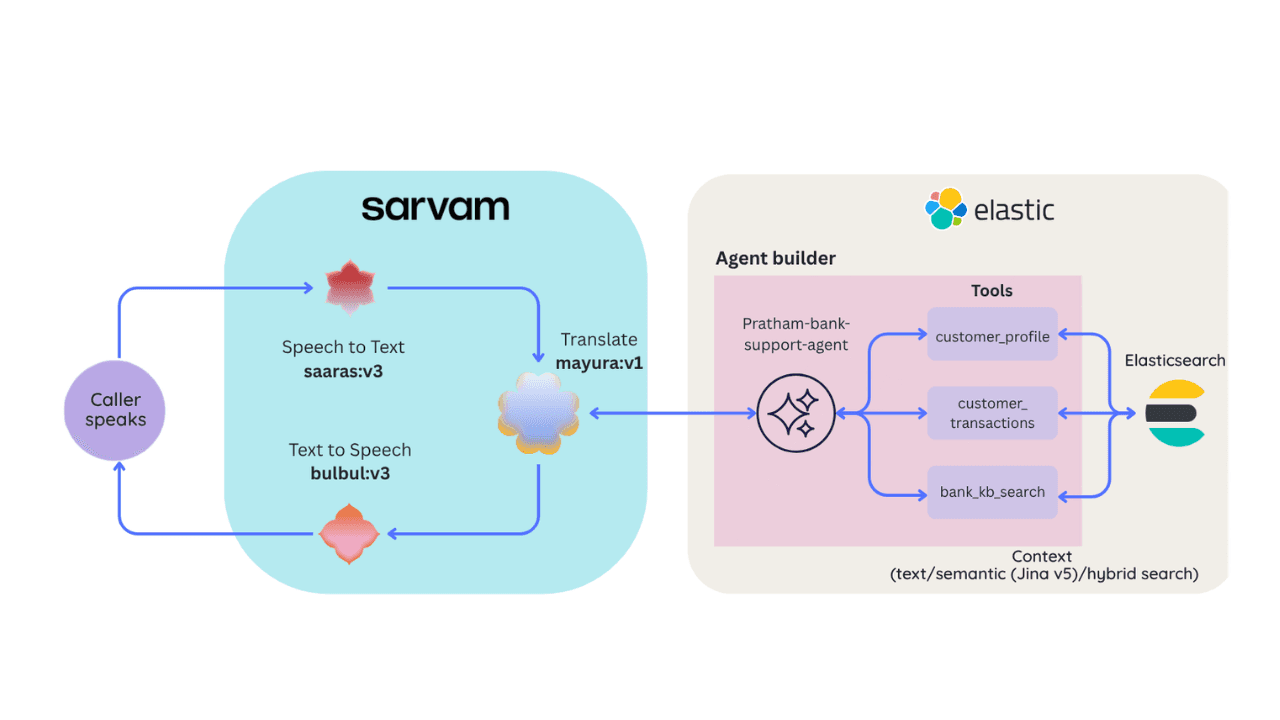
Building a multilingual voice agent with Elastic Agent Builder & Sarvam AI
A working demo combining Sarvam AI speech with Elastic Agent Builder: identity verification, per-customer ES|QL queries, and mid-call language switching across 22 Indian languages without multilingual indices.
2026年6月26日
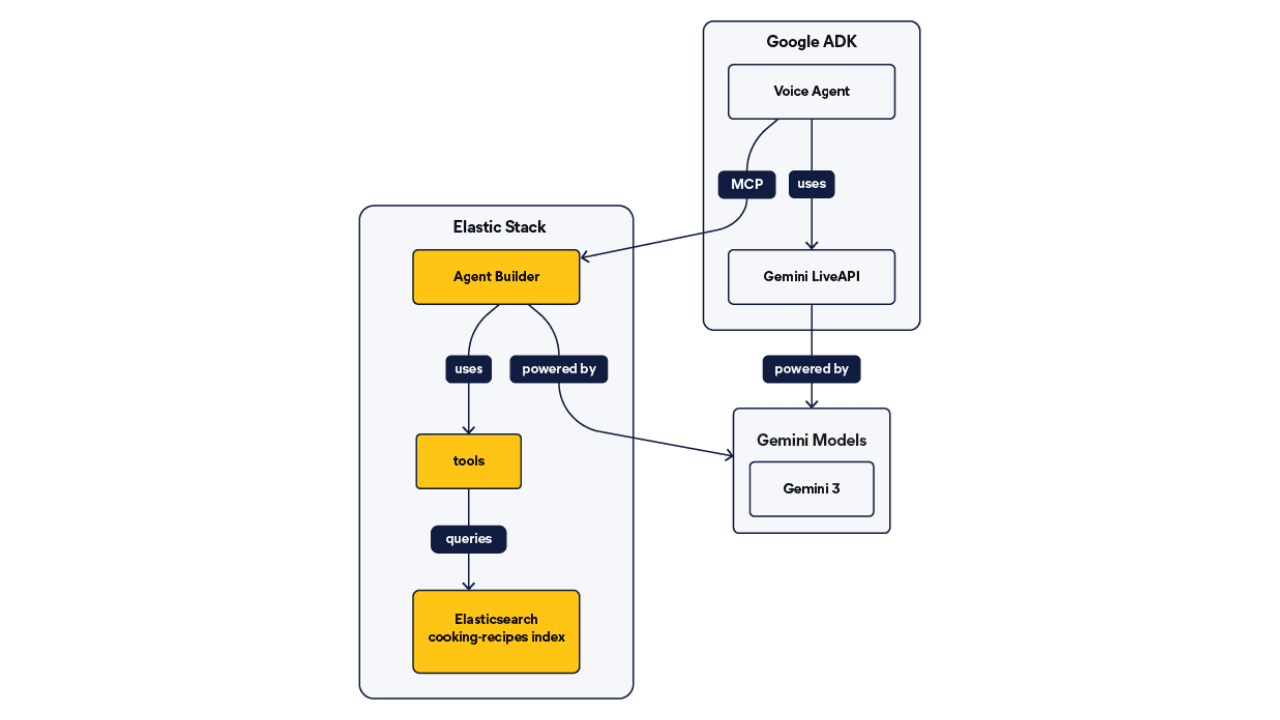
Talk to your Elasticsearch data: building a real-time voice agent with Google ADK and MCP in 3 components
Wire Google ADK's real-time voice streaming to your Elasticsearch data via Agent Builder's built-in MCP server; no custom integration code required.