Distributed Tracing Articles
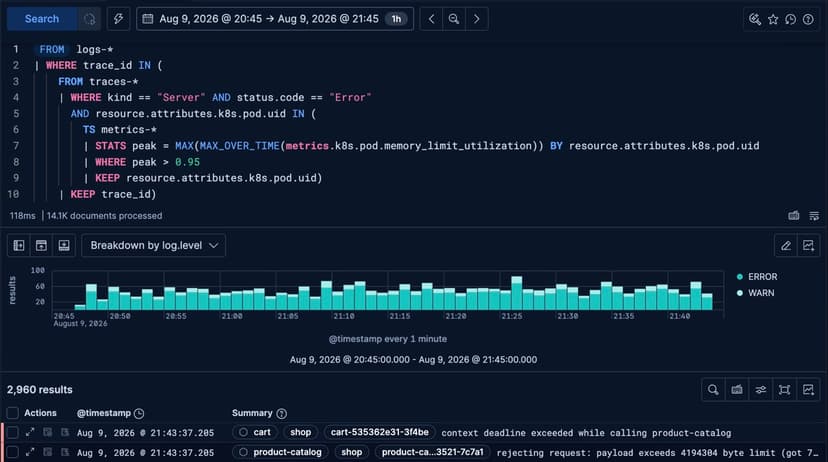
Correlate logs, metrics, and traces in one ES|QL query
Walk through four investigations, from CPU saturation to pod memory pressure, each answered by a single query across signal types.
How Elastic cut OpenTelemetry tail sampling memory by 65% with disk-backed trace storage
Elastic contributed two features upstream to the OTel Collector's tail sampling processor. The span-ingest strategy lets sampling decisions happen earlier, and Pebble tail storage moves trace buffering to disk. It costs more CPU, but operators can raise decision_wait and num_traces without OOM kills.

Bridging the Gap: End-to-End Observability from Cloud Native to Mainframe
Achieving end-to-end observability in hybrid enterprise environments, where modern cloud-native applications interact with critical, yet often opaque, IBM mainframe systems is a challenge. By utilizing IBM Z Observability Connect, which enables OTel output, with Elastic Observability is a solution, transforming your mainframe black box into a fully observable component in your deployment

Trace your Azure Function application with Elastic Observability
Serverless applications deployed on Azure Functions are growing in usage. This blog shows how to deploy a serverless application on Azure functions with Elastic Agent and use Elastic's APM capability to manage and troubleshoot issues.

Trace-based testing with Elastic APM and Tracetest
Want to run trace-based tests with Elastic APM? We're happy to announce that Tracetest now integrates with Elastic Observability APM. Check out this hands-on example of how Tracetest works with Elastic Observability APM and OpenTelemetry.